


 |
市場調查報告書
商品編碼
1998721
自動駕駛汽車開發平台市場機會、成長要素、產業趨勢分析及2026-2035年預測Autonomous Vehicle Development Platform Market Opportunity, Growth Drivers, Industry Trend Analysis, and Forecast 2026 - 2035 |
||||||
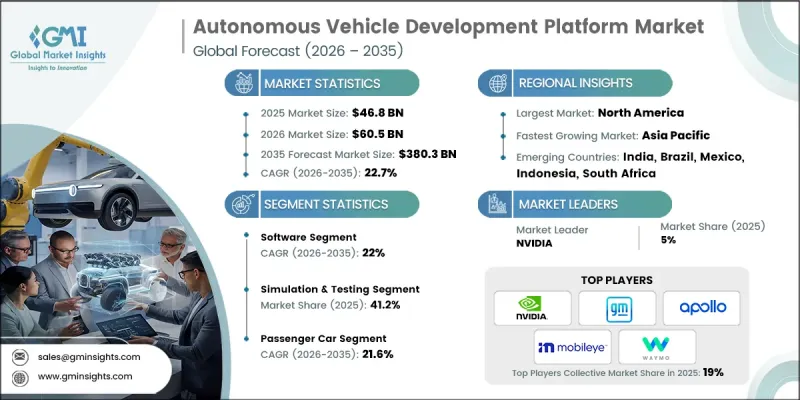
2025 年全球自動駕駛汽車開發平台市場價值為 468 億美元,預計到 2035 年將達到 3,803 億美元,年複合成長率為 22.7%。
機器學習和人工智慧的進步推動了市場擴張。這些技術增強了自動駕駛車輛的感知、決策和路徑規劃能力,使其能夠在複雜環境中導航。高級駕駛輔助系統 (ADAS) 和分階段自動駕駛功能與原始設備製造商 (OEM) 車輛的日益融合,推動了對綜合開發、測試和檢驗平台的需求。領先的汽車製造商和科技公司正大力投資加速創新並提昇平台能力,從而加速商業部署。基於雲端的模擬環境正日益受到關注,因為它們能夠實現大規模測試、跨分散式團隊的協作工作流程,並且與車載測試相比還能降低成本。人工智慧驅動的模擬進一步完善了極端情況場景建模,提高了演算法精度,同時最大限度地減少了成本高昂的現場測試。該市場的特點是持續的軟體創新、可擴展的雲端平台以及對人工智慧主導的自動駕駛能力的策略性投資。
| 市場範圍 | |
|---|---|
| 開始年份 | 2025 |
| 預測期 | 2026-2035 |
| 上市時的市場規模 | 468億美元 |
| 預計金額 | 3803億美元 |
| 複合年成長率 | 22.7% |
預計到2025年,軟體產業將佔據72%的市場佔有率,並在2035年之前以22%的複合年成長率成長。用於自動駕駛汽車開發的軟體包括感測器模擬、感知建模、地圖建構、定位和決策框架,從而能夠在各種駕駛條件下進行虛擬檢驗。這些平台支援資料收集、標註以及機器學習模型的訓練和測試,有助於改善目標偵測、路徑規劃和車輛控制系統。
預計到2025年,乘用車市佔率將達到62%,並在2026年至2035年間以21.6%的複合年成長率成長。乘用車快速引入L2+和L3級自動駕駛功能,推動了對開發平台的需求。汽車製造商(OEM)正依靠模擬、感測器融合軟體和基於人工智慧的檢驗工具來加速功能部署、符合法規要求、通過安全測試,並將聯網汽車系統與空中下載(OTA)更新整合。這些平台正透過大規模資料訓練和數位雙胞胎測試,著重實現人工智慧驅動的個人化、預測性決策和先進的感知系統,以提升都市區駕駛性能。
預計2025年,美國自動駕駛汽車開發平台市場規模將達131億美元。憑藉著人工智慧、雲端運算和模擬技術的優勢,美國已成為全球自動駕駛汽車平台開發的領導者。大學、研究機構和汽車製造商之間的合作正在不斷改善機器學習、感知和決策框架。創業投資正在支持Start-Ups和平台技術創新,進一步鞏固了美國的領先地位。
目錄
第1章:調查方法
第2章執行摘要
第3章業界考察
- 生態系分析
- 供應商情況
- 利潤率
- 成本結構
- 每個階段增加的價值
- 影響價值鏈的因素
- 中斷
- 影響產業的因素
- 促進因素
- 高級人工智慧和機器學習整合
- ADAS和自動駕駛技術的擴展
- 來自原始設備製造商和科技公司的投資增加
- 雲端運算和模擬基礎設施的擴展
- 產業潛在風險與挑戰
- 高昂的開發成本與研發成本
- 監管不確定性和合規性挑戰
- 市場機遇
- 4級至5級自動駕駛汽車的需求日益成長
- 數位雙胞胎與模擬技術的融合
- 科技公司與汽車製造商之間的合作關係
- 新興市場的採用情況
- 促進因素
- 成長潛力分析
- 監理情勢
- 北美洲
- 美國國家公路交通安全管理局(NHTSA)
- 加拿大運輸部車輛安全標準(CMVSS)
- 歐洲
- 歐洲車輛類型認證(WVTA)
- 歐洲經濟共同體法規 124 (R124)
- 亞太地區
- 日本汽車標準協會(JASO)
- AIS(汽車產業標準)- 印度
- 拉丁美洲
- 巴西國家交通運輸委員會(CONTRAN)-第242號決議
- 墨西哥官方標準 (Normas Oficiales Mexicanas)
- 中東和非洲
- ESMA(阿拉伯聯合大公國標準化和計量局)
- 南非標準局(SABS)
- 北美洲
- 波特五力分析
- PESTEL 分析
- 科技與創新趨勢
- 當前技術趨勢
- 新興技術
- 價格分析(基於初步調查)
- 對過去價格趨勢的分析
- 按業務類型分類的定價策略(溢價/價值/成本加成)
- 成本細分分析
- 專利分析(基於初步研究)
- 永續性和環境方面
- 永續計劃
- 減少廢棄物策略
- 生產中的能源效率
- 環保意識的舉措
- 關於碳足跡的考量
- 人工智慧和生成式人工智慧對市場的影響
- 利用人工智慧改造現有經營模式
- 按細分市場分類的生成式人工智慧用例和部署藍圖
- 風險、限制和監管考量
- 基礎設施和實施情況(基於初步調查)
- 按地區和購買者群體分類的採用率和滲透率
- 基礎設施投資的可擴展性限制和趨勢
- 預測假設和情境分析(基於初步研究)
- 基本案例-驅動複合年成長率的關鍵宏觀經濟與產業變量
- 樂觀情境-宏觀經濟與產業的順風
- 悲觀情景-宏觀經濟放緩或產業逆風
第4章 競爭情勢
- 介紹
- 企業市佔率分析
- 北美洲
- 歐洲
- 亞太地區
- 拉丁美洲
- 中東和非洲(MEA)
- 主要市場公司的競爭分析
- 競爭定位矩陣
- 主要進展
- 併購
- 夥伴關係與合作
- 新產品發布
- 業務拓展計劃及資金籌措
- 企業級分層基準測試
- 層級分類標準與選擇標準
- 按收入、地區和創新能力分類的層級定位矩陣。
第5章 市場估計與預測:依組件分類,2022-2035年
- 軟體
- 模擬和測試軟體
- 感測器融合與感知軟體
- 機器學習和人工智慧框架
- 數據管理和標註軟體
- 地圖和定位軟體
- 控制與決策軟體
- 服務
- 專業服務
- 託管服務
第6章 市場估計與預測:依功能分類,2022-2035年
- 感測器模擬
- 阻塞與分析
- 仿真與測試
第7章 市場估計與預測:依最終用途分類,2022-2035年
- 汽車製造商
- 科技公司
- 研究機構和大學
- 政府/國防
- 其他
第8章 市場估價與預測:依車輛類型分類,2022-2035年
- 搭乘用車
- 掀背車
- SUV
- 轎車
- 商用車輛
- LCV
- MCV
- 重型車輛(HCV)
第9章 市場估算與預測:依部署類型分類,2022-2035年
- 本地部署平台
- 基於雲端的平台
- 混合實現
第10章 市場估價與預測:依地區分類,2022-2035年
- 北美洲
- 美國
- 加拿大
- 歐洲
- 德國
- 英國
- 法國
- 義大利
- 西班牙
- 北歐國家
- 俄羅斯
- 波蘭
- 羅馬尼亞
- 亞太地區
- 中國
- 印度
- 日本
- 韓國
- ANZ
- 越南
- 印尼
- 菲律賓
- 拉丁美洲
- 巴西
- 墨西哥
- 阿根廷
- 中東和非洲(MEA)
- 南非
- 沙烏地阿拉伯
- 阿拉伯聯合大公國
第11章:公司簡介
- 世界公司
- Baidu(Apollo)
- GM
- Mercedes-Benz
- Microsoft
- Mobileye(Intel)
- NVIDIA
- Qualcomm
- Tesla
- Toyota
- Waymo(Alphabet)
- 當地公司
- Ansys
- Aurora Innovation
- dSPACE
- Momenta
- Pony.ai
- 新興企業
- Applied Intuition
- CARLA Simulator(Open-Source Community)
- Cognata
- Foretellix
- Parallel Domain
- Scale AI
The Global Autonomous Vehicle Development Platform Market was valued at USD 46.8 billion in 2025 and is estimated to grow at a CAGR of 22.7% to reach USD 380.3 billion by 2035.
Market expansion is fueled by advances in machine learning and artificial intelligence, which enhance autonomous vehicle perception, decision-making, and route planning, enabling navigation in complex environments. Increasing integration of advanced driver assistance systems (ADAS) and incremental autonomous features in OEM vehicles is driving demand for comprehensive development, testing, and validation platforms. Major automakers and technology firms are investing heavily to accelerate innovation and enhance platform capabilities, facilitating faster commercial deployment. Cloud-based simulation environments are gaining traction as they enable large-scale testing, collaborative workflows across distributed teams, and cost reductions compared with physical test vehicles. AI-powered simulation further refines edge-case scenario modeling, improving algorithm accuracy while minimizing expensive real-world trials. The market is defined by continual software innovation, scalable cloud platforms, and strategic investments in AI-driven autonomous functionality.
| Market Scope | |
|---|---|
| Start Year | 2025 |
| Forecast Year | 2026-2035 |
| Start Value | $46.8 Billion |
| Forecast Value | $380.3 Billion |
| CAGR | 22.7% |
The software segment accounted for 72% share in 2025 and is expected to grow at a CAGR of 22% through 2035. Autonomous vehicle development software includes sensor simulation, perception modeling, mapping, localization, and decision-making frameworks, allowing virtual validation under diverse driving conditions. These platforms support data collection, annotation, and the training and testing of machine learning models, improving object detection, path planning, and vehicle control systems.
The passenger car segment held 62% share in 2025 and is expected to grow at a CAGR of 21.6% from 2026 to 2035. Passenger vehicles are rapidly incorporating Level 2+ and Conditional Level 3 autonomy, driving demand for development platforms. OEMs rely on simulation, sensor fusion software, and AI-based validation tools to accelerate feature deployment, comply with regulations, pass safety tests, and integrate connected vehicle systems with over-the-air updates. Platforms emphasize AI personalization, predictive decision-making, and advanced perception systems through large-scale data training and digital twin testing, improving urban driving performance.
U.S. Autonomous Vehicle Development Platform Market generated USD 13.1 billion in 2025. The country leads globally in AV platform development due to its concentration of AI, cloud, and simulation expertise. Collaboration between universities, research institutions, and OEMs strengthens machine learning, perception, and decision-making frameworks. Venture capital investment supports innovation in start-ups and platform technologies, further reinforcing U.S. leadership.
Key players in the Global Autonomous Vehicle Development Platform Market include NVIDIA, Waymo (Alphabet), Tesla, GM / Cruise, Mobileye (Intel), Mercedes-Benz, Toyota, Baidu (Apollo), Microsoft, and Qualcomm. Companies in the Autonomous Vehicle Development Platform Market are focusing on several strategies to strengthen their market position. Key approaches include heavy investment in AI and machine learning to enhance perception and decision-making capabilities. Firms are developing scalable cloud-based simulation environments for faster and cost-effective validation of autonomous systems. Strategic partnerships with OEMs, technology providers, and research institutions enable collaboration on advanced sensor fusion, mapping, and digital twin technologies. Companies are also expanding globally to tap into emerging markets and adopting modular, adaptable platforms to meet varying vehicle types and autonomy levels.
Table of Contents
Chapter 1 Methodology
- 1.1 Research approach
- 1.2 Quality commitments
- 1.3 GMI AI policy & data integrity commitment
- 1.4 Research trail & confidence scoring
- 1.4.1 Research trail components
- 1.4.2 Scoring components
- 1.5 Data collection
- 1.5.1 Partial list of primary sources
- 1.6 Data mining sources
- 1.6.1 Paid sources
- 1.7 Base estimates and calculations
- 1.7.1 Base year calculation
- 1.8 Forecast model
- 1.9 Research transparency addendum
Chapter 2 Executive Summary
- 2.1 Industry 360° synopsis
- 2.2 Key market trends
- 2.2.1 Regional
- 2.2.2 Component
- 2.2.3 Functionality
- 2.2.4 End use
- 2.2.5 Vehicle
- 2.2.6 Deployment mode
- 2.3 TAM analysis, 2026-2035
- 2.4 CXO perspectives: Strategic imperatives
Chapter 3 Industry Insights
- 3.1 Industry ecosystem analysis
- 3.1.1 Supplier landscape
- 3.1.2 Profit margin
- 3.1.3 Cost structure
- 3.1.4 Value addition at each stage
- 3.1.5 Factor affecting the value chain
- 3.1.6 Disruptions
- 3.2 Industry impact forces
- 3.2.1 Growth drivers
- 3.2.1.1 Advanced AI and machine learning integration
- 3.2.1.2 Increasing adoption of ADAS and autonomous technologies
- 3.2.1.3 Growing investment from OEMs and tech companies
- 3.2.1.4 Expansion of cloud computing and simulation infrastructure
- 3.2.2 Industry pitfalls and challenges
- 3.2.2.1 High development and R&D costs
- 3.2.2.2 Regulatory uncertainty and compliance challenges
- 3.2.3 Market opportunities
- 3.2.3.1 Rising demand for Level 4-5 autonomous vehicles
- 3.2.3.2 Integration of digital twin and simulation technologies
- 3.2.3.3 Partnerships between tech companies and automakers
- 3.2.3.4 Emerging markets adoption
- 3.2.1 Growth drivers
- 3.3 Growth potential analysis
- 3.4 Regulatory landscape
- 3.4.1 North America
- 3.4.1.1 National Highway Traffic Safety Administration (NHTSA)
- 3.4.1.2 Transport Canada Motor Vehicle Safety Standards (CMVSS)
- 3.4.2 Europe
- 3.4.2.1 European Whole Vehicle Type Approval (WVTA)
- 3.4.2.2 ECE Regulation 124 (R124)
- 3.4.3 Asia Pacific
- 3.4.3.1 Japan Automotive Standards Organization (JASO)
- 3.4.3.2 AIS (Automotive Industry Standards) - India
- 3.4.4 Latin America
- 3.4.4.1 Brazilian National Traffic Council (CONTRAN) - Resolution 242
- 3.4.4.2 Mexican NOM Standards (Normas Oficiales Mexicanas)
- 3.4.5 Middle East & Africa
- 3.4.5.1 Emirates Authority for Standardization and Metrology (ESMA)
- 3.4.5.2 South African Bureau of Standards (SABS)
- 3.4.1 North America
- 3.5 Porter's analysis
- 3.6 PESTEL analysis
- 3.7 Technology and innovation landscape
- 3.7.1 Current technological trends
- 3.7.2 Emerging technologies
- 3.8 Pricing analysis (Driven by Primary Research)
- 3.8.1 Historical price trend analysis
- 3.8.2 Pricing strategy by player type (premium / value / cost-plus)
- 3.9 Cost breakdown analysis
- 3.10 Patent analysis (Driven by Primary Research)
- 3.11 Sustainability and environmental aspects
- 3.11.1 Sustainable practices
- 3.11.2 Waste reduction strategies
- 3.11.3 Energy efficiency in production
- 3.11.4 Eco-friendly initiatives
- 3.11.5 Carbon footprint considerations
- 3.12 Impact of AI & Generative AI on the Market
- 3.12.1 AI-driven disruption of existing business models
- 3.12.2 Gen AI use cases & adoption roadmap by segment
- 3.12.3 Risks, limitations & regulatory considerations
- 3.13 Infrastructure & deployment landscape (Driven by primary research)
- 3.13.1 Deployment penetration by region & buyer segment
- 3.13.2 Scalability constraints & infrastructure investment trends
- 3.14 Forecast assumptions & scenario analysis (Driven by primary research)
- 3.14.1 Base Case - key macro & industry variables driving CAGR
- 3.14.2 Optimistic Scenarios - Favorable macro and industry tailwinds
- 3.14.3 Pessimistic Scenario - Macroeconomic slowdown or industry headwinds
Chapter 4 Competitive Landscape, 2025
- 4.1 Introduction
- 4.2 Company market share analysis
- 4.2.1 North America
- 4.2.2 Europe
- 4.2.3 Asia Pacific
- 4.2.4 LATAM
- 4.2.5 MEA
- 4.3 Competitive analysis of major market players
- 4.4 Competitive positioning matrix
- 4.5 Key developments
- 4.5.1 Mergers & acquisitions
- 4.5.2 Partnerships & collaborations
- 4.5.3 New product launches
- 4.5.4 Expansion plans and funding
- 4.6 Company tier benchmarking
- 4.6.1 Tier classification criteria & qualifying thresholds
- 4.6.2 Tier positioning matrix by revenue, geography & innovation
Chapter 5 Market Estimates & Forecast, By Component, 2022 - 2035 ($Mn)
- 5.1 Key trends
- 5.2 Software
- 5.2.1 Simulation & testing software
- 5.2.2 Sensor fusion & perception software
- 5.2.3 Machine learning & AI frameworks
- 5.2.4 Data management & annotation software
- 5.2.5 Mapping & localization software
- 5.2.6 Control & decision-making software
- 5.3 Services
- 5.3.1 Professional services
- 5.3.2 Managed services
Chapter 6 Market Estimates & Forecast, By Functionality, 2022 - 2035 ($Mn)
- 6.1 Key trends
- 6.2 Sensor simulation
- 6.3 Data collection & analysis
- 6.4 Simulation & testing
Chapter 7 Market Estimates & Forecast, By End Use, 2022 - 2035 ($Mn)
- 7.1 Key trends
- 7.2 Automotive manufacturers
- 7.3 Technology companies
- 7.4 Research institutions & universities
- 7.5 Government & defense
- 7.6 Others
Chapter 8 Market Estimates & Forecast, By Vehicle, 2022 - 2035 ($Mn)
- 8.1 Key trends
- 8.2 Passenger cars
- 8.2.1 Hatchback
- 8.2.2 SUV
- 8.2.3 Sedan
- 8.3 Commercial vehicle
- 8.3.1 LCV
- 8.3.2 MCV
- 8.3.3 HCV
Chapter 9 Market Estimates & Forecast, By Deployment Mode, 2022 - 2035 ($Mn)
- 9.1 Key trends
- 9.2 On-premises platforms
- 9.3 Cloud-based platforms
- 9.4 Hybrid deployment
Chapter 10 Market Estimates & Forecast, By Region, 2022 - 2035 ($Mn)
- 10.1 Key trends
- 10.2 North America
- 10.2.1 US
- 10.2.2 Canada
- 10.3 Europe
- 10.3.1 Germany
- 10.3.2 UK
- 10.3.3 France
- 10.3.4 Italy
- 10.3.5 Spain
- 10.3.6 Nordics
- 10.3.7 Russia
- 10.3.8 Poland
- 10.3.9 Romania
- 10.4 Asia Pacific
- 10.4.1 China
- 10.4.2 India
- 10.4.3 Japan
- 10.4.4 South Korea
- 10.4.5 ANZ
- 10.4.6 Vietnam
- 10.4.7 Indonesia
- 10.4.8 Philippines
- 10.5 Latin America
- 10.5.1 Brazil
- 10.5.2 Mexico
- 10.5.3 Argentina
- 10.6 MEA
- 10.6.1 South Africa
- 10.6.2 Saudi Arabia
- 10.6.3 UAE
Chapter 11 Company Profiles
- 11.1 Global companies
- 11.1.1 Baidu (Apollo)
- 11.1.2 GM
- 11.1.3 Mercedes-Benz
- 11.1.4 Microsoft
- 11.1.5 Mobileye (Intel)
- 11.1.6 NVIDIA
- 11.1.7 Qualcomm
- 11.1.8 Tesla
- 11.1.9 Toyota
- 11.1.10 Waymo (Alphabet)
- 11.2 Regional players
- 11.2.1 Ansys
- 11.2.2 Aurora Innovation
- 11.2.3 dSPACE
- 11.2.4 Momenta
- 11.2.5 Pony.ai
- 11.3 Emerging players
- 11.3.1 Applied Intuition
- 11.3.2 CARLA Simulator (Open-Source Community)
- 11.3.3 Cognata
- 11.3.4 Foretellix
- 11.3.5 Parallel Domain
- 11.3.6 Scale AI


