


 |
市場調查報告書
商品編碼
1982384
輪廓儀市場機會、成長要素、產業趨勢分析及 2026-2035 年預測。Profilometer Market Opportunity, Growth Drivers, Industry Trend Analysis, and Forecast 2026 - 2035 |
||||||
預計到 2025 年,全球輪廓儀市場價值將達到 5.579 億美元,年複合成長率為 5.9%,到 2035 年將達到 9.252 億美元。
輪廓儀是半導體製造、航太、汽車和醫療設備製造等需要精確表面測量的行業中必不可少的設備。這些設備能夠評估表面粗糙度、紋理和形狀等特性,確保產品符合嚴格的品質標準。隨著製造流程的日益複雜,對能夠進行極其精細測量的輪廓儀的需求持續成長。航太和醫療設備產業高度依賴這些測量儀器來維持組件性能、確保符合法規要求並確保結構完整性。此外,市場正從傳統的基於觸針的接觸式測量系統轉向先進的光學輪廓儀,後者能夠提供更快、無損的測量能力以及對複雜形狀的高精度分析。這種轉變是由精密產業對高解析度非接觸式測量解決方案日益成長的需求所驅動的。
| 市場範圍 | |
|---|---|
| 開始年份 | 2025 |
| 預測期 | 2026-2035 |
| 上市時的市場規模 | 5.579億美元 |
| 預測金額 | 9.252億美元 |
| 複合年成長率 | 5.9% |
預計到2025年,接觸式輪廓儀市場規模將達到3.934億美元,並在2026年至2035年間以6%的複合年成長率成長。接觸式輪廓儀因其可靠性、成本效益和精確的表面粗糙度測量能力而廣泛應用。其觸針式機構可在需要觸覺評估的工業環境中提供穩定的性能。汽車、重工業和金屬加工等產業持續採用接觸式系統進行常規表面表徵,並確保符合Ra、Rz和Rq等標準粗糙度參數的要求。
預計到2025年,光學輪廓儀市佔率將達到41.5%,並在2035年之前以6.3%的複合年成長率成長。雷射掃描、干涉測量和共焦等光學系統因其高速、高解析度和非破壞性測量能力而日益普及。這些設備非常適合精密、微型或複雜的零件,因為它們無需物理接觸即可快速測量3D表面幾何形狀。隨著半導體、醫療和先進電子製造業的擴張,對光學輪廓儀的需求正在加速成長,因為這些產業對精確的微納尺度檢測至關重要。
美國輪廓儀市場預計到2025年將達到1.316億美元,並在2035年之前以6.2%的複合年成長率成長。半導體製造、航太、生物醫學醫療設備和先進汽車工程等行業的強勁需求是推動市場成長的主要動力。美國先進的研發能力、奈米技術的投資以及工業4.0的普及,都促進了高階光學和非接觸式輪廓儀的廣泛應用。擴大半導體產業規模和回流策略也進一步推動了精密表面測量解決方案的需求。
目錄
第1章:調查方法和範圍
第2章執行摘要
第3章業界考察
- 生態系分析
- 供應商情況
- 利潤率
- 每個階段增加的價值
- 影響價值鏈的因素
- 影響產業的因素
- 促進因素
- 對高精度表面測量的需求日益成長
- 半導體和電子設備製造的擴張
- 非接觸式技術與3D光學技術的進步
- 陷阱與挑戰
- 設備成本高且整合複雜。
- 不同材料的操作限制
- 機會
- 可再生能源和電池製造領域的應用擴展
- 與自動化、機器人和在線連續測量技術的整合。
- 促進因素
- 成長潛力分析
- 未來市場趨勢
- 科技與創新趨勢
- 當前技術趨勢
- 新興技術
- 價格趨勢
- 按地區
- 依產品
- 監理情勢
- 北美洲
- 美國:消費品安全委員會(CPSC),聯邦法規(CFR)第16篇第1512節
- 加拿大:國際標準化組織(ISO)4210
- 歐洲
- 德國:德國標準化協會 (DIN)、歐洲標準 (EN)、ISO 4210
- 英國:歐洲標準 (EN) ISO 4210 /英國合格評定 (UKCA)
- 法國:歐洲標準 (EN) ISO 4210
- 亞太地區
- 中國:國家標誌(GB)3565
- 印度:印度標準 (IS) 10613
- 日本:日本工業標準(JIS)D 9110
- 拉丁美洲
- 巴西:巴西技術標準協會 (ABNT)、巴西標準局 (NBR)、ISO 4210
- 墨西哥:國際標準化組織(ISO)4210
- 中東和非洲
- 南非:南非國家標準 (SANS) 311
- 沙烏地阿拉伯:沙烏地阿拉伯標準、計量和品質組織 (SASO)、海灣標準化組織 (GSO)、ISO 4210
- 北美洲
- 貿易數據分析
- 進出口量及進口額趨勢
- 主要貿易走廊及關稅的影響
- 人工智慧和生成式人工智慧對市場的影響
- 利用人工智慧改造現有經營模式
- 針對特定領域的生成式人工智慧應用案例和實施藍圖
- 風險、限制和監管考量
- 波特的分析
- PESTEL 分析
第4章 競爭情勢
- 介紹
- 企業市佔率分析
- 按地區
- 北美洲
- 歐洲
- 亞太地區
- 拉丁美洲
- 中東和非洲
- 按地區
- 企業矩陣分析
- 主要市場公司的競爭分析
- 競爭定位矩陣
- 主要進展
- 併購
- 夥伴關係與合作
- 新產品發布
- 業務拓展計劃
第5章 市場估算與預測:依產品類型分類,2022-2035年
- 接觸剖面儀
- 非接觸式輪廓儀
第6章 市場估計與預測:依類型分類,2022-2035年
- 2D輪廓儀
- 3D輪廓儀
第7章 市場估計與預測:依技術分類,2022-2035年
- 光科技
- 觸控筆
- 雷射掃描
- 干擾法
第8章 市場估算與預測:依最終用途分類,2022-2035年
- 車
- 半導體
- 醫療保健
- 航太
- 電子學
- 製造業
第9章 市場估價與預測:依通路分類,2022-2035年
- 直銷
- 間接銷售
第10章 市場估價與預測:依地區分類,2022-2035年
- 北美洲
- 美國
- 加拿大
- 歐洲
- 德國
- 英國
- 法國
- 義大利
- 西班牙
- 亞太地區
- 中國
- 印度
- 日本
- 韓國
- 澳洲
- 拉丁美洲
- 巴西
- 墨西哥
- 阿根廷
- 中東和非洲(MEA)
- 沙烏地阿拉伯
- 阿拉伯聯合大公國
- 南非
第11章:公司簡介
- AMETEK, Inc.
- Bruker
- Carl Zeiss
- Evident Scientific
- Jenoptik Group
- Keyence Corporation
- KLA Corporation
- LS Starrett Company
- Mahr Inc.
- Mitutoyo America Corporation
- Nikon Instruments
- Sensofar
- Solarius, Inc.
- TOKYO SEIMITSU Co., Ltd.
- Zygo Corporation
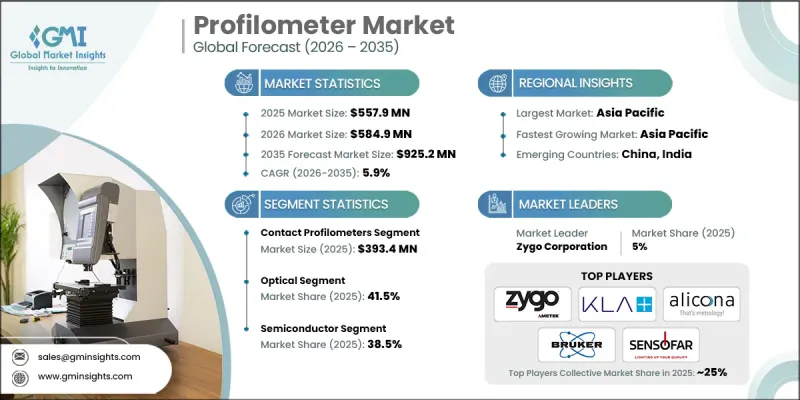
The Global Profilometer Market was valued at USD 557.9 million in 2025 and is estimated to grow at a CAGR of 5.9% to reach USD 925.2 million by 2035.
Profilometers are essential instruments for industries requiring precise surface measurements, including semiconductor fabrication, aerospace, automotive, and medical device manufacturing. These devices assess surface characteristics such as roughness, texture, and shape to ensure that products meet stringent quality standards. As manufacturing processes become more sophisticated, the demand for profilometers capable of providing highly detailed measurements continues to rise. Aerospace and medical device sectors rely heavily on these tools for maintaining component performance, regulatory compliance, and structural integrity. The market is also witnessing a shift from traditional stylus-based contact systems toward advanced optical profilometers, which provide faster, non-destructive measurements and can analyze complex geometries with high accuracy. This evolution is driven by the growing need for high-resolution, non-contact measurement solutions in precision-focused industries.
| Market Scope | |
|---|---|
| Start Year | 2025 |
| Forecast Year | 2026-2035 |
| Start Value | $557.9 Million |
| Forecast Value | $925.2 Million |
| CAGR | 5.9% |
The contact profilometers segment generated USD 393.4 million in 2025 and is expected to grow at a CAGR of 6% from 2026 to 2035. Contact profilometers remain widely used because of their reliability, cost-effectiveness, and precise surface roughness measurement capabilities. Their stylus-based mechanism performs consistently in industrial settings where tactile assessment is preferred. Industries such as automotive, heavy manufacturing, and metalworking continue to adopt contact systems for routine surface characterization and compliance with standard roughness parameters like Ra, Rz, and Rq.
The optical profilometers segment held a 41.5% share in 2025 and is anticipated to grow at a CAGR of 6.3% through 2035. Optical systems, including laser scanning, interferometry, and confocal solutions, are increasingly popular due to their high-speed, high-resolution, and non-destructive capabilities. These devices can capture 3D surface topography rapidly without physical contact, making them ideal for delicate, miniaturized, or complex components. Demand for optical profilometers is accelerating with the expansion of semiconductor, medical, and advanced electronics manufacturing, where precise micro- and nano-scale inspections are critical.
U.S. Profilometer Market reached USD 131.6 million in 2025 and is projected to grow at a CAGR of 6.2% through 2035. Strong demand from semiconductor manufacturing, aerospace, biomedical devices, and advanced automotive engineering drives market growth. The nation's advanced R&D capabilities, investments in nanotechnology, and Industry 4.0 adoption support the widespread integration of high-end optical and non-contact profilometers. Semiconductor expansion initiatives and reshoring strategies further fuel demand for precise surface metrology solutions.
Key players in the Global Profilometer Market include AMETEK, Inc., Bruker, Carl Zeiss, Evident Scientific, Jenoptik Group, Keyence Corporation, KLA Corporation, L.S. Starrett Company, Mahr Inc., Mitutoyo America Corporation, Nikon Instruments, Sensofar, Solarius, Inc., Tokyo Seimitsu Co., Ltd., and Zygo Corporation. Companies in the Global Profilometer Market are reinforcing their position by focusing on technological innovation, expanding optical and non-contact product lines, and entering new industrial segments. They invest in R&D to enhance measurement accuracy, speed, and automation capabilities while ensuring compatibility with Industry 4.0 systems. Strategic collaborations with semiconductor, aerospace, and medical device manufacturers enable co-development of tailored solutions. Companies leverage digital marketing, trade shows, and specialized training programs to boost brand visibility and technical credibility. Expanding service networks and offering calibration, maintenance, and support services further strengthen customer loyalty. Additionally, players are exploring emerging markets, improving product affordability, and highlighting sustainable and efficient solutions to differentiate their offerings and capture greater market share.
Table of Contents
Chapter 1 Methodology & Scope
- 1.1 Market scope & definitions
- 1.2 Research design
- 1.2.1 Research approach
- 1.2.2 Data collection methods
- 1.3 Base estimates and calculations
- 1.3.1 Base year calculation
- 1.3.2 Market estimates & forecasts parameters
- 1.4 Forecast Model
- 1.4.1 Key trends for market estimates
- 1.4.2 Quantified market impact analysis
- 1.4.2.1 Mathematical impact of growth parameters on forecast
- 1.4.3 Scenario analysis framework
- 1.5 Primary research and validation
- 1.5.1 Some of the primary sources (but not limited to)
- 1.6 Data mining sources
- 1.6.1 Paid Sources
- 1.7 Primary research and validation
- 1.7.1 Primary sources
- 1.8 Research Trail & confidence scoring
- 1.8.1 Research trail components
- 1.8.2 Scoring components
- 1.9 Research transparency addendum
- 1.9.1 Source attribution framework
- 1.9.2 Quality assurance metrics
- 1.9.3 Our commitment to trust
- 1.10 Market Definitions
Chapter 2 Executive Summary
- 2.1 Industry 360° synopsis
- 2.2 Key market trends
- 2.2.1 Regional
- 2.2.2 Product type
- 2.2.3 Type
- 2.2.4 Technology
- 2.2.5 End Use
- 2.2.6 Distribution channel
- 2.3 CXO perspectives: Strategic imperatives
- 2.3.1 Key decision points for industry executives
- 2.3.2 Critical success factors for market players
- 2.4 Future outlook and strategic recommendations
Chapter 3 Industry Insights
- 3.1 Industry ecosystem analysis
- 3.1.1 Supplier landscape
- 3.1.2 Profit margin
- 3.1.3 Value addition at each stage
- 3.1.4 Factor affecting the value chain
- 3.2 Industry impact forces
- 3.2.1 Growth drivers
- 3.2.1.1 Rising demand for high-precision surface measurement
- 3.2.1.2 Expansion of semiconductor & electronics manufacturing
- 3.2.1.3 Advancements in non-contact & 3d optical technologies
- 3.2.2 Pitfalls & Challenges
- 3.2.2.1 High equipment cost & integration complexity
- 3.2.2.2 Operational limitations across varied materials
- 3.2.3 Opportunities
- 3.2.3.1 Growing adoption in renewable energy & battery manufacturing
- 3.2.3.2 Integration with automation, robotics & inline metrology
- 3.2.1 Growth drivers
- 3.3 Growth potential analysis
- 3.4 Future market trends
- 3.5 Technology and innovation landscape
- 3.5.1 Current technological trends
- 3.5.2 Emerging technologies
- 3.6 Price trends
- 3.6.1 By region
- 3.6.2 By product
- 3.7 Regulatory landscape
- 3.7.1 North America
- 3.7.1.1 US: Consumer Product Safety Commission (CPSC) 16 Code of Federal Regulations (CFR) part 1512
- 3.7.1.2 Canada: International Organization for Standardization (ISO) 4210
- 3.7.2 Europe
- 3.7.2.1 Germany: Deutsches Institut fur Normung (DIN) European Norm (EN) ISO 4210
- 3.7.2.2 UK: European Norm (EN) ISO 4210 / United Kingdom Conformity Assessed (UKCA)
- 3.7.2.3 France: European Norm (EN) ISO 4210
- 3.7.3 Asia Pacific
- 3.7.3.1 China: Guobiao (GB) 3565
- 3.7.3.2 India: Indian Standard (IS) 10613
- 3.7.3.3 Japan: Japanese Industrial Standard (JIS) D 9110
- 3.7.4 Latin America
- 3.7.4.1 Brazil: Associacao Brasileira de Normas Tecnicas (ABNT) Norma Brasileira (NBR) ISO 4210
- 3.7.4.2 Mexico: International Organization for Standardization (ISO) 4210
- 3.7.5 Middle East & Africa
- 3.7.5.1 South Africa: South African National Standard (SANS) 311
- 3.7.5.2 Saudi Arabia: Saudi Standards, Metrology and Quality Organization (SASO) Gulf Standardization Organization (GSO) ISO 4210
- 3.7.1 North America
- 3.8 Trade data analysis
- 3.8.1 Import/export volume & value trends
- 3.8.2 Key trade corridors & tariff impact
- 3.9 Impact of AI & generative AI on the market
- 3.9.1 AI-driven disruption of existing business models
- 3.9.2 GenAI use cases & adoption roadmap by segment
- 3.9.3 Risks, limitations & regulatory considerations
- 3.10 Porter’s analysis
- 3.11 PESTEL analysis
Chapter 4 Competitive Landscape, 2025
- 4.1 Introduction
- 4.2 Company market share analysis
- 4.2.1 By Region
- 4.2.1.1 North America
- 4.2.1.2 Europe
- 4.2.1.3 Asia Pacific
- 4.2.1.4 Latin America
- 4.2.1.5 Middle East & Africa
- 4.2.1 By Region
- 4.3 Company matrix analysis
- 4.4 Competitive analysis of major market players
- 4.5 Competitive positioning matrix
- 4.6 Key developments
- 4.6.1 Mergers & acquisitions
- 4.6.2 Partnerships & collaborations
- 4.6.3 New product launches
- 4.6.4 Expansion plans
Chapter 5 Market Estimates & Forecast, By Product Type, 2022 - 2035, (USD Million) (Thousand Units)
- 5.1 Key trends
- 5.2 Contact profilometers
- 5.3 Non-contact profilometers
Chapter 6 Market Estimates & Forecast, By Type, 2022 - 2035, (USD Million) (Thousand Units)
- 6.1 Key trends
- 6.2 2D Profilometers
- 6.3 3D Profilometers
Chapter 7 Market Estimates & Forecast, By Technology, 2022 - 2035, (USD Million) (Thousand Units)
- 7.1 Key trends
- 7.2 Optical
- 7.3 Stylus
- 7.4 Laser scan
- 7.5 Interferometry
Chapter 8 Market Estimates & Forecast, By End Use, 2022 - 2035, (USD Million) (Thousand Units)
- 8.1 Key trends
- 8.2 Automotive
- 8.3 Semiconductor
- 8.4 Medical/healthcare
- 8.5 Aerospace
- 8.6 Electronics
- 8.7 Manufacturing
Chapter 9 Market Estimates & Forecast, By Distribution Channel, 2022 - 2035, (USD Million) (Thousand Units)
- 9.1 Key trends
- 9.2 Direct
- 9.3 Indirect
Chapter 10 Market Estimates & Forecast, By Region, 2022 - 2035, (USD Million) (Thousand Units)
- 10.1 Key trends
- 10.2 North America
- 10.2.1 U.S.
- 10.2.2 Canada
- 10.3 Europe
- 10.3.1 Germany
- 10.3.2 UK
- 10.3.3 France
- 10.3.4 Italy
- 10.3.5 Spain
- 10.4 Asia Pacific
- 10.4.1 China
- 10.4.2 India
- 10.4.3 Japan
- 10.4.4 South Korea
- 10.4.5 Australia
- 10.5 Latin America
- 10.5.1 Brazil
- 10.5.2 Mexico
- 10.5.3 Argentina
- 10.6 MEA
- 10.6.1 Saudi Arabia
- 10.6.2 UAE
- 10.6.3 South Africa
Chapter 11 Company Profiles
- 11.1 AMETEK, Inc.
- 11.2 Bruker
- 11.3 Carl Zeiss
- 11.4 Evident Scientific
- 11.5 Jenoptik Group
- 11.6 Keyence Corporation
- 11.7 KLA Corporation
- 11.8 L.S. Starrett Company
- 11.9 Mahr Inc.
- 11.10 Mitutoyo America Corporation
- 11.11 Nikon Instruments
- 11.12 Sensofar
- 11.13 Solarius, Inc.
- 11.14 TOKYO SEIMITSU Co., Ltd.
- 11.15 Zygo Corporation
