


 |
市場調查報告書
商品編碼
1982363
駁船運輸市場商機、成長機會、產業趨勢分析及2026-2035年預測Barge Transportation Market Opportunity, Growth Drivers, Industry Trend Analysis, and Forecast 2026 - 2035 |
||||||
2025年全球駁船運輸市場價值為1,377億美元,預計到2035年將以3.7%的複合年成長率成長至1,988億美元。
在全球貿易量不斷成長以及對高效、安全且環境永續的貨運需求日益成長的推動下,內河航運市場正在擴張。北美、歐洲和亞太地區的監管獎勵、永續性義務以及政府政策,都在積極推動低排放運輸,這促使船隊所有者、物流運營商和駁船運營商採用先進的船隊管理、預測性維護和運營最佳化解決方案。為了最大限度地提高船舶運轉率、提升燃油效率並滿足嚴格的安全和環保標準,各方加大了對引擎診斷、船體維護、輔助系統檢查、自主導航和排放氣體控制技術的投資。船隊現代化、內河航道走廊的擴建以及貨櫃和散貨駁船的引入,進一步加速了高效、數據驅動型解決方案的普及,而物聯網賦能的監控、遠端資訊處理和整合性能平台正在變革傳統的駁船運營模式。
| 市場範圍 | |
|---|---|
| 開始年份 | 2025 |
| 預測期 | 2026-2035 |
| 上市時的市場規模 | 1377億美元 |
| 預測金額 | 1988億美元 |
| 複合年成長率 | 3.7% |
液體貨物運輸佔45%的市場佔有率,預計到2035年將以2.9%的複合年成長率成長。液體貨物運輸之所以佔據市場主導地位,是因為透過內河航道和沿海駁船航線運輸石油、化學品和其他散裝液體對全球貿易、能源供應和工業活動仍然至關重要。高商業性價值、穩定的需求以及嚴格的監管要求,確保了航運公司和物流營運商持續使用駁船船隊。
預計到2025年,沿海內河航運將佔據60%的市場佔有率,並在2035年之前以2.7%的複合年成長率成長。沿海航道支援港口、工業中心和商業樞紐之間大量貨物的運輸,包括散裝液體、石油產品、化學品和貨櫃貨物。營運商正在推進船舶營運、安全通訊協定和貨物裝卸的標準化,以確保這些航道上可靠、高效且規範的運輸。
美國駁船運輸市場佔83%的佔有率,預計2025年市場規模將達383億美元。該地區受益於成熟的內河航道網路、龐大的船隊運營和先進的港口基礎設施。完善的河流系統、船隊管理以及預測性維護技術的應用,正在鞏固北美在安全、高運量駁船運輸領域的領先地位。
目錄
第1章:調查方法和範圍
第2章執行摘要
第3章業界考察
- 生態系分析
- 供應商情況
- 利潤率
- 成本結構
- 每個階段增加的價值
- 影響價值鏈的因素
- 中斷
- 影響產業的因素
- 促進因素
- 內河航運需求日益成長
- 車輛現代化數位化
- 永續交通的監管支持
- 貿易走廊的擴張
- 產業潛在風險與挑戰
- 高昂的營運和維護成本
- 基礎設施限制
- 市場機遇
- 綠色和混合動力推進技術
- 預測性維護和人工智慧驅動的車輛管理
- 多式聯運和貨櫃運輸
- 進階預測性維護服務
- 促進因素
- 成長潛力分析
- 監理情勢
- 北美洲
- 美國:環保署、美國海岸警衛隊、《清潔水法》、國家運輸安全委員會
- 加拿大:加拿大運輸部,CMVSS 305
- 歐洲
- 德國:BMDV,歐洲 6/7
- 法國:運輸部,6/7歐元
- 英國:運輸部,Euro 6/7
- 義大利:基礎設施和運輸部
- 亞太地區
- 中國:工信部、中國 6/7 標準
- 日本:國土交通省,JIS排放氣體法規
- 韓國:國土交通部(MOLIT)、韓國(KS)排放標準
- 印度:MoRTH,BS6標準
- 拉丁美洲
- 巴西:DENATRAN、CONAMA 標準
- 墨西哥:通訊運輸運輸部發布NOM排放氣體法規
- 中東和非洲
- 阿拉伯聯合大公國:RTA、ESMA排放法規
- 沙烏地阿拉伯:運輸部製定SASO排放標準
- 北美洲
- 波特的分析
- PESTEL 分析
- 科技與創新趨勢
- 當前技術趨勢
- 新興技術
- 價格趨勢
- 按地區
- 依產品
- 成本細分分析
- 專利分析
- 永續性和環境方面
- 永續計劃
- 減少廢棄物策略
- 生產中的能源效率
- 環保意識的舉措
- 關於碳足跡的考量
- 使用案例場景
- 內河航道基礎設施與運輸能力評估
- 多式聯運和模式轉換趨勢
- 車輛年齡結構與更換週期分析
第4章 競爭情勢
- 介紹
- 企業市佔率分析
- 北美洲
- 歐洲
- 亞太地區
- 拉丁美洲
- 中東和非洲
- 主要市場公司的競爭分析
- 競爭定位矩陣
- 戰略展望矩陣
- 主要進展
- 併購
- 夥伴關係與合作
- 新產品發布
- 業務拓展計劃及資金籌措
第5章 市場估價與預測:依貨物類型分類,2022-2035年
- 液體貨物
- 氣態貨物
- 乾貨
第6章 市場估算與預測:依駁船船隊分類,2022-2035年
- 目標駁船
- 目前正在服役的駁船
- 油輪駁船
第7章 市場估算與預測:依駁船運輸活動分類,2022-2035年
- 沿海和內陸運輸
- 內河航運
第8章 市場規模估算與預測(2022-2035年)
- 140英尺至180英尺
- 195至250英尺
- 260至300英尺
- 超過300英尺
第9章 市場估計與預測:依應用領域分類,2022-2035年
- 煤炭
- 原油和石油產品
- 液態化學品
- 食品漿和其他液體
- 農產品
- 金屬礦石和金屬製品
- 製藥
- 乾粉和氣態化學品
- 液化石油氣、壓縮天然氣和其他氣體產品
- 電子設備和數位設備
- 其他
第10章 市場估價與預測:依地區分類,2022-2035年
- 北美洲
- 美國
- 加拿大
- 歐洲
- 英國
- 德國
- 法國
- 義大利
- 西班牙
- 比利時
- 荷蘭
- 瑞典
- 亞太地區
- 中國
- 印度
- 日本
- 澳洲
- 新加坡
- 韓國
- 越南
- 印尼
- 拉丁美洲
- 巴西
- 墨西哥
- 阿根廷
- 中東和非洲(MEA)
- 阿拉伯聯合大公國
- 南非
- 沙烏地阿拉伯
第11章:公司簡介
- Global Player
- American Commercial Barge Line
- Cargill Marine &Terminal
- CMA CGM
- Contargo
- Ingram Barge
- Kirby
- Marquette Transportation
- McAllister Towing &Transportation
- Rhenus
- SEACOR
- Regional Player
- HGK Shipping
- Danser
- Argosy International
- Blessey Marine Services
- Ergon
- Haeger and Schmidt Logistics
- Heartland Barge Management
- Livingston International
- Maritime
- Waalhaven
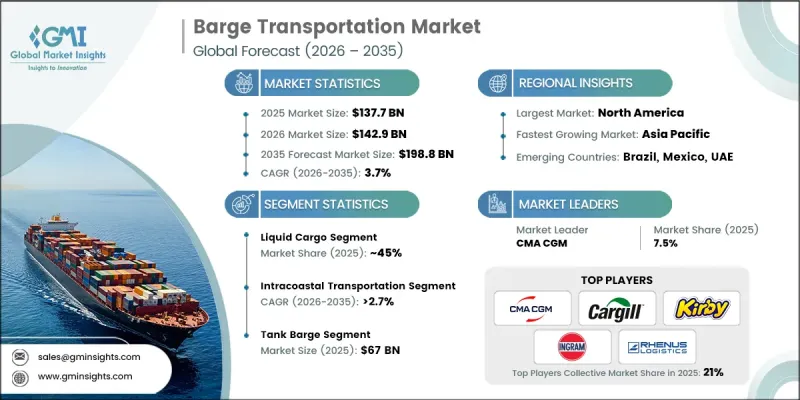
The Global Barge Transportation Market was valued at USD 137.7 billion in 2025 and is estimated to grow at a CAGR of 3.7% to reach USD 198.8 billion by 2035.
The market is expanding as demand for inland waterway transport rises alongside global trade volumes and the need for efficient, safe, and environmentally sustainable cargo movement. Regulatory incentives promoting low-emission transport, sustainability mandates, and government policies in North America, Europe, and Asia Pacific are encouraging fleet owners, logistics providers, and barge operators to adopt advanced fleet management, predictive maintenance, and operational optimization solutions. Pressure to maximize vessel uptime, improve fuel efficiency, and meet strict safety and environmental standards is driving investment in engine diagnostics, hull maintenance, auxiliary system checks, automated navigation, and emission control technologies. Fleet modernization, expansion of inland shipping corridors, and adoption of containerized and bulk cargo barges further support the uptake of high-efficiency, data-driven solutions, while IoT-enabled monitoring, telematics, and integrated performance platforms are transforming traditional barge operations.
| Market Scope | |
|---|---|
| Start Year | 2025 |
| Forecast Year | 2026-2035 |
| Start Value | $137.7 Billion |
| Forecast Value | $198.8 Billion |
| CAGR | 3.7% |
The liquid cargo segment held a 45% share and is expected to grow at a CAGR of 2.9% through 2035. Liquid cargo dominates because transporting petroleum, chemicals, and other bulk liquids via inland waterways and coastal barge routes remains critical for global trade, energy supply, and industrial activities. The high commercial value, steady demand, and strict regulatory handling requirements ensure that barge fleets are consistently utilized by shipping companies and logistics providers.
The intracoastal transportation segment accounted for 60% share in 2025 and is projected to grow at a CAGR of 2.7% through 2035. Intracoastal routes support high-volume cargo movement between ports, industrial hubs, and commercial centers, handling bulk liquids, petroleum products, chemicals, and containerized goods. Operators are standardizing vessel operations, safety protocols, and cargo handling to ensure reliable, efficient, and compliant transport along these corridors.
US Barge Transportation Market held an 83% share, generating USD 38.3 billion in 2025. The region benefits from a mature inland waterway network, extensive fleet operations, and advanced port infrastructure. Well-developed river systems, fleet management adoption, and predictive maintenance technologies strengthen North America's leadership in safe, high-capacity barge transportation.
Key players operating in the Global Barge Transportation Market include Kirby Corporation, Cargill Marine & Terminal, American Commercial Barge Line, Marquette Transportation, McAllister Towing & Transportation, CMA CGM Group, Contargo, SEACOR, Rhenus Group, and Ingram Barge Company. Companies in the barge transportation market are employing multiple strategies to enhance their presence and strengthen their market foothold. Operators are investing in fleet modernization and adopting predictive maintenance solutions to maximize uptime and minimize operational costs. Integration of IoT, telematics, and automated navigation systems improves fuel efficiency, route optimization, and cargo monitoring. Strategic partnerships with logistics providers, port authorities, and industrial clients help expand route coverage and operational reach. Firms are focusing on specialized vessels for liquid and bulk cargo, compliance with safety and environmental regulations, and sustainability initiatives to gain a competitive edge.
Table of Contents
Chapter 1 Methodology & Scope
- 1.1 Market scope and definition
- 1.2 Research design
- 1.2.1 Research approach
- 1.2.2 Data collection methods
- 1.3 Data mining sources
- 1.3.1 Global
- 1.3.2 Regional/Country
- 1.4 Base estimates and calculations
- 1.4.1 Base year calculation
- 1.4.2 Key trends for market estimation
- 1.5 Primary research and validation
- 1.5.1 Primary sources
- 1.6 Forecast
- 1.7 Research assumptions and limitations
Chapter 2 Executive Summary
- 2.1 Industry 360° synopsis, 2022 - 2035
- 2.2 Key market trends
- 2.2.1 Regional
- 2.2.2 Cargo
- 2.2.3 Barge Fleet
- 2.2.4 Barging Activity
- 2.2.5 Size
- 2.2.6 Application
- 2.3 TAM Analysis, 2026-2035
- 2.4 CXO perspectives: Strategic imperatives
- 2.4.1 Executive decision points
- 2.4.2 Critical success factors
- 2.5 Future outlook and strategic recommendations
Chapter 3 Industry Insights
- 3.1 Industry ecosystem analysis
- 3.1.1 Supplier Landscape
- 3.1.2 Profit Margin
- 3.1.3 Cost structure
- 3.1.4 Value addition at each stage
- 3.1.5 Factor affecting the value chain
- 3.1.6 Disruptions
- 3.2 Industry impact forces
- 3.2.1 Growth drivers
- 3.2.1.1 Rising demand for inland waterway transport
- 3.2.1.2 Fleet modernization and digitalization
- 3.2.1.3 Regulatory support for sustainable transport
- 3.2.1.4 Expansion of trade corridors
- 3.2.2 Industry pitfalls and challenges
- 3.2.2.1 High operational and maintenance costs
- 3.2.2.2 Infrastructure limitations
- 3.2.3 Market opportunities
- 3.2.3.1 Green and hybrid propulsion technologies
- 3.2.3.2 Predictive maintenance and AI-driven fleet management
- 3.2.3.3 Intermodal & containerized transport
- 3.2.3.4 Advanced predictive maintenance services
- 3.2.1 Growth drivers
- 3.3 Growth potential analysis
- 3.4 Regulatory landscape
- 3.4.1 North America
- 3.4.1.1 U.S.: EPA, U.S. Coast Guard, Clean Water Act, NTSB
- 3.4.1.2 Canada: Transport Canada, CMVSS 305
- 3.4.2 Europe
- 3.4.2.1 Germany: BMDV, Euro 6/7
- 3.4.2.2 France: Ministry of Transport, Euro 6/7
- 3.4.2.3 UK: Department for Transport, Euro 6/7
- 3.4.2.4 Italy: Ministry of Infrastructure & Transport
- 3.4.3 Asia Pacific
- 3.4.3.1 China: MIIT, China 6/7 Standards
- 3.4.3.2 Japan: MLIT, JIS Emission Regulations
- 3.4.3.3 South Korea: MOLIT, KS Emission Standards
- 3.4.3.4 India: MoRTH, BS6 Norms
- 3.4.4 Latin America
- 3.4.4.1 Brazil: DENATRAN, CONAMA Standards
- 3.4.4.2 Mexico: Ministry of Communications & Transport, NOM Emission Regulations
- 3.4.5 Middle East and Africa
- 3.4.5.1 UAE: RTA, ESMA Emission Regulations
- 3.4.5.2 Saudi Arabia: Ministry of Transport, SASO Emission Standards
- 3.4.1 North America
- 3.5 Porter’s analysis
- 3.6 PESTEL analysis
- 3.7 Technology and Innovation Landscape
- 3.7.1 Current technological trends
- 3.7.2 Emerging technologies
- 3.8 Price trends
- 3.8.1 By region
- 3.8.2 By product
- 3.9 Cost breakdown analysis
- 3.10 Patent analysis
- 3.11 Sustainability and Environmental Aspects
- 3.11.1 Sustainable practices
- 3.11.2 Waste reduction strategies
- 3.11.3 Energy efficiency in production
- 3.11.4 Eco-friendly initiatives
- 3.11.5 Carbon footprint considerations
- 3.12 Use case scenarios
- 3.13 Inland Waterway Infrastructure & Capacity Assessment
- 3.14 Intermodal Connectivity & Modal Shift Dynamics
- 3.15 Fleet Age Profile & Replacement Cycle Analysis
Chapter 4 Competitive Landscape, 2025
- 4.1 Introduction
- 4.2 Company market share analysis
- 4.2.1 North America
- 4.2.2 Europe
- 4.2.3 Asia Pacific
- 4.2.4 Latin America
- 4.2.5 Middle East & Africa
- 4.3 Competitive analysis of major market players
- 4.4 Competitive positioning matrix
- 4.5 Strategic outlook matrix
- 4.6 Key developments
- 4.6.1 Mergers & acquisitions
- 4.6.2 Partnerships & collaborations
- 4.6.3 New product launches
- 4.6.4 Expansion plans and funding
Chapter 5 Market Estimates & Forecast, By Cargo, 2022 - 2035 ($Bn, Million tons)
- 5.1 Key trends
- 5.2 Liquid Cargo
- 5.3 Gaseous Cargo
- 5.4 Dry Cargo
Chapter 6 Market Estimates & Forecast, By Barge Fleet, 2022 - 2035 ($Bn, Million tons)
- 6.1 Key trends
- 6.2 Covered Barge
- 6.3 Opened Barge
- 6.4 Tank Barge
Chapter 7 Market Estimates & Forecast, By Barging Activity, 2022 - 2035 ($Bn, Million tons)
- 7.1 Key trends
- 7.2 Intracoastal Transportation
- 7.3 Inland Water Transport
Chapter 8 Market Estimates & Forecast, By Size, 2022 - 2035 ($Bn, Million tons)
- 8.1 Key trends
- 8.2 140ft to 180ft
- 8.3 195ft to 250ft
- 8.4 260ft to 300ft
- 8.5 300ft and above
Chapter 9 Market Estimates & Forecast, By Application , 2022 - 2035 ($Bn, Million tons)
- 9.1 Key trends
- 9.2 Coal
- 9.3 Crude & Petroleum Products
- 9.4 Liquid Chemicals
- 9.5 Food Pulp & Other Liquid
- 9.6 Agricultural Products
- 9.7 Metal Ores and Fabricated Metal Products
- 9.8 Pharmaceuticals
- 9.9 Dry & Gaseous Chemicals
- 9.10 LPG, CNG, and Other Gaseous Products
- 9.11 Electronics & Digital Equipment
- 9.12 Others
Chapter 10 Market Estimates & Forecast, By Region, 2022 - 2035 ($Bn, Million tons)
- 10.1 Key trends
- 10.2 North America
- 10.2.1 US
- 10.2.2 Canada
- 10.3 Europe
- 10.3.1 UK
- 10.3.2 Germany
- 10.3.3 France
- 10.3.4 Italy
- 10.3.5 Spain
- 10.3.6 Belgium
- 10.3.7 Netherlands
- 10.3.8 Sweden
- 10.4 Asia Pacific
- 10.4.1 China
- 10.4.2 India
- 10.4.3 Japan
- 10.4.4 Australia
- 10.4.5 Singapore
- 10.4.6 South Korea
- 10.4.7 Vietnam
- 10.4.8 Indonesia
- 10.5 Latin America
- 10.5.1 Brazil
- 10.5.2 Mexico
- 10.5.3 Argentina
- 10.6 MEA
- 10.6.1 UAE
- 10.6.2 South Africa
- 10.6.3 Saudi Arabia
Chapter 11 Company Profiles
- 11.1 Global Player
- 11.1.1 American Commercial Barge Line
- 11.1.2 Cargill Marine & Terminal
- 11.1.3 CMA CGM
- 11.1.4 Contargo
- 11.1.5 Ingram Barge
- 11.1.6 Kirby
- 11.1.7 Marquette Transportation
- 11.1.8 McAllister Towing & Transportation
- 11.1.9 Rhenus
- 11.1.10 SEACOR
- 11.2 Regional Player
- 11.2.1 HGK Shipping
- 11.2.2 Danser
- 11.2.3 Argosy International
- 11.2.4 Blessey Marine Services
- 11.2.5 Ergon
- 11.2.6 Haeger and Schmidt Logistics
- 11.2.7 Heartland Barge Management
- 11.2.8 Livingston International
- 11.2.9 Maritime
- 11.2.10 Waalhaven


