


 |
市場調查報告書
商品編碼
1982347
臭氧產生器市場:商業機會、成長要素、產業趨勢分析及2026-2035年預測Ozone Generator Market Opportunity, Growth Drivers, Industry Trend Analysis, and Forecast 2026 - 2035 |
||||||
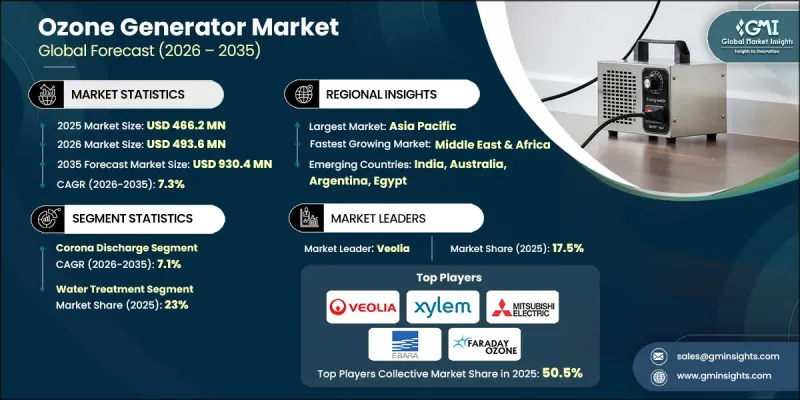
預計到 2025 年,全球臭氧產生器市場價值將達到 4.662 億美元,年複合成長率為 7.3%,到 2035 年將達到 9.304 億美元。
工業廢棄物排放的不斷增加和污染的日益嚴重導致全球空氣和水質惡化,從而增加了對臭氧發生器等先進處理技術的需求。臭氧發生器利用電暈放電和紫外線照射等方法將氧氣轉化為臭氧氣體。臭氧是一種強氧化劑和消毒劑,廣泛應用於水和廢水處理、空氣淨化、除臭和工業生產過程。為因應主要地區日益嚴重的都市區污染,世界各國政府正在實施旨在改善空氣和水質的政策,這提振了市場前景。各國優先發展永續工業的國家策略,加上監管支援、技術進步和貿易便利化進程,進一步加速了臭氧處理系統在全球的應用。
| 市場範圍 | |
|---|---|
| 開始年份 | 2025 |
| 預測期 | 2026-2035 |
| 上市時的市場規模 | 4.662億美元 |
| 預測金額 | 9.304億美元 |
| 複合年成長率 | 7.3% |
預計到2025年,電暈放電技術將佔據43.3%的市場佔有率,並在2035年之前以7.1%的複合年成長率成長。其高功率、高能源效率的設計使其能夠持續產生高濃度臭氧,因此非常適合大規模水處理廠、工業污水處理設施以及需要可靠且擴充性性能的應用。為了滿足客戶需求並推動市場成長,各公司正擴大將這項技術整合到其產品中。
預計到2025年,水處理市佔率將達到23%,並在2026年至2035年間以8%的複合年成長率成長。飲用水淨化、污水回用和水處理基礎設施投資的增加正在推動該領域的應用。臭氧系統因其高效的殺菌、去除有機雜質以及無化學殘留的特性而備受青睞。政府法規和機構為執行更嚴格的水質標準所做的努力,正在加速向先進的臭氧水處理解決方案的轉變。
預計到2025年,美國臭氧產生器市佔率將達到90.6%,到2035年市場規模將達到1.77億美元。聯邦和州政府對水質淨化、污水回用和環保計劃的資助推動了臭氧產生器的普及應用。公共產業越來越依賴無化學消毒技術,以符合更嚴格的水質法規和永續性目標。主要企業的加入以及與新興企業的策略合作進一步鞏固了美國市場的領先地位。
目錄
第1章:調查方法和範圍
第2章執行摘要
第3章業界考察
- 產業生態系統
- 原物料供應及採購分析
- 生產能力評估
- 供應鏈韌性與風險因素
- 配電網路分析
- 監理情勢
- 影響產業的因素
- 促進因素
- 產業潛在風險與挑戰
- 成長潛力分析
- 波特的分析
- 供應商的議價能力
- 買方的議價能力
- 新進入者的威脅
- 替代品的威脅
- PESTEL 分析
- 成本結構分析
- 價格趨勢分析(美元/單位)
- 透過技術
- 投資分析及未來展望
- 水處理的去中心化
- 數位化和物聯網整合
- 能源效率創新
- 技術創新趨勢
- 電暈放電技術的進步
- 電解臭氧發生技術的創新
- 紫外線發生技術的進步
- 冷等離子技術的發展
第4章 競爭情勢
- 介紹
- 企業市佔率分析:按地區分類
- 北美洲
- 歐洲
- 亞太地區
- 拉丁美洲
- 中東和非洲
- 戰略儀錶板
- 策略舉措
- 企業標竿管理
- 創新與科技趨勢
第5章 市場規模及預測:依技術分類,2022-2035年
- 紫外線
- 低溫等離子體
- 冠狀病毒出院
- 電解
第6章 市場規模與預測:依應用領域分類,2022-2035年
- 水處理
- 水處理
- 工業製程水處理
- 其他
- 實驗室和醫療設備
- 空氣處理
- 其他
第7章 市場規模及預測:依最終用途分類,2022-2035年
- 商業的
- 地方政府
- 工業的
- 車
- 食品/飲料
- 纖維
- 製藥
- 其他
第8章 市場規模及預測:依產能分類,2022-2035年
- 5克/小時或以上
- 5 g/h~100 g/h
- 100 g/h~1 kg/h
- 1 kg/h-5 kg/h
- 超過 5 公斤/小時
第9章 市場規模及預測:依地區分類,2022-2035年
- 北美洲
- 美國
- 加拿大
- 歐洲
- 德國
- 英國
- 法國
- 俄羅斯
- 義大利
- 西班牙
- 亞太地區
- 中國
- 澳洲
- 印度
- 日本
- 中東和非洲
- 沙烏地阿拉伯
- 阿拉伯聯合大公國
- 埃及
- 拉丁美洲
- 巴西
- 阿根廷
第10章:公司簡介
- Aeolus Sustainable Bio Energy Pvt Ltd
- Aurozone
- Chemtronics
- EBARA Technologies
- Eltech Ozone Pvt. Ltd.
- Faraday Ozone
- Prolux
- Guangzhou Quanju Ozone Technology Co., Ltd.
- Minnuo Gas Equipment Co., Ltd
- Mitsubishi Electric
- OTSIL
- Oxyzone International
- OZ-AIR Malaysia
- Ozonetek
- Pacific Water Technology
- Primozone
- Salher
- Veolia
- Toshiba
- Xylem Water
The Global Ozone Generator Market was valued at USD 466.2 million in 2025 and is estimated to grow at a CAGR of 7.3% to reach USD 930.4 million by 2035.
Rising industrial waste discharge and escalating pollution are increasingly affecting global air and water quality, driving the demand for advanced treatment technologies such as ozone generators. Ozone generators produce ozone gas by converting oxygen through methods like electrical corona discharge or ultraviolet radiation. This ozone acts as a powerful oxidant and disinfectant, widely utilized in water and wastewater treatment, air purification, odor elimination, and industrial processes. Growing urban pollution in major regions has prompted governments to implement policies aimed at improving air and water quality, boosting the market outlook. National strategies prioritizing sustainable industrial growth, coupled with regulatory support, technological advancements, and improved trade facilitation, are further enhancing the adoption of ozone-based treatment systems worldwide.
| Market Scope | |
|---|---|
| Start Year | 2025 |
| Forecast Year | 2026-2035 |
| Start Value | $466.2 Million |
| Forecast Value | $930.4 Million |
| CAGR | 7.3% |
The corona discharge technology segment held a 43.3% share in 2025 and is expected to grow at a CAGR of 7.1% through 2035. Its high output and energy-efficient design enable continuous ozone production at higher concentrations, making it ideal for large-scale water treatment plants, industrial wastewater facilities, and operations requiring reliable, scalable performance. Companies increasingly integrate this technology into their offerings, responding to customer demand and driving market growth.
The water treatment segment accounted for a 23% share in 2025 and is anticipated to grow at a CAGR of 8% from 2026 to 2035. Rising investments in drinking water purification, wastewater reuse, and water treatment infrastructure are fueling adoption. Ozone-based systems are preferred for their effective disinfection, removal of organic impurities, and ability to treat water without leaving chemical residues. Government regulations and institutional initiatives enforcing stricter water quality standards are accelerating the transition toward advanced, ozone-based water treatment solutions.
U.S. Ozone Generator Market held a 90.6% share in 2025 and is projected to generate USD 177 million by 2035. Federal and state funding for water purification, wastewater reuse, and environmental projects is supporting ozone generator adoption. Utilities increasingly rely on chemical-free disinfection technologies to comply with stricter water quality regulations and sustainability objectives. The presence of major players and strategic partnerships with emerging firms further strengthens the U.S. market position.
Key companies shaping the Global Ozone Generator Market include Aeolus Sustainable Bio Energy Pvt Ltd, Aurozone, Chemtronics, EBARA Technologies, Eltech Ozone Pvt. Ltd., Faraday Ozone, Prolux, Guangzhou Quanju Ozone Technology Co., Ltd., Minnuo Gas Equipment Co., Ltd, Mitsubishi Electric, OTSIL, Oxyzone International, OZ-AIR Malaysia, Ozonetek, Pacific Water Technology, Primozone, Salher, Veolia, Toshiba, and Xylem Water. Companies in the Global Ozone Generator Market are employing diverse strategies to expand their market presence. They are investing in research and development to enhance energy efficiency and ozone output, introducing technologically advanced solutions to meet evolving regulatory standards, and forming strategic partnerships or alliances to enter new regional markets. Many are also focusing on strengthening domestic manufacturing capabilities, expanding distribution networks, and offering tailored solutions to industries with specific water and air treatment needs. These combined efforts help firms increase market share, reinforce brand recognition, and maintain a competitive edge in the growing ozone generator market.
Table of Contents
Chapter 1 Methodology & Scope
- 1.1 Research design
- 1.2 Quality commitment
- 1.2.1 GMI AI policy & data integrity commitment
- 1.2.1.1 Source consistency protocol
- 1.2.1 GMI AI policy & data integrity commitment
- 1.3 Research Trail & Confidence Scoring
- 1.3.1 Research Trail Components
- 1.3.2 Scoring Components
- 1.4 Data Collection
- 1.4.1 Partial list of primary sources
- 1.5 Data mining sources
- 1.5.1 Paid sources
- 1.5.1.1 Sources, by region
- 1.5.1 Paid sources
- 1.6 Base estimates and calculations
- 1.6.1 Base year calculation for any one approach
- 1.7 Forecast model
- 1.8 Research transparency addendum
- 1.8.1 Source attribution framework
- 1.8.2 Quality assurance metrics
- 1.8.3 Our commitment to trust
- 1.9 Market definitions
Chapter 2 Executive Summary
- 2.1 Industry synopsis, 2022 - 2035
- 2.2 Business trends
- 2.3 Technology trends
- 2.4 Application trends
- 2.5 End use trends
- 2.6 Capacity trends
- 2.7 Regional trends
Chapter 3 Industry Insights
- 3.1 Industry ecosystem
- 3.1.1 Raw material availability & sourcing analysis
- 3.1.2 Manufacturing capacity assessment
- 3.1.3 Supply chain resilience & risk factors
- 3.1.4 Distribution network analysis
- 3.2 Regulatory landscape
- 3.3 Industry impact forces
- 3.3.1 Growth drivers
- 3.3.2 Industry pitfalls & challenges
- 3.4 Growth potential analysis
- 3.5 Porter's analysis
- 3.5.1 Bargaining power of suppliers
- 3.5.2 Bargaining power of buyers
- 3.5.3 Threat of new entrants
- 3.5.4 Threat of substitutes
- 3.6 PESTEL analysis
- 3.6.1 Political factors
- 3.6.2 Economic factors
- 3.6.3 Social factors
- 3.6.4 Technological factors
- 3.6.5 Legal factors
- 3.6.6 Environmental factors
- 3.7 Cost structure analysis
- 3.8 Price trend analysis (USD/Units)
- 3.8.1 By technology
- 3.9 Investment analysis & future outlook
- 3.9.1 Decentralization of water treatment
- 3.9.2 Digitalization and IoT integration
- 3.9.3 Energy efficiency innovations
- 3.10 Technology Innovation Landscape
- 3.10.1 Corona discharge technology advancements
- 3.10.2 Electrolytic ozone generation innovations
- 3.10.3 UV-based generation developments
- 3.10.4 Cold plasma technology evolution
Chapter 4 Competitive landscape, 2026
- 4.1 Introduction
- 4.2 Company market share analysis, by region, 2025
- 4.2.1 North America
- 4.2.2 Europe
- 4.2.3 Asia Pacific
- 4.2.4 Latin America
- 4.2.5 Middle East & Africa
- 4.3 Strategic dashboard
- 4.4 Strategic initiatives
- 4.5 Company benchmarking
- 4.6 Innovation & technology landscape
Chapter 5 Market Size and Forecast, By Technology, 2022 - 2035 (USD Million & Units)
- 5.1 Key trends
- 5.2 Ultraviolet
- 5.3 Cold plasma
- 5.4 Corona discharge
- 5.5 Electrolytic
Chapter 6 Market Size and Forecast, By Application, 2022 - 2035 (USD Million & Units)
- 6.1 Key trends
- 6.2 Water treatment
- 6.2.1 Municipal water treatment
- 6.2.2 Industrial process water treatment
- 6.2.3 Others
- 6.3 Laboratory & medical equipment
- 6.4 Air treatment
- 6.5 Others
Chapter 7 Market Size and Forecast, By End Use, 2022 - 2035 (USD Million & Units)
- 7.1 Key trends
- 7.2 Commercial
- 7.3 Municipal
- 7.4 Industrial
- 7.4.1 Automotive
- 7.4.2 Food & beverages
- 7.4.3 Textile
- 7.4.4 Pharmaceutical
- 7.4.5 Others
Chapter 8 Market Size and Forecast, By Capacity, 2022 - 2035 (USD Million & Units)
- 8.1 Key trends
- 8.2 ≥ 5 gm/hr
- 8.3 5 gm/hr - 100 gm/hr
- 8.4 100 gm/hr - 1 kg/hr
- 8.5 1 kg/hr - 5 kg/hr
- 8.6 > 5 kg/hr
Chapter 9 Market Size and Forecast, By Region, 2022 - 2035 (USD Million & Units)
- 9.1 Key trends
- 9.2 North America
- 9.2.1 U.S.
- 9.2.2 Canada
- 9.3 Europe
- 9.3.1 Germany
- 9.3.2 UK
- 9.3.3 France
- 9.3.4 Russia
- 9.3.5 Italy
- 9.3.6 Spain
- 9.4 Asia Pacific
- 9.4.1 China
- 9.4.2 Australia
- 9.4.3 India
- 9.4.4 Japan
- 9.5 Middle East & Africa
- 9.5.1 Saudi Arabia
- 9.5.2 UAE
- 9.5.3 Egypt
- 9.6 Latin America
- 9.6.1 Brazil
- 9.6.2 Argentina
Chapter 10 Company Profiles
- 10.1 Aeolus Sustainable Bio Energy Pvt Ltd
- 10.2 Aurozone
- 10.3 Chemtronics
- 10.4 EBARA Technologies
- 10.5 Eltech Ozone Pvt. Ltd.
- 10.6 Faraday Ozone
- 10.7 Prolux
- 10.8 Guangzhou Quanju Ozone Technology Co., Ltd.
- 10.9 Minnuo Gas Equipment Co., Ltd
- 10.10 Mitsubishi Electric
- 10.11 OTSIL
- 10.12 Oxyzone International
- 10.13 OZ-AIR Malaysia
- 10.14 Ozonetek
- 10.15 Pacific Water Technology
- 10.16 Primozone
- 10.17 Salher
- 10.18 Veolia
- 10.19 Toshiba
- 10.20 Xylem Water
 空冷式臭氧產生器市場:按應用、技術、終端用戶產業、產能和分銷管道分類-2026-2032年全球預測水冷式臭氧產生器市場:按輸出容量、模組類型、分銷管道、應用和最終用戶分類-2026-2032年全球預測
 全球臭氧產生器市場規模、佔有率、趨勢和成長分析報告(2026-2034年)
 2026年全球臭氧產生器市場報告
 臭氧產生器市場 - 全球產業規模、佔有率、趨勢、機會及預測(按技術、應用、最終用途、類型、地區和競爭格局分類,2021-2031年)
 日本臭氧發生器市場報告(按技術、應用、最終用戶和地區分類,2026-2034年)
 臭氧產生器市場規模、佔有率和成長分析(按製程、技術、應用、終端用戶產業和地區分類)-2026-2033年產業預測
 紫外線臭氧消毒設備:全球市佔率及排名、總收入及需求預測(2025-2031年)
 全球工業製氧機市場(按氣體類型/流量、尺寸、設計、技術、最終用途產業和地區分類)- 預測至2030年2025-2033年臭氧發生器市場報告(依技術、應用、最終用途及地區)