


 |
市場調查報告書
商品編碼
1982301
安全閥市場機會、成長要素、產業趨勢分析及2026-2035年預測。Safety Valves Market Opportunity, Growth Drivers, Industry Trend Analysis, and Forecast 2026 - 2035 |
||||||
預計到 2025 年,全球安全閥市場價值將達到 46 億美元,並預計以 5.2% 的複合年成長率成長,到 2035 年達到 75 億美元。
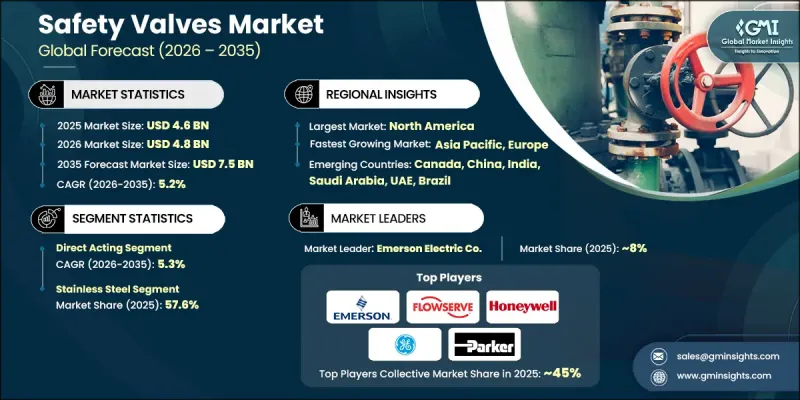
近年來,在更嚴格的安全法規、工業基礎設施現代化以及關鍵產業對高壓處理系統日益成長的需求的推動下,市場成長勢頭強勁。隨著工業活動日益複雜,法規結構日益嚴格,企業越來越重視可靠的過壓保護系統。安全閥透過防止壓力相關故障,在保護設備、人員和生產連續性方面繼續發揮至關重要的作用。工廠升級改造投資的增加、老舊工業資產的擴建以及對運作可靠性的日益重視,正在推動全球市場需求。為了滿足不斷變化的製程要求,諸如先導式系統、高壓直動式閥門和波紋管密封設計等先進配置正被廣泛採用。然而,由於技術先進的閥門系統需要大量資金投入和大規模的設施建設,其應用仍面臨挑戰。儘管有這些限制,但持續的工業化進程和以合規為主導的籌資策略將繼續推動安全閥市場的長期成長。
| 市場範圍 | |
|---|---|
| 開始年份 | 2025 |
| 預測期 | 2026-2035 |
| 上市時的市場規模 | 46億美元 |
| 預測金額 | 75億美元 |
| 複合年成長率 | 5.2% |
預計到2025年,直動式閥門市場規模將達21億美元,並在2026年至2035年間以5.3%的複合年成長率成長。該類別閥門憑藉其結構簡單、性能可靠以及對中低壓系統的適應性而佔據市場主導地位。其廣泛的適用性使其能夠應用於常見的工業流程,從而保證了維護和更換週期的穩定需求。隨著營運商日益適應標準化的壓力保護框架和法規遵循要求,直動式閥門仍然是實現經濟高效且可靠的安全管理的最佳解決方案。
不鏽鋼閥門佔據57.6%的市場佔有率,預計到2025年市場規模將達26億美元。不銹鋼安全閥因其耐腐蝕性、結構強度以及在高溫高壓條件下的優異性能而被廣泛應用。其在嚴苛運作環境下的耐用性使其成為對合規性和運作穩定性要求極高的產業不可或缺的設備。隨著高要求加工系統的日益普及,不銹鋼閥門在全球的應用正在加速成長。
美國安全閥市場預計到2025年將達到9.424億美元,並在2026年至2035年間以5.4%的複合年成長率成長。區域需求主要受設備更新、設施升級和定期維護週期的驅動。對可追溯性、認證和嚴格安全標準合規性的日益重視,促使買家優先考慮耐腐蝕材料和可靠的原始設備製造商 (OEM)。對法規遵從性和營運效率的持續關注,也維持了整個產業部門穩定的供應量。
目錄
第1章:調查方法和範圍
第2章執行摘要
第3章業界考察
- 生態系分析
- 供應商情況
- 利潤率
- 每個階段增加的價值
- 影響價值鏈的因素
- 影響產業的因素
- 促進因素
- 先進安全閥系統成本不斷上漲
- 各種安全閥技術和專用系統的應用正在不斷推進。
- 減輕工業企業財務負擔的需求日益成長。
- 產業潛在風險與挑戰
- 政府對工業現代化和設備升級的補貼
- 缺乏標準化的規章制度和製程安全框架
- 產業機遇
- 擴大基於數位和精密技術的安全技術的應用
- 拓展數位化平台和按需工業安全服務
- 促進因素
- 成長潛力分析
- 未來市場趨勢
- 科技與創新趨勢
- 當前技術趨勢
- 新興技術
- 價格趨勢
- 按地區
- 依產品類型
- 監理情勢
- 標準和合規要求
- 區域法規結構
- 認證標準
- 波特的分析
- PESTEL 分析
第4章 競爭情勢
- 介紹
- 企業市佔率分析
- 按地區
- 北美洲
- 歐洲
- 亞太地區
- 拉丁美洲
- 中東和非洲
- 按地區
- 企業矩陣分析
- 主要市場公司的競爭分析
- 競爭定位矩陣
- 主要進展
- 併購
- 夥伴關係與合作
- 新產品發布
- 業務拓展計劃
第5章 安全閥市場估價與預測:按類型分類,2022-2035年
- 直接作用型
- 風箱
- 先導操作
第6章 安全閥市場估價與預測:依材料分類,2022-2035年
- 不銹鋼
- 碳鋼
- 黃銅
- 塑膠
- 其他(因科鎳合金等)
第7章 安全閥市場規模估算與預測(2022-2035年)
- 小於1英寸
- 1英寸至6英寸
- 6英寸至25英寸
- 25英寸至50英寸
- 50吋或更大
第8章 安全閥市場估算與預測:依壓力範圍分類,2022-2035年
- 小於 35 兆帕
- 35~70 MPa
- 70~110 MPa
- 400 MPa
- 700 MPa
- 20 kpsi
- 60 kpsi
第9章 安全閥市場估價與預測:依最終用戶分類,2022-2035年
- 石油和天然氣
- 用水和污水處理
- 電力業
- 化工
- 其他
第10章 安全閥市場估價與預測:依通路分類,2022-2035年
- 直銷
- 間接銷售
第11章 安全閥市場估價與預測:按地區分類,2022-2035年
- 北美洲
- 美國
- 加拿大
- 歐洲
- 德國
- 英國
- 法國
- 義大利
- 西班牙
- 亞太地區
- 中國
- 印度
- 日本
- 韓國
- 澳洲
- 拉丁美洲
- 巴西
- 墨西哥
- 中東和非洲(MEA)
- 沙烏地阿拉伯
- 阿拉伯聯合大公國
第12章:公司簡介
- Burkert Fluid Control Systems
- Cameron
- Crane Co.
- Emerson Electric Co.
- Flowserve Corporation
- GE Measurement &Control Solutions
- Honeywell International Inc.
- Moog Inc.
- Parker Hannifin Corporation
- Pentair plc
- Rotork Plc
- Schneider Electric SE
- Spirax Sarco Limited
- ValvTechnologies, Inc.
- Watts Water Technologies, Inc.
The Global Safety Valves Market was valued at USD 4.6 billion in 2025 and is estimated to grow at a CAGR of 5.2% to reach USD 7.5 billion by 2035.
Market growth has remained steady in recent years, supported by stricter safety mandates, modernization of industrial infrastructure, and rising deployment of high-pressure processing systems across critical industries. As industrial operations become more complex and regulatory frameworks tighten, companies are placing stronger emphasis on reliable overpressure protection systems. Safety valves continue to serve as essential components that safeguard equipment, personnel, and production continuity by preventing pressure-related failures. Growing investment in plant upgrades, expansion of aging industrial assets, and heightened focus on operational reliability are reinforcing global demand. Advanced configurations, including pilot-operated systems, high-pressure direct-acting models, and bellows-sealed designs, are gaining wider adoption to meet evolving process requirements. However, integrating technologically advanced valve systems remains a challenge due to capital intensity and large-scale facility requirements. Despite these constraints, sustained industrialization and compliance-driven procurement strategies continue to drive long-term growth in the safety valves market.
| Market Scope | |
|---|---|
| Start Year | 2025 |
| Forecast Year | 2026-2035 |
| Start Value | $4.6 Billion |
| Forecast Value | $7.5 Billion |
| CAGR | 5.2% |
The direct-acting valves segment generated USD 2.1 billion in 2025 and is anticipated to grow at a CAGR of 5.3% from 2026 to 2035. This category leads the market due to its straightforward engineering, dependable performance, and adaptability across low- to mid-pressure systems. Its broad suitability for general industrial processes supports consistent demand in maintenance and replacement cycles. As operators increasingly align with standardized pressure protection frameworks and regulatory compliance requirements, direct-acting valves remain the preferred solution for cost-efficient and reliable safety management.
The stainless steel segment held 57.6% share, generating USD 2.6 billion in 2025. Stainless steel safety valves are widely selected for their corrosion resistance, structural strength, and ability to perform under high-temperature and high-pressure conditions. Their durability in harsh operating environments makes them indispensable in industries requiring stringent compliance and operational resilience. Expanding installation of demanding processing systems continues to accelerate the adoption of stainless steel valves worldwide.
U.S. Safety Valves Market reached USD 942.4 million in 2025 and is projected to grow at a CAGR of 5.4% between 2026 and 2035. Regional demand is supported by ongoing asset replacement programs, facility upgrades, and routine maintenance cycles. Increasing emphasis on traceability, certification, and adherence to strict safety standards is encouraging buyers to prioritize corrosion-resistant materials and trusted original equipment manufacturers. The focus on regulatory compliance and operational efficiency continues to sustain steady procurement volumes across industrial sectors.
Key participants in the Global Safety Valves Market include Emerson Electric Co., Flowserve Corporation, Crane Co., Parker Hannifin Corporation, Honeywell International Inc., Schneider Electric SE, Pentair plc, Rotork Plc, Spirax Sarco Limited, Watts Water Technologies, Inc., Moog Inc., ValvTechnologies, Inc., Burkert Fluid Control Systems, Cameron, and GE Measurement & Control Solutions. Companies in the Global Safety Valves Market are reinforcing their competitive position through product innovation, certification expansion, and strategic partnerships. Manufacturers are investing in advanced materials, digital monitoring integration, and enhanced pressure-control technologies to improve reliability and lifecycle performance. Expanding global distribution networks and strengthening aftermarket services help companies secure recurring revenue through maintenance and replacement contracts. Strategic collaborations with engineering firms and industrial operators enable customized valve solutions for complex applications. Firms are also prioritizing compliance with international safety standards and obtaining third-party certifications to build trust and credibility.
Table of Contents
Chapter 1 Methodology & Scope
- 1.1 Market scope and definition
- 1.2 Research design
- 1.2.1 Research approach
- 1.2.2 Data collection methods
- 1.3 Data mining sources
- 1.3.1 Global
- 1.3.2 Regional/Country
- 1.4 Base estimates and calculations
- 1.4.1 Base year calculation
- 1.4.2 Key trends for market estimation
- 1.5 Primary research and validation
- 1.5.1 Primary sources
- 1.6 Forecast model
- 1.7 Research assumptions and limitations
Chapter 2 Executive Summary
- 2.1 Industry 360° synopsis
- 2.2 Key market trends
- 2.2.1 Regional
- 2.2.2 Type
- 2.2.3 Material
- 2.2.4 Size
- 2.2.5 Pressure Range
- 2.2.6 End User
- 2.2.7 Distribution Channel
Chapter 3 Industry Insights
- 3.1 Industry ecosystem analysis
- 3.1.1 Supplier landscape
- 3.1.2 Profit margin
- 3.1.3 Value addition at each stage
- 3.1.4 Factor affecting the value chain
- 3.2 Industry impact forces
- 3.2.1 Growth drivers
- 3.2.1.1 Rising cost of advanced safety valve systems
- 3.2.1.2 Growing availability of diverse safety valve technologies and application specific systems
- 3.2.1.3 Increasing need to reduce financial burden on industrial operators
- 3.2.2 Industry pitfalls & challenges
- 3.2.2.1 Government subsidies for industrial modernization and equipment upgrades
- 3.2.2.2 Lack of standardized regulations and process-safety frameworks.
- 3.2.3 Industry Opportunities
- 3.2.3.1 Increasing adoption of digital and precision based safety technologies
- 3.2.3.2 Expansion of digital platforms and on demand industrial safety services
- 3.2.1 Growth drivers
- 3.3 Growth potential analysis
- 3.4 Future market trends
- 3.5 Technology and innovation landscape
- 3.5.1 Current technological trends
- 3.5.2 Emerging technologies
- 3.6 Price trends
- 3.6.1 By region
- 3.6.2 By Product type
- 3.7 Regulatory landscape
- 3.7.1 Standards and compliance requirements
- 3.7.2 Regional regulatory frameworks
- 3.7.3 Certification standards
- 3.8 Porter’s analysis
- 3.9 PESTEL analysis
Chapter 4 Competitive Landscape, 2025
- 4.1 Introduction
- 4.2 Company market share analysis
- 4.2.1 By Region
- 4.2.1.1 North America
- 4.2.1.2 Europe
- 4.2.1.3 Asia Pacific
- 4.2.1.4 Latin America
- 4.2.1.5 Middle East & Africa
- 4.2.1 By Region
- 4.3 Company matrix analysis
- 4.4 Competitive analysis of major market players
- 4.5 Competitive positioning matrix
- 4.6 Key developments
- 4.6.1 Mergers & acquisitions
- 4.6.2 Partnerships & collaborations
- 4.6.3 New product launches
- 4.6.4 Expansion plans
Chapter 5 Safety Valves Market Estimates & Forecast, By Type, 2022 - 2035, (USD Billion) (Thousand Units)
- 5.1 Key trends
- 5.2 Direct acting
- 5.3 Bellows
- 5.4 Pilot-operated
Chapter 6 Safety Valves Market Estimates & Forecast, By Material, 2022 - 2035, (USD Billion) (Thousand Units)
- 6.1 Key trends
- 6.2 Stainless Steel
- 6.3 Carbon Steel
- 6.4 Brass
- 6.5 Plastic
- 6.6 Others (Inconel, etc.)
Chapter 7 Safety Valves Market Estimates & Forecast, By Size, 2022 - 2035, (USD Billion) (Thousand Units)
- 7.1 Key trends
- 7.2 Up to 1"
- 7.3 1" to 6"
- 7.4 6" to 25"
- 7.5 25" to 50"
- 7.6 50" and Larger
Chapter 8 Safety Valves Market Estimates & Forecast, By Pressure Range, 2022 - 2035, (USD Billion) (Thousand Units)
- 8.1 Key trends
- 8.2 < 35MPa
- 8.3 35 - 70 MPa
- 8.4 70 - 110 MPa
- 8.5 400 MPa
- 8.6 700 MPa
- 8.7 20 kpsi
- 8.8 60 kpsi
Chapter 9 Safety Valves Market Estimates & Forecast, By End Users, 2022 - 2035, (USD Billion) (Thousand Units)
- 9.1 Key trends
- 9.2 Oil & Gas
- 9.3 Water & Wastewater Treatment
- 9.4 Power Industry
- 9.5 Chemical Industry
- 9.6 Others
Chapter 10 Safety Valves Market Estimates & Forecast, By Distribution Channel, 2022 - 2035, (USD Billion) (Thousand Units)
- 10.1 Key trends
- 10.2 Direct Sales
- 10.3 Indirect Sales
Chapter 11 Safety Valves Market Estimates & Forecast, By Region, 2022 - 2035, (USD Billion) (Thousand Units)
- 11.1 Key trends
- 11.2 North America
- 11.2.1 U.S.
- 11.2.2 Canada
- 11.3 Europe
- 11.3.1 Germany
- 11.3.2 UK
- 11.3.3 France
- 11.3.4 Italy
- 11.3.5 Spain
- 11.4 Asia Pacific
- 11.4.1 China
- 11.4.2 India
- 11.4.3 Japan
- 11.4.4 South Korea
- 11.4.5 Australia
- 11.5 Latin America
- 11.5.1 Brazil
- 11.5.2 Mexico
- 11.6 MEA
- 11.6.1 Saudi Arabia
- 11.6.2 UAE
Chapter 12 Company Profiles
- 12.1 Burkert Fluid Control Systems
- 12.2 Cameron
- 12.3 Crane Co.
- 12.4 Emerson Electric Co.
- 12.5 Flowserve Corporation
- 12.6 GE Measurement & Control Solutions
- 12.7 Honeywell International Inc.
- 12.8 Moog Inc.
- 12.9 Parker Hannifin Corporation
- 12.10 Pentair plc
- 12.11 Rotork Plc
- 12.12 Schneider Electric SE
- 12.13 Spirax Sarco Limited
- 12.14 ValvTechnologies, Inc.
- 12.15 Watts Water Technologies, Inc.
 全球安全閥市場規模、佔有率、趨勢和成長分析報告(2026-2034年)
 安全閥市場:2026-2032年全球市場預測(依產品類型、額定壓力、材質、尺寸、連接方式及最終用途產業分類)安全閥市場:策略洞察與預測(2026-2031年)智慧安全閥市場按類型、技術、壓力範圍、應用、最終用戶和分銷管道分類,全球預測(2026-2032年)
 2026年全球安全閥市場報告
 安全閥市場規模、佔有率及成長分析(按材質、尺寸、產業及地區分類)-2026-2033年產業預測
 全球安全閥市場預測(至 2032 年):按產品類型、材料、尺寸、分銷管道、最終用戶和地區分類
 安全閥市場 - 2024-2034 年全球產業分析、規模、佔有率、成長、趨勢與預測
 安全閥的全球市場:成長,未來展望,競爭分析 (2024年~2032年)全球彈簧加載洩壓閥市場規模(按產品、應用、地區、範圍和預測)