


 |
市場調查報告書
商品編碼
1982268
電力製液(P2L)物流市場:成長機會、成長要素、產業趨勢分析及2026-2035年預測Power-to-Liquids Logistics Market Opportunity, Growth Drivers, Industry Trend Analysis, and Forecast 2026 - 2035 |
||||||
全球電力製液 (P2L) 物流市場預計到 2025 年將價值 4,610 萬美元,預計到 2035 年將以 8.2% 的複合年成長率成長至 9,870 萬美元。
隨著全球加速推動難以電氣化的交通運輸產業的脫碳進程,市場成長動能日益強勁。這個市場反映出對用於管理再生能源和利用碳捕獲合成燃料的專用基礎設施的需求不斷成長。氣候變遷法規、不斷演進的永續性目標以及合成燃料商業化的推進,共同推動了這一成長趨勢。由於生產基地通常位於可再生能源中心和碳捕獲設施附近,高效的儲存、處理和運輸系統對於確保終端使用者的安全供應至關重要。因此,相關人員正在投資碼頭升級、先進的運輸網路和數位化監控平台,以滿足P2L(電轉液)物流需求。在支持性政策框架持續推動基礎建設的同時,創新也不斷提升整個供應鏈的營運可靠性、可追溯性和安全標準。
| 市場範圍 | |
|---|---|
| 開始年份 | 2025 |
| 預測期 | 2026-2035 |
| 上市時的市場規模 | 4610萬美元 |
| 預測金額 | 9870萬美元 |
| 複合年成長率 | 8.2% |
電力製油 (P2L) 物流市場正受惠於旨在減少碳排放的監管措施。政策獎勵和合規框架正在整體倉儲和配送系統的基礎設施升級和私人投資。技術進步也在改變物流績效,現代化管道正在維修以適應合成燃料,新型鐵路車輛、船舶和油輪系統也正在投入使用。能源生產商、物流運營商和科技公司攜手建構一體化配送模式,產業合作正在加速發展。各公司正在部署數位化追蹤平台、自動化工具和先進的安全系統以簡化營運。聯合舉措正在支持專用混合設施的建設、增強型倉儲設施的開發以及生產工廠與多模態走廊的無縫連接。
在電力製油(P2L)物流市場中,預計到2025年,合成柴油將佔據40%的市場佔有率,市場規模將達到1,820萬美元。其主導地位得益於航運和運輸業的強勁需求。合成柴油與傳統柴油基礎設施相容,無需對儲油碼頭或燃料配送系統進行大規模維修,即可透過現有的公路、鐵路和海運網路進行運輸。這種營運柔軟性提高了成本效益,並加速了市場普及。
預計到2025年,運輸服務領域將佔62.7%的市場佔有率,到2035年將達到6,030萬美元。由於生產設施通常與消費點地理位置相距甚遠,運輸仍是P2L物流市場中最關鍵的因素。雖然合成燃料工廠通常位於可再生能源資源和碳捕獲區域附近,但工業叢集、港口和機場等主要需求中心卻位於其他地區。供需之間的這種物理距離增加了對協調的多模態網路的依賴,使得物流成為計劃總成本和市場成長的重要影響因素。
預計2025年,美國電力製油(P2L)物流市場規模將達860萬美元。美國正崛起為商業規模合成燃料生產的戰略樞紐,直接推動了物流的擴張。聯邦和州級永續性政策正在促進對專用倉儲設施、鐵路連接、海運出口能力以及旨在應對日益成長的燃料運輸量的道路運輸解決方案的資本投入。隨著國內產能的擴大,對跨區域走廊的綜合性、標準化物流系統的需求持續成長。
目錄
第1章:調查方法
第2章執行摘要
第3章業界考察
- 生態系分析
- 供應商情況
- 利潤率
- 成本結構
- 每個階段增加的價值
- 影響價值鏈的因素
- 中斷
- 影響產業的因素
- 促進因素
- 提高對永續航空燃料(SAF)的要求
- 嚴格的全球脫碳和淨零排放目標
- 政府獎勵和碳定價機制
- 建構跨境綠色燃料貿易走廊
- 產業潛在風險與挑戰
- 專用倉儲和運輸設施有限。
- 對可再生能源供應狀況的依賴
- 市場機遇
- 開發電子燃料專用出口碼頭
- 官民合作關係促進永續燃料走廊建設
- 向可再生能源資源豐富的新興地區擴張
- 促進因素
- 成長潛力分析
- 監理情勢
- 北美洲
- 美國環保署(EPA)
- 聯邦能源管理委員會(FERC)
- 國家可再生能源實驗室(NREL)
- 加拿大能源監理局(CER)
- 歐洲
- 可再生燃料監理委員會(REFUREC)
- 歐盟委員會能源總司
- 歐洲能源監管機構委員會(CEER)
- 歐洲航空安全局(EASA)
- 亞太地區
- 東協能源監理網路(AERN)
- 泰國能源監管委員會
- 中國國家能源局
- 澳洲可再生能源署(ARENA)
- 拉丁美洲
- 石油、天然氣和生質燃料管理局(ANP)
- 能源監理委員會(CRE)
- 國家能源政策委員會(CNPE)
- 中東和非洲
- RAERESA
- 南非國家能源監管局(NERSA)
- 波灣合作理事會互聯機構(GCCIA)
- 北美洲
- 波特五力分析
- PESTEL 分析
- 科技與創新趨勢
- 當前技術趨勢
- 提高電解槽效率
- 費托合成製程的最佳化
- 可再生氫整合到燃料合成中
- 新興技術
- 將直接空氣回收(DAC)整合到PtL系統中
- 商業規模固體氧化物電解(SOEC)
- 當前技術趨勢
- 生產統計
- 生產基地
- 消費者群體
- 出口和進口
- 價格趨勢
- 按地區
- 按燃料
- 成本細分分析
- 永續性和環境影響
- 環境影響評估
- 社會影響和對社區的益處
- 公司管治與企業社會責任
- 永續金融與投資趨勢
- 基礎建設發展現況及能力分析
- 全球PtL生產設施分佈圖
- 區域物流基礎設施短缺
- 終端和混合設施的可用性
- 管道和運輸網路的適用性
- 未來基礎建設投資需求
- 物流風險評估與緩解措施
- 儲存穩定性和劣化風險
- 運輸安全通訊協定
- 供應鏈中斷情景
- 緊急時應對計畫和備用路線
- 案例研究
- 未來展望與機遇
第4章 競爭情勢
- 介紹
- 企業市佔率分析
- 北美洲
- 歐洲
- 亞太地區
- 拉丁美洲
- 中東和非洲(MEA)
- 主要市場公司的競爭分析
- 競爭定位矩陣
- 主要進展
- 併購
- 夥伴關係與合作
- 新產品發布
- 業務拓展計劃及資金籌措
第5章 市場估算與預測:依燃料類型分類,2022-2035年
- 合成航空燃料(SAF)
- 合成柴油
- 乙醇
- 其他
第6章 市場估算與預測:依物流服務分類,2022-2035年
- 運輸服務
- 鐵路
- 陸路交通
- 海上運輸
- 管道
- 儲存服務
- 其他
第7章 市場估計與預測:依最終用途分類,2022-2035年
- 航空燃料
- 船用燃料
- 道路運輸燃料
第8章 市場估計與預測:依地區分類,2022-2035年
- 北美洲
- 美國
- 加拿大
- 歐洲
- 德國
- 英國
- 法國
- 義大利
- 西班牙
- 比利時
- 俄羅斯
- 荷蘭
- 亞太地區
- 中國
- 印度
- 日本
- 韓國
- 澳洲
- 新加坡
- 馬來西亞
- 印尼
- 越南
- 泰國
- 拉丁美洲
- 巴西
- 墨西哥
- 阿根廷
- 哥倫比亞
- 中東和非洲(MEA)
- 南非
- 沙烏地阿拉伯
- 阿拉伯聯合大公國
第9章:公司簡介
- 世界公司
- HIF Global
- Infinium
- Siemens Energy
- Sunfire
- Shell
- Air Liquide
- BP
- 當地公司
- Nordic Electrofuel
- P2X Solutions
- Repsol
- Twelve
- INERATEC
- Linde
- 物流公司
- Kuehne+Nagel
- DHL
- Hoyer
- 新興企業
- Synhelion
- Aemetis
- Carbon Engineering
- Dimensional Energy
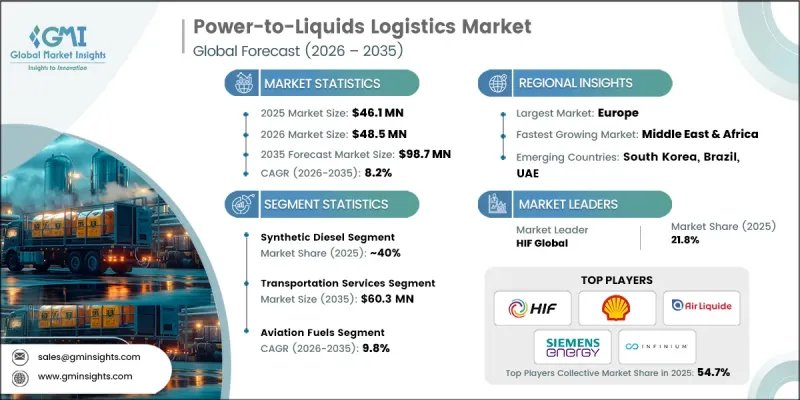
The Global Power-to-Liquids Logistics Market was valued at USD 46.1 million in 2025 and is estimated to grow at a CAGR of 8.2% to reach USD 98.7 million by 2035.
Market growth is gaining momentum as global industries accelerate efforts to decarbonize hard-to-electrify transportation segments such as aviation and maritime shipping. The market reflects the growing need for specialized infrastructure to manage fuels synthesized from renewable electricity and captured carbon. This upward trajectory is fueled by climate-driven regulations, evolving sustainability targets, and the increasing commercialization of synthetic fuels. Because production sites are typically located near renewable energy hubs or carbon capture facilities, efficient storage, handling, and transportation systems are crucial to ensure safe delivery to end-users. As a result, stakeholders are channeling investments into upgraded terminals, advanced transport networks, and digital monitoring platforms tailored to power-to-liquids logistics requirements. Supportive policy frameworks continue to shape infrastructure development, while innovation is improving operational reliability, traceability, and safety standards across the supply chain.
| Market Scope | |
|---|---|
| Start Year | 2025 |
| Forecast Year | 2026-2035 |
| Start Value | $46.1 Million |
| Forecast Value | $98.7 Million |
| CAGR | 8.2% |
The power-to-liquids logistics market is benefiting significantly from regulatory mandates designed to lower carbon emissions. Policy incentives and compliance frameworks are encouraging infrastructure upgrades and private investment across storage and distribution systems. Technological progress is also transforming logistics performance, with modernized pipelines being adapted to accommodate synthetic fuels and newly engineered railcars, marine vessels, and tanker systems entering service. Industry collaboration is accelerating development, as energy producers, logistics providers, and technology companies work together to create integrated distribution models. Companies are deploying digital tracking platforms, automation tools, and advanced safety systems to streamline operations. Joint initiatives are supporting the construction of specialized blending facilities, reinforced storage installations, and seamless connectivity between production plants and multimodal transport corridors.
Within the power-to-liquids logistics market, the synthetic diesel segment accounted for 40% of the share in 2025, generating USD 18.2 million. Its leadership position is driven by strong adoption across marine and transportation applications. Synthetic diesel offers compatibility with conventional diesel infrastructure, allowing it to move through established road, rail, and maritime networks without requiring extensive modifications to storage terminals or fuel distribution systems. This operational flexibility enhances cost efficiency and accelerates market uptake.
The transportation services segment held 62.7% share in 2025 and is forecast to reach USD 60.3 million by 2035. Transportation remains the most critical component of the power-to-liquids logistics market because production facilities are often geographically distant from consumption centers. Synthetic fuel plants are typically positioned near renewable energy resources and carbon capture zones, while major demand hubs, including industrial clusters, ports, and airports, are located elsewhere. The physical separation between supply and demand increases reliance on coordinated, multimodal transport networks, making logistics a substantial contributor to overall project costs and market growth.
U.S. Power-to-Liquids Logistics Market reached USD 8.6 million in 2025. The United States is emerging as a strategic center for commercial-scale synthetic fuel production, which directly stimulates logistics expansion. Federal and state-level sustainability policies are encouraging capital allocation toward specialized storage, rail connectivity, marine export capacity, and road transport solutions designed to handle growing fuel volumes. As domestic production capacity scales, the need for integrated and compliant logistics systems continues to strengthen across regional corridors.
Key participants operating in the Global Power-to-Liquids Logistics Market include Air Liquide, BP, HIF Global, INERATEC, Infinium, Nordic Electrofuel, Shell, Siemens Energy, Sunfire, and Twelve. Companies competing in the Power-to-Liquids Logistics Market are strengthening their foothold through strategic partnerships, infrastructure investments, and technology integration. Many players are forming alliances with renewable energy producers, carbon capture developers, and transportation operators to secure long-term supply and distribution agreements. Firms are also investing in upgraded storage terminals, specialized tanker fleets, and adaptable pipeline systems to improve operational flexibility. Digitalization remains a central strategy, with companies deploying real-time tracking systems, predictive maintenance tools, and data-driven optimization platforms to enhance efficiency and safety.
Table of Contents
Chapter 1 Methodology
- 1.1 Research approach
- 1.2 Quality commitments
- 1.2.1 GMI AI policy & data integrity commitment
- 1.3 Research trail & confidence scoring
- 1.3.1 Research trail components
- 1.3.2 Scoring components
- 1.4 Data collection
- 1.4.1 Partial list of primary sources
- 1.5 Data mining sources
- 1.5.1 Paid sources
- 1.6 Base estimates and calculations
- 1.6.1 Base year calculation
- 1.7 Forecast model
- 1.8 Research transparency addendum
Chapter 2 Executive Summary
- 2.1 Industry 360° synopsis, 2022 - 2035
- 2.2 Key market trends
- 2.2.1 Regional
- 2.2.2 Fuel
- 2.2.3 Logistics Service
- 2.2.4 End-Use
- 2.3 TAM analysis, 2026-2035
- 2.4 CXO perspectives: Strategic imperatives
Chapter 3 Industry Insights
- 3.1 Industry ecosystem analysis
- 3.1.1 Supplier landscape
- 3.1.2 Profit margin
- 3.1.3 Cost structure
- 3.1.4 Value addition at each stage
- 3.1.5 Factor affecting the value chain
- 3.1.6 Disruptions
- 3.2 Industry impact forces
- 3.2.1 Growth drivers
- 3.2.1.1 Rising sustainable aviation fuel (SAF) mandates
- 3.2.1.2 Stringent global decarbonization and net-zero targets
- 3.2.1.3 Government incentives and carbon pricing mechanisms
- 3.2.1.4 Development of cross-border green fuel trade corridors
- 3.2.2 Industry pitfalls and challenges
- 3.2.2.1 Limited dedicated storage and transport facilities
- 3.2.2.2 Dependence on renewable power availability
- 3.2.3 Market opportunities
- 3.2.3.1 Development of dedicated e-fuel export terminals
- 3.2.3.2 Public-private partnerships for sustainable fuel corridors
- 3.2.3.3 Expansion into emerging renewable-rich regions
- 3.2.1 Growth drivers
- 3.3 Growth potential analysis
- 3.4 Regulatory landscape
- 3.4.1 North America
- 3.4.1.1 U.S. Environmental Protection Agency (EPA)
- 3.4.1.2 Federal Energy Regulatory Commission (FERC)
- 3.4.1.3 National Renewable Energy Laboratory (NREL)
- 3.4.1.4 Canada Energy Regulator (CER)
- 3.4.2 Europe
- 3.4.2.1 Renewable Fuels Regulators Club (REFUREC)
- 3.4.2.2 European Commission - DG ENERGY
- 3.4.2.3 Council of European Energy Regulators (CEER)
- 3.4.2.4 European Union Aviation Safety Agency (EASA)
- 3.4.3 Asia Pacific
- 3.4.3.1 ASEAN Energy Regulators’ Network (AERN)
- 3.4.3.2 Energy Regulatory Commission (Thailand)
- 3.4.3.3 National Energy Administration (China)
- 3.4.3.4 Australian Renewable Energy Agency (ARENA)
- 3.4.4 Latin America
- 3.4.4.1 National Agency of Petroleum, Natural Gas and Biofuels (ANP)
- 3.4.4.2 Comision Reguladora de Energia (CRE)
- 3.4.4.3 National Energy Policy Council (CNPE)
- 3.4.5 Middle East & Africa
- 3.4.5.1 RAERESA
- 3.4.5.2 National Energy Regulator of South Africa (NERSA)
- 3.4.5.3 Gulf Cooperation Council Interconnection Authority (GCCIA)
- 3.4.1 North America
- 3.5 Porter's analysis
- 3.6 PESTEL analysis
- 3.7 Technology and innovation landscape
- 3.7.1 Current technological trends
- 3.7.1.1 Electrolyzer efficiency improvements
- 3.7.1.2 Fischer Tropsch synthesis optimization
- 3.7.1.3 Renewable hydrogen integration into fuel synthesis
- 3.7.2 Emerging technologies
- 3.7.2.1 Direct air capture (DAC) integration with PtL systems
- 3.7.2.2 Solid oxide electrolysis (SOEC) at commercial scale
- 3.7.1 Current technological trends
- 3.8 Production statistics
- 3.8.1 Production hubs
- 3.8.2 Consumption hubs
- 3.8.3 Export and import
- 3.9 Price trends
- 3.9.1 By region
- 3.9.2 By fuel
- 3.10 Cost breakdown analysis
- 3.11 Sustainability and environmental impact
- 3.11.1 Environmental impact assessment
- 3.11.2 Social impact & community benefits
- 3.11.3 Governance & corporate responsibility
- 3.11.4 Sustainable finance & investment trends
- 3.12 Infrastructure Readiness & Capacity Analysis
- 3.12.1 Global PtL production facility mapping
- 3.12.2 Logistics infrastructure gaps by region
- 3.12.3 Terminal and blending facility availability
- 3.12.4 Pipeline and transportation network adequacy
- 3.12.5 Future infrastructure investment requirements
- 3.13 Logistics Risk Assessment & Mitigation
- 3.13.1 Storage stability and degradation risks
- 3.13.2 Transportation safety protocols
- 3.13.3 Supply chain disruption scenarios
- 3.13.4 Contingency planning and alternative routing
- 3.14 Case studies
- 3.15 Future outlook & opportunities
Chapter 4 Competitive Landscape, 2025
- 4.1 Introduction
- 4.2 Company market share analysis
- 4.2.1 North America
- 4.2.2 Europe
- 4.2.3 Asia Pacific
- 4.2.4 LATAM
- 4.2.5 MEA
- 4.3 Competitive analysis of major market players
- 4.4 Competitive positioning matrix
- 4.5 Key developments
- 4.5.1 Mergers & acquisitions
- 4.5.2 Partnerships & collaborations
- 4.5.3 New product launches
- 4.5.4 Expansion plans and funding
Chapter 5 Market Estimates & Forecast, By Fuel, 2022 - 2035 ($Mn)
- 5.1 Key trends
- 5.2 Synthetic Aviation Fuel (SAF)
- 5.3 Synthetic diesel
- 5.4 E-methanol
- 5.5 Others
Chapter 6 Market Estimates & Forecast, By Logistics Service, 2022 - 2035 ($Mn)
- 6.1 Key trends
- 6.2 Transportation services
- 6.2.1 Rail
- 6.2.2 Road
- 6.2.3 Sea
- 6.2.4 Pipeline
- 6.3 Storage services
- 6.4 Others
Chapter 7 Market Estimates & Forecast, By End Use, 2022 - 2035 ($Mn)
- 7.1 Key trends
- 7.2 Aviation fuels
- 7.3 Marine fuels
- 7.4 Road transport fuels
Chapter 8 Market Estimates & Forecast, By Region, 2022 - 2035 ($Mn)
- 8.1 Key trends
- 8.2 North America
- 8.2.1 US
- 8.2.2 Canada
- 8.3 Europe
- 8.3.1 Germany
- 8.3.2 UK
- 8.3.3 France
- 8.3.4 Italy
- 8.3.5 Spain
- 8.3.6 Belgium
- 8.3.7 Russia
- 8.3.8 Netherlands
- 8.4 Asia Pacific
- 8.4.1 China
- 8.4.2 India
- 8.4.3 Japan
- 8.4.4 South Korea
- 8.4.5 Australia
- 8.4.6 Singapore
- 8.4.7 Malaysia
- 8.4.8 Indonesia
- 8.4.9 Vietnam
- 8.4.10 Thailand
- 8.5 Latin America
- 8.5.1 Brazil
- 8.5.2 Mexico
- 8.5.3 Argentina
- 8.5.4 Colombia
- 8.6 MEA
- 8.6.1 South Africa
- 8.6.2 Saudi Arabia
- 8.6.3 UAE
Chapter 9 Company Profiles
- 9.1 Global players
- 9.1.1 HIF Global
- 9.1.2 Infinium
- 9.1.3 Siemens Energy
- 9.1.4 Sunfire
- 9.1.5 Shell
- 9.1.6 Air Liquide
- 9.1.7 BP
- 9.2 Regional players
- 9.2.1 Nordic Electrofuel
- 9.2.2 P2X Solutions
- 9.2.3 Repsol
- 9.2.4 Twelve
- 9.2.5 INERATEC
- 9.2.6 Linde
- 9.3 Logistics players
- 9.3.1 Kuehne + Nagel
- 9.3.2 DHL
- 9.3.3 Hoyer
- 9.4 Emerging players
- 9.4.1 Synhelion
- 9.4.2 Aemetis
- 9.4.3 Carbon Engineering
- 9.4.4 Dimensional Energy
 能源韌性市場-全球產業規模、佔有率、趨勢、機會、預測:按類型、應用、地區和競爭格局分類,2021-2031年
 2026年全球電力服務市場報告
 能源轉型融資市場預測至2034年-按資金籌措方式、組成部分、能源來源、應用、最終用戶和地區分類的全球分析
 能源即服務市場:依服務模式、經營模式、最終用戶和服務供應商分類-2026-2032年全球市場預測
 2026-2034年全球電力服務公司市場規模、佔有率、趨勢和成長分析報告2026年全球能源物流市場報告能源物流市場:2026-2032年全球市場預測(依能源來源、服務類型、最終用戶產業及運輸方式分類)能源即服務 (EaaS) 市場規模、佔有率、成長和全球產業分析:按類型、應用和地區分類的洞察,2026-2034 年預測2026年全球能源即服務市場報告2026年全球能源即服務(EaaS)市場報告