


 |
市場調查報告書
商品編碼
1959666
太陽能逆變器市場機會、成長要素、產業趨勢分析及2026年至2035年預測。PV Inverter Market Opportunity, Growth Drivers, Industry Trend Analysis, and Forecast 2026 - 2035 |
||||||
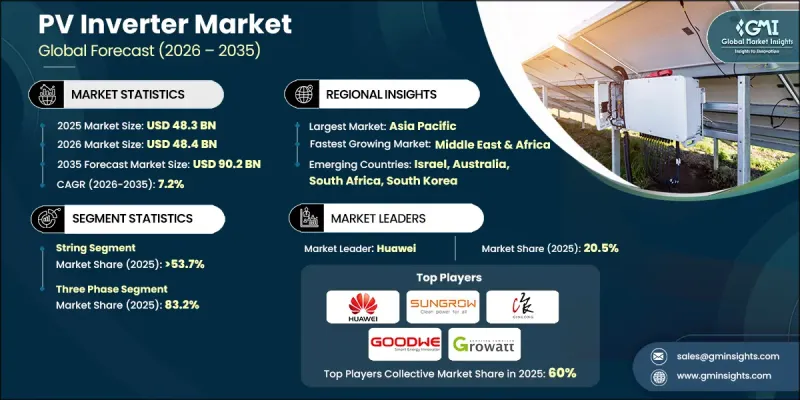
2025 年全球太陽能逆變器市場價值 483 億美元,預計到 2035 年將達到 902 億美元,年複合成長率為 7.2%。
市場成長的驅動力在於大型電站、商業屋頂和住宅系統中太陽能發電的加速普及,這要求高效轉換、嚴格的電網同步以及日益複雜的智慧電網支援能力。隨著太陽能發電的日益普及,逆變器的功能也從單純的轉換硬體發展成為現代太陽能發電系統的控制層,發揮著至關重要的作用,管理電壓和頻率特性,提高電能質量,實現遠距離診斷,並支持太陽能發電與儲能相結合的混合配置。這種轉變意味著,隨著電網規範和安全要求的不斷提高,尤其是在前期成本不斷增加的情況下,客戶更加重視長期可靠性、合規性和全生命週期性能。
| 市場範圍 | |
|---|---|
| 開始年份 | 2025 |
| 預測年份 | 2026-2035 |
| 起始值 | 483億美元 |
| 預測金額 | 902億美元 |
| 複合年成長率 | 7.2% |
成長的主要支柱是數位化和物聯網驅動的監控的快速轉型。開發商和資產所有者希望透過即時了解逆變器效能、設定預測性維護觸發條件以及加快故障排除速度,最大限度地減少停機時間並提高發電量。同時,混合太陽能和儲能系統的普及正在推動市場發展,因為企業和家庭都在尋求透過備用電源、抑低尖峰負載和提高自用率來增強能源韌性並實現更優的能源經濟效益。為了因應這些趨勢,製造商正在努力開發具有更強大的併網/併網支援能力、改進的通訊協定和軟體驅動最佳化功能的逆變器,使其發展成為能夠與電網互動的設備,即使在可再生能源比例較高的環境中也能為電網穩定性做出貢獻。
預計到2025年,串列型逆變器將佔據53.7%的市場。組串式逆變器在住宅和小規模商業環境中仍是經濟高效部署的核心產品,同時,由於額定功率的提升、多MPPT設計以及安全性和監控能力的增強,其應用範圍也在不斷擴大,涵蓋了大規模屋頂安裝和分散式計劃。在不斷成長的屋頂市場中,開發人員尋求在不犧牲性能的前提下最佳化系統平衡成本的設計方案,串列型逆變器持續吸引那些希望在效率、系統設計柔軟性和易於維護性之間取得良好平衡的買家。
預計到2025年,三相逆變器市佔率將達到83.2%,並在2026年至2035年間以7.5%的複合年成長率成長。太陽能發電系統在商業、工業和住宅領域的日益普及推動了三相光伏逆變器的應用,而三相逆變器需要平衡的功率分配、高效率和穩定的電網性能,以應對更大的負載和持續的能源消耗。此外,為了滿足嚴格的併網標準和提高電能品質標準,多相逆變器的需求也不斷成長。多相逆變器能夠改善電壓調節、降低諧波失真並增強頻率穩定性,從而促進分散式太陽能發電平穩地併入本地電網。
預計到2025年,美國光電逆變器市佔率將達到98.8%,到2035年將成長至90億美元。聯邦稅額扣抵、各州可再生能源目標以及強勁的計劃儲備正在推動住宅、商業和公共產業太陽能領域對高效、併網兼容的電力轉換解決方案的需求,同時,全國範圍內大規模和分佈式太陽能裝置的快速擴張也促進了光伏逆變器的應用。主要行業參與者的存在及其在該地區持續推出先進產品系列的努力,預計將進一步支持市場的持續成長。
目錄
第1章:調查方法和範圍
第2章執行摘要
第3章業界考察
- 產業生態系統
- 原物料供應及採購分析
- 製造能力評估
- 供應鏈韌性與風險因素
- 電力分配網路分析
- 監管環境
- 影響產業的因素
- 促進因素
- 產業潛在風險與挑戰
- 成長潛力分析
- 成本結構分析
- 價格趨勢分析(美元/兆瓦)
- 依產品
- 波特五力分析
- PESTEL 分析
- 技術與創新現狀
- 最大功率點追蹤(MPPT)技術的進步
- 人工智慧智慧逆變器技術
- 混合逆變器整合
- 投資與資金籌措分析
- 創業投資與私募股權投資
- 政府獎勵和補貼的影響
- 主要企業研發投資趨勢
第4章 競爭情勢
- 介紹
- 企業市佔率分析:按地區分類
- 北美洲
- 歐洲
- 亞太地區
- 拉丁美洲
- 中東和非洲
- 戰略儀錶板
- 策略舉措
- 企業標竿管理
- 創新與科技趨勢
第5章 市場規模及預測:依產品分類,2022-2035年
- 細繩
- 微
- 中央
第6章 市場規模及預測:依階段分類,2022-2035年
- 單相
- 三相
第7章 市場規模及預測:以連結方式分類,2022-2035年
- 獨立的
- 並網型
第8章 市場規模及預測:以額定產量計算,2022-2035年
- ≤0.5千瓦
- 0.5–3千瓦
- 3~33 kW
- 33~110 kW
- 超過110千瓦
第9章 市場規模及預測:依額定輸出電壓分類,2022-2035年
- ≤230伏
- 230-400伏
- 400-600 V
- 超過600伏
第10章 市場規模及預測:依應用領域分類,2022-2035年
- 住宅
- 商業和工業
- 公共產業
第11章 市場規模及預測:依地區分類,2022-2035年
- 北美洲
- 美國
- 加拿大
- 歐洲
- 德國
- 義大利
- 波蘭
- 荷蘭
- 奧地利
- 英國
- 法國
- 亞太地區
- 中國
- 澳洲
- 印度
- 日本
- 韓國
- 中東和非洲
- 以色列
- 沙烏地阿拉伯
- 阿拉伯聯合大公國
- 南非
- 拉丁美洲
- 巴西
- 墨西哥
- 智利
第12章:公司簡介
- Altenergy Power System
- Canadian Solar
- Darfon Electronics
- Delta Electronics
- Eaton
- Enphase Energy
- Fimer Group
- Fronius International
- General Electric
- Ginlong Technologies
- GoodWe
- Growatt New Energy
- Hitachi Hi-Rel Power Electronics
- Huawei Technologies
- Panasonic Corporation
- Schneider Electric
- SHENZHEN Sofarsolar
- Siemens
- SMA Solar Technology
- Sineng Electric
- SolarEdge Technologies
- Sungrow
- Tabuchi Electric
- TMEIC
The Global PV Inverter Market was valued at USD 48.3 billion in 2025 and is estimated to grow at a 7.2% CAGR to reach USD 90.2 billion by 2035.
Market growth is supported by accelerating solar PV deployments across utility-scale parks, commercial rooftops, and residential systems that require high-efficiency conversion, tight grid synchronization, and increasingly smart grid-support functionality. As solar penetration increases, inverters are no longer viewed as simple conversion hardware; they are becoming the control layer for modern PV systems, managing voltage and frequency behavior, improving power quality, enabling remote diagnostics, and increasingly supporting hybrid configurations that combine PV with energy storage. This shift is pushing customers to prioritize long-term reliability, compliance, and lifecycle performance, not just upfront pricing, especially where grid codes and safety requirements continue to tighten.
| Market Scope | |
|---|---|
| Start Year | 2025 |
| Forecast Year | 2026-2035 |
| Start Value | $48.3 Billion |
| Forecast Value | $90.2 Billion |
| CAGR | 7.2% |
A major growth pillar is the rapid movement toward digitalization and IoT-enabled monitoring, where developers and asset owners want real-time visibility of inverter performance, predictive maintenance triggers, and faster troubleshooting to minimize downtime and maximize yields. In parallel, the market is benefiting from the rise of hybrid solar and storage systems as businesses and households seek resilience and better energy economics through backup power, peak shaving, and improved self-consumption. These trends are encouraging manufacturers to deliver inverters with stronger grid-forming / grid-support capabilities, improved communication protocols, and software-driven optimization, turning the inverter into a grid-interactive device that helps stabilize networks under high renewable penetration.
The string inverters segment held 53.7% share in 2025, as they remain the workhorse for cost-effective deployments in residential and smaller commercial installations while also scaling into larger rooftop and distributed projects with improved power ratings, multi-MPPT designs, and enhanced safety and monitoring features. String inverters continue to attract buyers looking for a strong balance of efficiency, system design flexibility, and manageable maintenance in markets where rooftops are expanding, and developers want designs that optimize BOS costs without sacrificing performance.
The three-phase segment captured 83.2% share in 2025 and is projected to grow at a CAGR of 7.5% between 2026 and 2035. The expanding deployment of commercial, industrial, and multi-unit residential solar installations is driving the adoption of three-phase PV inverters, as these systems demand balanced power distribution, higher efficiency, and stable grid performance to handle larger loads and sustained energy consumption. Additionally, stricter grid-code compliance and rising power-quality standards are boosting the demand for multi-phase inverters, which provide enhanced voltage regulation, reduced harmonic distortion, and improved frequency stability, enabling smooth integration of distributed solar generation into regional transmission and distribution networks.
U.S. PV Inverter Market held 98.8% share in 2025 and is projected to generate USD 9 billion by 2035. Rapid growth of utility-scale and distributed solar installations across the country is fueling PV inverter adoption, as federal tax credits, state-level renewable energy targets, and extensive project pipelines drive demand for efficient, grid-compliant power conversion solutions across residential, commercial, and utility solar sectors. The presence of major industry players and their continued initiatives to introduce advanced product portfolios in the region are further expected to support sustained market expansion.
Key players involved in the Global PV Inverter Market include Huawei Technologies, Sungrow Power Supply, Ginlong Solis, Growatt, Enphase Energy, SolarEdge Technologies, SMA Solar Technology, GoodWe, Delta Electronics, Siemens, Schneider Electric, TMEIC, GE Vernova, Fronius International, Canadian Solar, Altenergy Power System (APsystems), Eaton, Panasonic, SINENG, Hitachi Hi-Rel Power Electronics, DARFON, MA Solar Italy, SOFARSOLAR, TABUCHI ELECTRIC. Companies are strengthening their foothold by pushing technology differentiation, grid-support inverters with reactive power control, voltage regulation, and advanced compliance features that make approvals smoother and performance more bankable. They are investing heavily in digital platforms (cloud monitoring, remote diagnostics, predictive maintenance) to reduce downtime and create recurring revenue through subscriptions, extended warranties, and lifecycle services. Another common strategy is expanding hybrid and storage-ready inverter portfolios to capture the fast-growing solar-plus-storage demand across residential and C&I sites.
Table of Contents
Chapter 1 Methodology & Scope
- 1.1 Research design
- 1.2 Quality commitment
- 1.2.1 GMI AI policy & data integrity commitment
- 1.2.1.1 Source consistency protocol
- 1.2.1 GMI AI policy & data integrity commitment
- 1.3 Research Trail & Confidence Scoring
- 1.3.1 Research Trail Components
- 1.3.2 Scoring Components
- 1.4 Data Collection
- 1.4.1 Partial list of primary sources
- 1.5 Data mining sources
- 1.5.1 Paid sources
- 1.5.1.1 Sources, by region
- 1.5.1 Paid sources
- 1.6 Base estimates and calculations
- 1.6.1 Base year calculation for any one approach
- 1.7 Forecast model
- 1.8 Research transparency addendum
- 1.8.1 Source attribution framework
- 1.8.2 Quality assurance metrics
- 1.8.3 Our commitment to trust
- 1.9 Market definitions
Chapter 2 Executive Summary
- 2.1 Industry synopsis, 2022 - 2035
- 2.2 Business trends
- 2.3 Product trends
- 2.4 Phase trends
- 2.5 Connectivity trends
- 2.6 Nominal Output Power trends
- 2.7 Nominal Output Voltage trends
- 2.8 Application trends
- 2.9 Regional trends
Chapter 3 Industry Insights
- 3.1 Industry ecosystem
- 3.1.1 Raw material availability & sourcing analysis
- 3.1.2 Manufacturing capacity assessment
- 3.1.3 Supply chain resilience & risk factors
- 3.1.4 Distribution network analysis
- 3.2 Regulatory landscape
- 3.3 Industry impact forces
- 3.3.1 Growth drivers
- 3.3.2 Industry pitfalls & challenges
- 3.4 Growth potential analysis
- 3.5 Cost structure analysis
- 3.6 Price trend analysis (USD/MW)
- 3.6.1 By product
- 3.7 Porter's analysis
- 3.7.1 Bargaining power of suppliers
- 3.7.2 Bargaining power of buyers
- 3.7.3 Threat of new entrants
- 3.7.4 Threat of substitutes
- 3.8 PESTEL analysis
- 3.8.1 Political factors
- 3.8.2 Economic factors
- 3.8.3 Social factors
- 3.8.4 Technological factors
- 3.8.5 Legal factors
- 3.8.6 Environmental factors
- 3.9 Technology & innovation landscape
- 3.9.1 Maximum power point tracking (MPPT) advancements
- 3.9.2 AI-powered & smart inverter technologies
- 3.9.3 Hybrid inverter integration
- 3.10 Investment & funding analysis
- 3.10.1 Venture capital & private equity investments
- 3.10.2 Government incentives & subsidies impact
- 3.10.3 R&D investment trends by leading players
Chapter 4 Competitive landscape, 2026
- 4.1 Introduction
- 4.2 Company market share analysis, by region, 2025
- 4.2.1 North America
- 4.2.2 Europe
- 4.2.3 Asia Pacific
- 4.2.4 Latin America
- 4.2.5 Middle East & Africa
- 4.3 Strategic dashboard
- 4.4 Strategic initiatives
- 4.5 Company benchmarking
- 4.6 Innovation & technology landscape
Chapter 5 Market Size and Forecast, By Product, 2022 - 2035 (USD Billion & MW)
- 5.1 Key trends
- 5.2 String
- 5.3 Micro
- 5.4 Central
Chapter 6 Market Size and Forecast, By Phase, 2022 - 2035 (USD Billion & MW)
- 6.1 Key trends
- 6.2 Single phase
- 6.3 Three phase
Chapter 7 Market Size and Forecast, By Connectivity, 2022 - 2035 (USD Billion & MW)
- 7.1 Key trends
- 7.2 Standalone
- 7.3 On grid
Chapter 8 Market Size and Forecast, By Nominal Output Power, 2022 - 2035 (USD Billion & MW)
- 8.1 Key trends
- 8.2 ≤ 0.5 kW
- 8.3 0.5 - 3 kW
- 8.4 3 - 33 kW
- 8.5 33 - 110 kW
- 8.6 > 110 kW
Chapter 9 Market Size and Forecast, By Nominal Output Voltage, 2022 - 2035 (USD Billion & MW)
- 9.1 Key trends
- 9.2 ≤ 230 V
- 9.3 230 - 400 V
- 9.4 400 - 600 V
- 9.5 > 600 V
Chapter 10 Market Size and Forecast, By Application, 2022 - 2035 (USD Billion & MW)
- 10.1 Key trends
- 10.2 Residential
- 10.3 Commercial & industrial
- 10.4 Utility
Chapter 11 Market Size and Forecast, By Region, 2022 - 2035 (USD Billion & MW)
- 11.1 Key trends
- 11.2 North America
- 11.2.1 U.S.
- 11.2.2 Canada
- 11.3 Europe
- 11.3.1 Germany
- 11.3.2 Italy
- 11.3.3 Poland
- 11.3.4 Netherlands
- 11.3.5 Austria
- 11.3.6 UK
- 11.3.7 France
- 11.4 Asia Pacific
- 11.4.1 China
- 11.4.2 Australia
- 11.4.3 India
- 11.4.4 Japan
- 11.4.5 South Korea
- 11.5 Middle East & Africa
- 11.5.1 Israel
- 11.5.2 Saudi Arabia
- 11.5.3 UAE
- 11.5.4 South Africa
- 11.6 Latin America
- 11.6.1 Brazil
- 11.6.2 Mexico
- 11.6.3 Chile
Chapter 12 Company Profiles
- 12.1 Altenergy Power System
- 12.2 Canadian Solar
- 12.3 Darfon Electronics
- 12.4 Delta Electronics
- 12.5 Eaton
- 12.6 Enphase Energy
- 12.7 Fimer Group
- 12.8 Fronius International
- 12.9 General Electric
- 12.10 Ginlong Technologies
- 12.11 GoodWe
- 12.12 Growatt New Energy
- 12.13 Hitachi Hi-Rel Power Electronics
- 12.14 Huawei Technologies
- 12.15 Panasonic Corporation
- 12.16 Schneider Electric
- 12.17 SHENZHEN Sofarsolar
- 12.18 Siemens
- 12.19 SMA Solar Technology
- 12.20 Sineng Electric
- 12.21 SolarEdge Technologies
- 12.22 Sungrow
- 12.23 Tabuchi Electric
- 12.24 TMEIC
 太陽能逆變器市場:2026-2032年全球市場預測(依逆變器類型、相數、額定輸出、系統類型、輸出電壓、應用、安裝方式及銷售管道)太陽能逆變器測試解決方案市場:按應用、逆變器類型、輸出額定值和測試類型分類,全球預測(2026-2032年)
 太陽能逆變器:市場佔有率分析、產業趨勢與統計、成長預測(2026-2031)
 2026-2034年全球商用和工業用太陽能逆變器市場規模、佔有率、趨勢和成長分析報告2026-2034年全球獨立式太陽能逆變器市場規模、佔有率、趨勢和成長分析報告全球太陽能微型逆變器市場規模、佔有率、趨勢和成長分析報告(2026-2034年)全球太陽能逆變器市場規模、佔有率、趨勢和成長分析報告(2026-2034)
 日本太陽能逆變器市場規模、佔有率、趨勢和預測:按逆變器類型、應用和地區分類,2026-2034年
 2026年全球住宅太陽能逆變器市場報告2026年全球太陽能逆變器市場報告