


 |
市場調查報告書
商品編碼
1959634
風力發電機變槳及偏航驅動裝置市場機會、成長要素、產業趨勢分析及2026年至2035年預測Wind Turbine Pitch and Yaw Drive Market Opportunity, Growth Drivers, Industry Trend Analysis, and Forecast 2026 - 2035 |
||||||
2025 年全球風力發電機變槳偏航驅動裝置市場價值為 71 億美元,預計到 2035 年將達到 123 億美元,年複合成長率為 5.5%。
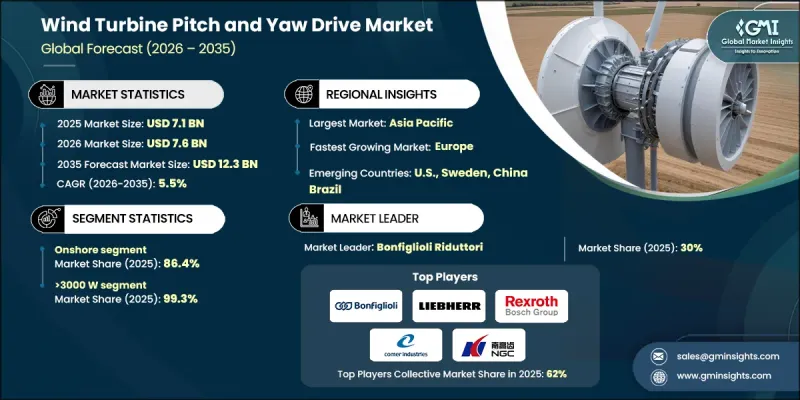
這一市場前景與這些系統在風力發電機的性能和安全方面發揮的關鍵作用密切相關。變槳驅動系統用於根據風速變化調整葉片角度,使渦輪機能夠高效運作,同時防止過大的機械載荷,並在必要時實現受控停機。偏航驅動系統確保渦輪機保持相對於風流的正確方向,從而支持穩定的能量輸出並減少結構疲勞。全球對可再生能源普及和排放目標的日益重視,持續增強了市場發展動能。風能仍然是最具成本效益的可再生能源解決方案之一,渦輪機效率、耐久性和自動化水平的不斷提高,進一步鞏固了其長期應用前景。材料、控制技術和製造精度的進步,正在進一步提高系統的可靠性和成本效益,從而推動全球對風力發電設施的持續需求。
| 市場範圍 | |
|---|---|
| 開始年份 | 2025 |
| 預測年份 | 2026-2035 |
| 起始值 | 71億美元 |
| 預測金額 | 123億美元 |
| 複合年成長率 | 5.5% |
預計到2025年,陸上安裝市場將佔全球市場佔有率的86.4%,並在2026年至2035年間以4.5%的複合年成長率成長。這一主導地位得益於低廉的安裝和維護成本、成熟的供應鏈網路以及可擴展的生產能力。葉片長度和塔筒高度不斷增加的大型風力發電機組的持續發展,提高了能源捕獲效率,同時,市場對能夠承受高負載並確保長使用壽命的堅固耐用的俯仰-偏航系統的需求也日益成長。
預計到2035年,1000瓦至3000瓦容量段的複合年成長率將達到9%。這一成長主要受以下因素驅動:老舊風力發電機系統的更新換代、對電網和安裝空間受限地區的適應性提升,以及發展中市場對該類產品的日益青睞。此類系統通常採用主動式俯仰偏航機構,並依賴成熟的技術平台和可靠的供應鏈,從而實現經濟高效的部署。
預計到2025年,北美風力發電機變槳偏航驅動裝置市場的佔有率將達到14.8%。該地區市場受益於持續的技術研發和創新,這些研發和創新旨在提高渦輪機效率並擴大部署範圍。加拿大雖然在該地區規模較小,但其市場佔有率正在穩步成長。
目錄
第1章:調查方法和範圍
第2章執行摘要
第3章業界考察
- 產業生態系統
- 原物料供應及採購分析
- 製造能力評估
- 供應鏈韌性與風險因素
- 配電網路分析
- 監管環境
- 影響產業的因素
- 促進因素
- 產業潛在風險與挑戰
- 成長潛力分析
- 價格趨勢分析
- 按類型
- 按地區
- 成本結構分析
- 波特五力分析
- PESTEL 分析
- 新興機會和趨勢
- 數位化和物聯網整合
- 進入新興市場
- 投資分析及未來展望
第4章 競爭情勢
- 介紹
- 企業市佔率分析
- 北美洲
- 歐洲
- 亞太地區
- 中東和非洲
- 拉丁美洲
- 戰略儀錶板
- 策略舉措
- 創新與科技趨勢
第5章 市場規模及預測:依最終用途分類,2022-2035年
- 陸上
- 離岸
第6章 市場規模及預測:依類型分類,2022-2035年
- 小於1000瓦
- 1000 W~3000 W
- 超過3000瓦
第7章 市場規模及預測:依音調系統分類,2022-2035年
- 電的
- 機械的
- 油壓
第8章 市場規模及預測:依葉片長度分類,2022-2035年
- 小型
- 中號
- 大的
第9章 市場規模及預測:依地區分類,2022-2035年
- 北美洲
- 美國
- 加拿大
- 墨西哥
- 歐洲
- 德國
- 西班牙
- 英國
- 法國
- 義大利
- 瑞典
- 波蘭
- 丹麥
- 葡萄牙
- 荷蘭
- 愛爾蘭
- 比利時
- 亞太地區
- 中國
- 印度
- 澳洲
- 日本
- 韓國
- 越南
- 泰國
- 菲律賓
- 台灣
- 中東和非洲
- 南非
- 埃及
- 拉丁美洲
- 巴西
- 智利
- 阿根廷
第10章:公司簡介
- ABB
- ABM Greiffenberger
- Bosch Rexroth AG
- Bonfiglioli SpA
- Comer Industries
- Dana SAC UK
- General Electric
- Goldwind Science and Technologies
- KEBA
- Liebherr
- Mitsubishi Heavy Industries
- Nabtesco Corporation
- Nanjing High Speed Gear Manufacturing
- Nidec Conversion
- Nordex
- SIPCO-MLS
- Siemens Gamesa Renewable Energy
- Schaeffler Group
- Vestas Wind Systems
- ZOLLERN GmbH
The Global Wind Turbine Pitch and Yaw Drive Market was valued at USD 7.1 billion in 2025 and is estimated to grow at a CAGR of 5.5% to reach USD 12.3 billion by 2035.
The market outlook is tied to the critical role these systems play in wind turbine performance and safety. Pitch drive systems are used to adjust blade angles in response to changing wind speeds, allowing turbines to operate efficiently while preventing excessive mechanical loads and enabling controlled shutdowns when required. Yaw drive systems ensure that turbines remain properly oriented toward wind flow, supporting consistent energy output and reducing structural fatigue. Growing global commitment to renewable energy adoption and emission reduction targets continues to reinforce market momentum. Wind power remains one of the most cost-effective renewable solutions, and ongoing improvements in turbine efficiency, durability, and automation are strengthening long-term deployment prospects. Advancements in materials, control technologies, and manufacturing precision are further improving system reliability and cost efficiency, driving sustained demand across global wind installations.
| Market Scope | |
|---|---|
| Start Year | 2025 |
| Forecast Year | 2026-2035 |
| Start Value | $7.1 Billion |
| Forecast Value | $12.3 Billion |
| CAGR | 5.5% |
The onshore installations segment accounted for 86.4% share in 2025 and is expected to grow at a CAGR of 4.5% from 2026 to 2035. This dominance is supported by lower installation and servicing expenses, established supply networks, and scalable production capabilities. Continued development of larger turbines with extended blade lengths and increased tower heights has improved energy capture, driving the need for robust pitch and yaw systems capable of handling higher loads and ensuring long operational lifespans.
The 1000 W to 3000 W capacity segment is projected to grow at a CAGR of 9% through 2035. Growth in this range is linked to the modernization of aging turbine fleets, suitability for regions with grid or space limitations, and increasing deployment across developing markets. Systems within this category commonly utilize active pitch and yaw mechanisms supported by mature technology platforms and proven supply chains, supporting cost-effective adoption.
North America Wind Turbine Pitch and Yaw Drive Market accounted for 14.8% share in 2025. The regional market benefits from ongoing technological research and innovation aimed at improving turbine efficiency and expanding deployment feasibility. Canada represents a smaller yet steadily expanding contributor within the regional landscape.
Key companies operating in the Global Wind Turbine Pitch and Yaw Drive Market include Siemens Gamesa Renewable Energy, Vestas Wind Systems, General Electric, ABB, Bosch Rexroth, Bonfiglioli, Schaeffler Group, Nordex, Nidec Conversion, Mitsubishi Heavy Industries, Liebherr, Goldwind Science and Technologies, ZOLLERN GmbH, Dana SAC UK, Nabtesco Corporation, KEBA, Comer Industries, ABM Greiffenberger, SIPCO-MLS, and Nanjing High Speed Gear Manufacturing. Companies in the wind turbine pitch and yaw drive market are strengthening their competitive positions through continuous innovation and system optimization. Many players are investing in advanced control technologies and durable materials to enhance performance and reduce lifecycle costs. Strategic partnerships with turbine manufacturers and energy developers are being used to secure long-term supply agreements. Firms are also expanding manufacturing footprints and local service capabilities to improve responsiveness and cost efficiency.
Table of Contents
Chapter 1 Methodology & Scope
- 1.1 Research design
- 1.1.1 Research approach
- 1.1.2 Data collection methods
- 1.2 Base estimates and calculations
- 1.2.1 Base year calculation
- 1.2.2 Key trends for market estimates
- 1.3 Forecast model
- 1.3.1 Key trends for market estimates
- 1.3.1.1 Quantified market impact analysis
- 1.3.1.2 Mathematical impact of growth parameters on forecast
- 1.3.2 Scenario analysis framework
- 1.3.1 Key trends for market estimates
- 1.4 Primary research and validation
- 1.4.1 Some of the primary sources (but not limited to)
- 1.5 Data mining sources
- 1.5.1 Paid Sources
- 1.5.2 Sources, by region
- 1.6 Research trail & scoring components
- 1.6.1 Research trail components
- 1.6.2 Scoring components
- 1.7 Research transparency addendum
- 1.7.1 Source attribution framework
- 1.7.2 Quality assurance metrics
- 1.7.3 Our commitment to trust
- 1.8 Market definitions
Chapter 2 Executive Summary
- 2.1 Industry 360-degree synopsis, 2022 - 2035
- 2.2 Business trends
- 2.3 End Use trends
- 2.4 Type trends
- 2.5 Pitch System trends
- 2.6 Blade Length trends
- 2.7 Regional trends
Chapter 3 Industry Insights
- 3.1 Industry ecosystem
- 3.1.1 Raw material availability & sourcing analysis
- 3.1.2 Manufacturing capacity assessment
- 3.1.3 Supply chain resilience & risk factors
- 3.1.4 Distribution network analysis
- 3.2 Regulatory landscape
- 3.3 Industry impact forces
- 3.3.1 Growth drivers
- 3.3.2 Industry pitfalls & challenges
- 3.4 Growth potential analysis
- 3.5 Price trend analysis
- 3.5.1 By type
- 3.5.2 By region
- 3.6 Cost structure analysis
- 3.7 Porter's analysis
- 3.7.1 Bargaining power of suppliers
- 3.7.2 Bargaining power of buyers
- 3.7.3 Threat of new entrants
- 3.7.4 Threat of substitutes
- 3.8 PESTEL analysis
- 3.8.1 Political factors
- 3.8.2 Economic factors
- 3.8.3 Social factors
- 3.8.4 Technological factors
- 3.8.5 Legal factors
- 3.8.6 Environmental factors
- 3.9 Emerging opportunities & trends
- 3.9.1 Digitalization & IoT integration
- 3.9.2 Emerging market penetration
- 3.10 Investment analysis and future outlook
Chapter 4 Competitive landscape, 2026
- 4.1 Introduction
- 4.2 Company market share analysis, 2025
- 4.2.1 North America
- 4.2.2 Europe
- 4.2.3 Asia Pacific
- 4.2.4 Middle East & Africa
- 4.2.5 Latin America
- 4.3 Strategic dashboard
- 4.4 Strategic initiatives
- 4.5 Innovation & technology landscape
Chapter 5 Market Size and Forecast, By End Use, 2022 - 2035 (USD Million & MW)
- 5.1 Key trends
- 5.2 Onshore
- 5.3 Offshore
Chapter 6 Market Size and Forecast, By Type, 2022 - 2035 (USD Million & MW)
- 6.1 Key trends
- 6.2 <1000 W
- 6.3 1000 W - 3000 W
- 6.4 >3000 W
Chapter 7 Market Size and Forecast, By Pitch System, 2022 - 2035 (USD Million & MW)
- 7.1 Key trends
- 7.2 Electric
- 7.3 Mechanical
- 7.4 Hydraulic
Chapter 8 Market Size and Forecast, By Blade Length, 2022 - 2035 (USD Million & MW)
- 8.1 Key trends
- 8.2 Small
- 8.3 Medium
- 8.4 Large
Chapter 9 Market Size and Forecast, By Region, 2022 - 2035 (USD Million)
- 9.1 Key trends
- 9.2 North America
- 9.2.1 U.S.
- 9.2.2 Canada
- 9.2.3 Mexico
- 9.3 Europe
- 9.3.1 Germany
- 9.3.2 Spain
- 9.3.3 UK
- 9.3.4 France
- 9.3.5 Italy
- 9.3.6 Sweden
- 9.3.7 Poland
- 9.3.8 Denmark
- 9.3.9 Portugal
- 9.3.10 Netherlands
- 9.3.11 Ireland
- 9.3.12 Belgium
- 9.4 Asia Pacific
- 9.4.1 China
- 9.4.2 India
- 9.4.3 Australia
- 9.4.4 Japan
- 9.4.5 South Korea
- 9.4.6 Vietnam
- 9.4.7 Thailand
- 9.4.8 Philippines
- 9.4.9 Taiwan
- 9.5 Middle East & Africa
- 9.5.1 South Africa
- 9.5.2 Egypt
- 9.6 Latin America
- 9.6.1 Brazil
- 9.6.2 Chile
- 9.6.3 Argentina
Chapter 10 Company Profiles
- 10.1 ABB
- 10.2 ABM Greiffenberger
- 10.3 Bosch Rexroth AG
- 10.4 Bonfiglioli S.p.A
- 10.5 Comer Industries
- 10.6 Dana SAC UK
- 10.7 General Electric
- 10.8 Goldwind Science and Technologies
- 10.9 KEBA
- 10.10 Liebherr
- 10.11 Mitsubishi Heavy Industries
- 10.12 Nabtesco Corporation
- 10.13 Nanjing High Speed Gear Manufacturing
- 10.14 Nidec Conversion
- 10.15 Nordex
- 10.16 SIPCO-MLS
- 10.17 Siemens Gamesa Renewable Energy
- 10.18 Schaeffler Group
- 10.19 Vestas Wind Systems
- 10.20 ZOLLERN GmbH
 風力發電機軸承市場:按軸承類型、安裝位置、材質、渦輪機類型和最終用戶分類,全球預測,2026-2032年風力發電機鑄件市場:依鑄造類型、材質、製造流程、產能範圍、渦輪機類型、加工狀態、最終用途分類,全球預測(2026-2032年)風力發電機齒輪油市場:按產品類型、渦輪機類型、功能、添加劑、應用和最終用戶分類-2026-2032年全球預測
 2026-2030年全球風力發電機零件市場
 2026年全球風力發電機鑄件市場報告風力發電機梯架市場:依產品類型、材料、通路和最終用戶分類,全球預測(2026-2032年)
 風力發電機零件市場規模、佔有率、趨勢和預測:按零件、風力發電機類型、風力發電廠類型和地區分類,2026-2034年風力發電機電刷架市場:依發電機類型、銷售管道、電刷材料、安裝類型、最終用途分類,全球預測(2026-2032年)2026年全球風力水泵市場報告
 風力發電機變槳系統市場規模、佔有率和成長分析(按產品類型、應用、組件、容量和地區分類)-2026-2033年產業預測