


 |
市場調查報告書
商品編碼
1959620
顆粒物監測市場機會、成長要素、產業趨勢分析及2026年至2035年預測Particulate Matter Monitoring Market Opportunity, Growth Drivers, Industry Trend Analysis, and Forecast 2026 - 2035 |
||||||
2025 年全球粒狀物監測市場價值 18 億美元,預計到 2035 年將達到 49 億美元,年複合成長率為 10.5%。
該市場專注於檢測空氣中的固體顆粒和液滴(灰塵、煙塵、煙霧等),特別是PM2.5和PM10的濃度,以評估空氣品質。包括高精度參考站、具備即時連接的攜帶式人工智慧感測器以及基於物聯網的設備在內的先進監測解決方案,正擴大部署於室內外環境。這些系統對於公共衛生風險評估、法規遵循和污染控制措施至關重要。全球都市化和工業化,以及日益嚴格的空氣品質法規,正在推動對精確PM監測的需求。各國政府和環保機構正在大力投資監測基礎設施和分析平台,以提供可靠的數據用於政策制定、城市規劃和公共衛生保護。技術進步和監管壓力的協同作用正在加速PM監測系統的全球部署。
| 市場範圍 | |
|---|---|
| 開始年份 | 2025 |
| 預測年份 | 2026-2035 |
| 起始值 | 18億美元 |
| 預測金額 | 49億美元 |
| 複合年成長率 | 10.5% |
預計到2035年,光學粒子計數器(OPC)/雷射散射技術市場將以11.2%的複合年成長率成長,目前佔據市場主導地位。其主導地位源自於其高測量精度、即時監測能力以及檢測多種粒徑顆粒的能力。這些系統被廣泛用於追蹤空氣品質和排放,並確保符合相關法規。雷射散射和OPC技術的不斷進步正在創造新的機遇,例如提高感測器靈敏度、增強校準穩定性以及使用更少的設備進行全面的數據分析。製造商正致力於這些改進,以滿足工業、城市和室內應用領域對精準高效監控解決方案日益成長的需求。
預計到2025年,PM2.5(粒徑小於或等於2.5微米)市場規模將達到8.396億美元,佔據顆粒物監測市場最大佔有率。 PM2.5暴露與呼吸系統疾病和心血管疾病等健康風險之間存在密切關聯,這支撐了其市場主導地位。人們對PM2.5數據的認知不斷提高,以及其在公共衛生政策、城市規劃和污染減排計畫中的應用,都推動了對監測系統的需求。製造商正優先開發緊湊、低維護的PM2.5設備,並將其整合到數位空氣品質網路中,以支援法規遵從,並擴大其在工業、城市和室內環境中的應用。
美國粒狀物監測市場預計2025年將達到7.193億美元。該地區持續引領產業發展,主要得益於公眾健康、都市區建設等措施的日益重視。聯邦政府對空氣品質基礎設施的大力投資、嚴格的環境法規以及主要產業參與者的存在,共同鞏固了北美市場的主導地位。美國製造商正利用技術創新、與政府機構的合作以及基於雲端的分析技術,開發擴充性、精準且實用的顆粒物監測解決方案,從而提高監測效率和系統互通性。
目錄
第1章:調查方法和範圍
第2章執行摘要
第3章業界考察
- 生態系分析
- 供應商情況
- 利潤率
- 成本結構
- 每個階段增加的價值
- 影響價值鏈的因素
- 中斷
- 影響產業的因素
- 促進因素
- 加強政府有關空氣品質監測的法規和標準
- 監測大氣環境變得越來越重要。
- 汽車和交通運輸行業對顆粒物水平的要求不斷提高。
- 人們對顆粒物相關健康風險的認知不斷提高
- PM監測系統的持續進步
- 產業潛在風險與挑戰
- PM監測設備的安裝和維護可能具有挑戰性。
- 發展中國家PM監測解決方案實施的延誤
- 市場機遇
- 智慧城市和數位環境基礎設施的擴展
- 對室內空氣品質監測的需求不斷成長
- 促進因素
- 成長潛力分析
- 監管環境
- 北美洲
- 歐洲
- 亞太地區
- 拉丁美洲
- 中東和非洲
- 波特的分析
- PESTEL 分析
- 科技與創新趨勢
- 當前技術趨勢
- 新興技術
- 價格趨勢
- 歷史價格分析(2022-2024)
- 影響價格趨勢的因素
- 區域價格差異
- 價格預測(2026-2035)
- 定價策略
- 新興經營模式
- 合規要求
第4章 競爭情勢
- 介紹
- 企業市佔率分析
- 按地區
- 北美洲
- 歐洲
- 亞太地區
- 拉丁美洲
- 中東和非洲
- 市場集中度分析
- 按地區
- 主要企業的競爭標竿分析
- 財務績效比較
- 收入
- 利潤率
- 研究與開發
- 產品系列比較
- 產品線的廣度
- 科技
- 創新
- 地理位置比較
- 全球擴張分析
- 服務網路覆蓋
- 按地區分類的市場滲透率
- 競爭定位矩陣
- 領導企業
- 受讓人
- 追蹤者
- 小眾玩家
- 戰略展望矩陣
- 財務績效比較
- 2022-2025 年重大發展
- 併購
- 夥伴關係與合作
- 技術進步
- 擴張和投資策略
- 永續發展計劃
- 數位轉型計劃
- 新興/Start-Ups競爭對手的發展趨勢
第5章:顆粒物監測市場估計與預測:依監測技術分類,2022-2035年
- ,
- 硬體
- 重量檢測法
- BETA衰減監測器(BAM)
- 錐形元件振動微天平(TEOM)
- 光學粒子計數器(OPC)/雷射散射法
- 專業/參考級 OPC
- 低成本光學感測器
- 濁度計
第6章 市場估計與預測:依粒狀物粒徑分類,2022-2035年
- PM2.5(2.5微米或更小)
- PM10(小於10微米)
- PM1(小於1微米)
第7章 市場估算與預測:依產品類型分類的市場規模,2022-2035年
- 室外環境監測系統
- 固定式環境監測站
- 攜帶式/移動式戶外顯示器
- 圍籬線/邊界線監測器
- 移動平台安裝式感應器
- 室內環境監測系統
- 適用於一般建築物的室內空氣品質監測器
- 潔淨室和受控環境用粒子計數器
- 工業室內顯示器
- 暖通空調整合監控系統
- 個人暴露監測器
第8章 市場估計與預測:依應用領域分類,2022-2035年
- 監管合規性和空氣品質監測
- 職業健康與職場安全
- 工業製程和排放監測
- 建築物和設施的室內空氣品質管理
- 個體接觸評估和流行病學調查
- 其他
第9章 市場估計與預測:依最終用戶產業分類,2022-2035年
- 政府和監管機構
- 發電
- 化學/石油化學製造
- 金屬和採礦
- 醫學與生命科學
- 半導體和電子設備製造
- 農業/食品加工
- 其他
第10章:顆粒物監測市場估計與預測:按地區分類,2022-2035年
- 按地區
- 北美洲
- 美國
- 加拿大
- 歐洲
- 英國
- 德國
- 法國
- 義大利
- 西班牙
- 荷蘭
- 其他歐洲地區
- 亞太地區
- 中國
- 印度
- 日本
- 韓國
- 澳洲
- 亞太其他地區
- 拉丁美洲
- 巴西
- 墨西哥
- 阿根廷
- 其他拉丁美洲地區
- 中東和非洲
- 沙烏地阿拉伯
- 南非
- 阿拉伯聯合大公國
- 其他中東和非洲地區
第11章:公司簡介
- 3M Company
- ACOEM Group
- Aeroqual Group Limited
- AMETEK, Inc.
- Beckman Coulter, Inc.
- Ecotech Pty Ltd
- Enviro Technology Services plc
- GrayWolf Sensing Solutions
- Honeywell International Inc.
- Horiba Ltd.
- Kanomax USA, Inc.
- Met One Instruments, Inc.
- Opsis AB
- Palas GmbH
- PCE Instruments
- Rupprecht &Patashnick Co., Inc.(R&P)
- Siemens AG
- terra
- Thermo Fisher Scientific, Inc.
- TSI Incorporated
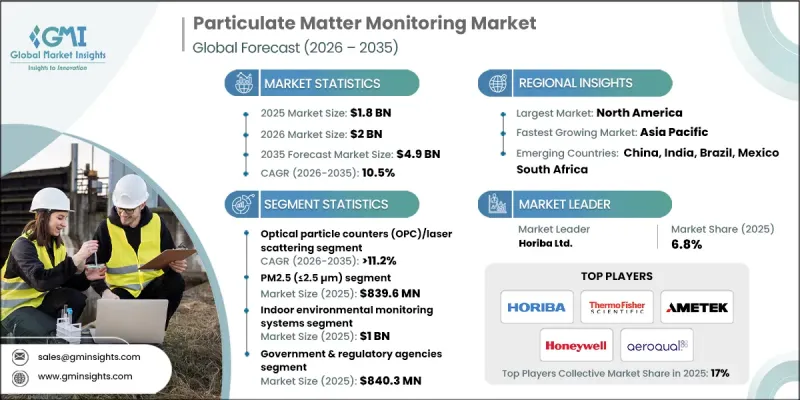
The Global Particulate Matter Monitoring Market was valued at USD 1.8 billion in 2025 and is estimated to grow at a CAGR of 10.5% to reach USD 4.9 billion by 2035.
The market focuses on detecting suspended solid particles and liquid droplets in the air, including dust, soot, and smoke, with particular attention to PM2.5 and PM10 levels to assess air quality. Advanced monitoring solutions, including high-precision reference stations, portable AI-enabled sensors with real-time connectivity, and IoT-based devices, are increasingly deployed in indoor and outdoor environments. These systems are critical for public health risk evaluation, regulatory compliance, and pollution management initiatives. Rising global urbanization, industrialization, and stricter air quality regulations are fueling demand for accurate PM monitoring. Governments and environmental agencies are investing heavily in monitoring infrastructure and analytics platforms to provide reliable data for policymaking, urban planning, and public health protection. The combination of technological advancements and regulatory pressure is driving faster adoption of PM monitoring systems worldwide.
| Market Scope | |
|---|---|
| Start Year | 2025 |
| Forecast Year | 2026-2035 |
| Start Value | $1.8 Billion |
| Forecast Value | $4.9 Billion |
| CAGR | 10.5% |
The optical particle counter (OPC)/laser scattering segment is projected to grow at 11.2% CAGR through 2035 and currently dominates the market. Its prominence stems from its high measurement accuracy, real-time monitoring capability, and ability to detect a wide range of particle sizes. These systems are extensively used to track ambient air quality, emissions, and ensure regulatory compliance. The ongoing advancement of laser scattering and OPC technology is creating new opportunities by enhancing sensor sensitivity, improving calibration stability, and enabling more comprehensive data analysis from fewer devices. Manufacturers are focusing on these improvements to meet the rising demand for precise and efficient monitoring solutions in industrial, urban, and indoor applications.
The PM2.5 (<=2.5 µm) segment accounted for USD 839.6 million in 2025 and holds the largest share of the particulate matter monitoring market. This dominance is driven by the strong link between PM2.5 exposure and health risks such as respiratory and cardiovascular diseases. Increasing awareness, public health initiatives, and the use of PM2.5 data in urban planning and pollution reduction programs are fueling demand for monitoring systems. Manufacturers are prioritizing the development of compact, low-maintenance PM2.5 devices, with integration into digital air quality networks to support regulatory compliance and broaden adoption across industrial, urban, and indoor environments.
U.S. Particulate Matter Monitoring Market reached USD 719.3 million in 2025. The region continues to lead the industry due to heightened focus on public health, urban air pollution mitigation, and smart city programs. Strong federal investments in air quality infrastructure, stringent environmental regulations, and the presence of major industry players contribute to North America's dominant market position. Manufacturers in the U.S. are emphasizing scalable, accurate, and actionable PM monitoring solutions, leveraging technological innovations, partnerships with governmental organizations, and cloud-based analytics to improve monitoring efficiency and system interoperability.
Key players operating in the Global Particulate Matter Monitoring Market include Enviro Technology Services plc, ACOEM Group, Met One Instruments, Inc., 3M Company, GrayWolf Sensing Solutions, Thermo Fisher Scientific, Inc., Aeroqual Group Limited, Siemens AG, Beckman Coulter, Inc., Rupprecht & Patashnick Co., Inc. (R&P), Palas GmbH, TSI Incorporated, Opsis AB, Kanomax USA, Inc., PCE Instruments, Horiba Ltd., AMETEK, Inc., Honeywell International Inc., Ecotech Pty Ltd, and Terra. Companies in the particulate matter monitoring market are pursuing several strategies to strengthen their market presence. They are investing heavily in R&D to enhance sensor sensitivity, reduce maintenance requirements, and integrate AI and IoT capabilities. Strategic partnerships with governments, municipalities, and environmental agencies help secure long-term contracts and support infrastructure expansion. Firms are also focusing on product diversification, offering solutions for urban, industrial, and indoor monitoring.
Table of Contents
Chapter 1 Methodology and Scope
- 1.1 Market scope and definition
- 1.2 Research design
- 1.2.1 Research approach
- 1.2.2 Data collection methods
- 1.3 Data mining sources
- 1.3.1 Global
- 1.3.2 Regional/Country
- 1.4 Base estimates and calculations
- 1.4.1 Base year calculation
- 1.4.2 Key trends for market estimation
- 1.5 Primary research and validation
- 1.5.1 Primary sources
- 1.6 Forecast model
- 1.7 Research assumptions and limitations
Chapter 2 Executive Summary
- 2.1 Industry snapshot
- 2.2 Key market trends
- 2.2.1 Monitoring Technology trends
- 2.2.2 Particulate Matter Size trends
- 2.2.3 Product Type trends
- 2.2.4 Application trends
- 2.2.5 End-User Industry trends
- 2.2.6 Regional trends
- 2.3 TAM Analysis, 2026-2035 (USD Billion)
- 2.4 CXO perspectives: Strategic imperatives
- 2.4.1 Executive decision points
- 2.4.2 critical success factors
- 2.5 Future outlook and strategic recommendations
Chapter 3 Industry Insights
- 3.1 Industry ecosystem analysis
- 3.1.1 Supplier Landscape
- 3.1.2 Profit Margin
- 3.1.3 Cost structure
- 3.1.4 Value addition at each stage
- 3.1.5 Factor affecting the value chain
- 3.1.6 Disruptions
- 3.2 Industry impact forces
- 3.2.1 Growth drivers
- 3.2.1.1 Increasing government laws and standards for monitoring air quality
- 3.2.1.2 Monitoring of ambient air quality is becoming more important
- 3.2.1.3 Rising demand of particulate matter levels in automotive and transportation sectors
- 3.2.1.4 Increasing awareness about the health risks associated of particulate matter
- 3.2.1.5 Ongoing advancements in PM monitoring systems
- 3.2.2 Industry pitfalls and challenges
- 3.2.2.1 Installing and maintaining PM monitoring devices can be difficult
- 3.2.2.2 Delays in underdeveloped nations in implementing PM monitoring solutions
- 3.2.3 Market opportunities
- 3.2.3.1 Expansion of smart cities and digital environmental infrastructure
- 3.2.3.2 Growing demand for indoor air quality monitoring
- 3.2.1 Growth drivers
- 3.3 Growth potential analysis
- 3.4 Regulatory landscape
- 3.4.1 North America
- 3.4.2 Europe
- 3.4.3 Asia Pacific
- 3.4.4 Latin America
- 3.4.5 Middle East & Africa
- 3.5 Porter’s analysis
- 3.6 PESTEL analysis
- 3.7 Technology and innovation landscape
- 3.7.1 Current technological trends
- 3.7.2 Emerging technologies
- 3.8 Price trends
- 3.8.1 Historical price analysis (2022-2024)
- 3.8.2 Price trend drivers
- 3.8.3 Regional price variations
- 3.8.4 Price forecast (2026-2035)
- 3.9 Pricing strategies
- 3.10 Emerging business models
- 3.11 Compliance requirements
Chapter 4 Competitive Landscape, 2025
- 4.1 Introduction
- 4.2 Company market share analysis
- 4.2.1 By Region
- 4.2.1.1 North America
- 4.2.1.2 Europe
- 4.2.1.3 Asia Pacific
- 4.2.1.4 Latin America
- 4.2.1.5 Middle East & Africa
- 4.2.2 Market Concentration Analysis
- 4.2.1 By Region
- 4.3 Competitive benchmarking of key players
- 4.3.1 Financial performance comparison
- 4.3.1.1 Revenue
- 4.3.1.2 Profit margin
- 4.3.1.3 R&D
- 4.3.2 Product portfolio comparison
- 4.3.2.1 Product range breadth
- 4.3.2.2 Technology
- 4.3.2.3 Innovation
- 4.3.3 Geographic presence comparison
- 4.3.3.1 Global footprint analysis
- 4.3.3.2 Service network coverage
- 4.3.3.3 Market penetration by region
- 4.3.4 Competitive positioning matrix
- 4.3.4.1 Leaders
- 4.3.4.2 Challengers
- 4.3.4.3 Followers
- 4.3.4.4 Niche players
- 4.3.5 Strategic outlook matrix
- 4.3.1 Financial performance comparison
- 4.4 Key developments, 2022-2025
- 4.4.1 Mergers and acquisitions
- 4.4.2 Partnerships and collaborations
- 4.4.3 Technological advancements
- 4.4.4 Expansion and investment strategies
- 4.4.5 Sustainability initiatives
- 4.4.6 Digital transformation initiatives
- 4.5 Emerging/ startup competitors landscape
Chapter 5 Particulate Matter Monitoring Market Estimates & Forecast, By Monitoring Technology, 2022 - 2035 (USD Billion)
- 5.1 Key trends,
- 5.2 Hardware
- 5.3 Gravimetric Methods
- 5.4 Beta Attenuation Monitors (BAM)
- 5.5 Tapered Element Oscillating Microbalance (TEOM)
- 5.6 Optical Particle Counters (OPC)/Laser Scattering
- 5.6.1 Professional/Reference-Grade OPC
- 5.6.2 Low-Cost Optical Sensors
- 5.6.3 Nephelometer
Chapter 6 Market Estimates and Forecast, By Particulate Matter Size, 2022 - 2035 (USD Billion)
- 6.1 Key trends
- 6.2 PM2.5 (≤ 2.5 µm)
- 6.3 PM10 (≤10 µm)
- 6.4 PM1 (≤ 1 µm)
Chapter 7 Market Estimates and Forecast, By Product Type Size, 2022 - 2035 (USD Billion)
- 7.1 Key trends
- 7.2 Outdoor Ambient Monitoring Systems
- 7.2.1 Fixed Ambient Monitoring Stations
- 7.2.2 Portable/Mobile Outdoor Monitors
- 7.2.3 Fence-line/Perimeter Monitors
- 7.2.4 Mobile Platform-Mounted Sensors
- 7.3 Indoor Environmental Monitoring Systems
- 7.3.1 General Building IAQ Monitors
- 7.3.2 Cleanroom & Controlled Environment Particle Counters
- 7.3.3 Industrial Indoor Monitors
- 7.3.4 HVAC-Integrated Monitoring Systems
- 7.3.5 Personal Wearable Exposure Monitors
Chapter 8 Market Estimates and Forecast, By Application, 2022 - 2035 (USD Billion)
- 8.1 Key trends
- 8.2 Regulatory Compliance & Ambient Air Quality Monitoring
- 8.3 Occupational Health & Workplace Safety
- 8.4 Industrial Process & Emission Monitoring
- 8.5 Building & Facility Indoor Air Quality Management
- 8.6 Personal Exposure Assessment & Epidemiological Research
- 8.7 Others
Chapter 9 Market Estimates and Forecast, By End-User Industry, 2022 - 2035 (USD Billion)
- 9.1 Key trends
- 9.2 Government & Regulatory Agencies
- 9.3 Power Generation
- 9.4 Chemical & Petrochemical Manufacturing
- 9.5 Metals & Mining
- 9.6 Healthcare & Life Sciences
- 9.7 Semiconductor & Electronics Manufacturing
- 9.8 Agriculture & Food Processing
- 9.9 Others
Chapter 10 Particulate Matter Monitoring Market Estimates & Forecast, By Region, 2022 - 2035 (USD Billion)
- 10.1 Key trends, by region
- 10.2 North America
- 10.2.1 U.S.
- 10.2.2 Canada
- 10.3 Europe
- 10.3.1 UK
- 10.3.2 Germany
- 10.3.3 France
- 10.3.4 Italy
- 10.3.5 Spain
- 10.3.6 Netherlands
- 10.3.7 Rest of Europe
- 10.4 Asia-Pacific
- 10.4.1 China
- 10.4.2 India
- 10.4.3 Japan
- 10.4.4 South Korea
- 10.4.5 Australia
- 10.4.6 Rest of Asia-Pacific
- 10.5 Latin America
- 10.5.1 Brazil
- 10.5.2 Mexico
- 10.5.3 Argentina
- 10.5.4 Rest of Latin America
- 10.6 MEA
- 10.6.1 Saudi Arabia
- 10.6.2 South Africa
- 10.6.3 UAE
- 10.6.4 Rest of MEA
Chapter 11 Company Profiles
- 11.1 3M Company
- 11.2 ACOEM Group
- 11.3 Aeroqual Group Limited
- 11.4 AMETEK, Inc.
- 11.5 Beckman Coulter, Inc.
- 11.6 Ecotech Pty Ltd
- 11.7 Enviro Technology Services plc
- 11.8 GrayWolf Sensing Solutions
- 11.9 Honeywell International Inc.
- 11.10 Horiba Ltd.
- 11.11 Kanomax USA, Inc.
- 11.12 Met One Instruments, Inc.
- 11.13 Opsis AB
- 11.14 Palas GmbH
- 11.15 PCE Instruments
- 11.16 Rupprecht & Patashnick Co., Inc. (R&P)
- 11.17 Siemens AG
- 11.18 terra
- 11.19 Thermo Fisher Scientific, Inc.
- 11.20 TSI Incorporated


