


 |
市場調查報告書
商品編碼
1959572
自動駕駛巴士軟體市場機會、成長要素、產業趨勢分析及2026年至2035年預測Autonomous Bus Software Market Opportunity, Growth Drivers, Industry Trend Analysis, and Forecast 2026 - 2035 |
||||||
2025 年全球自動駕駛巴士軟體市場價值 10.4 億美元,預計到 2035 年將達到 92.3 億美元,年複合成長率為 24.7%。
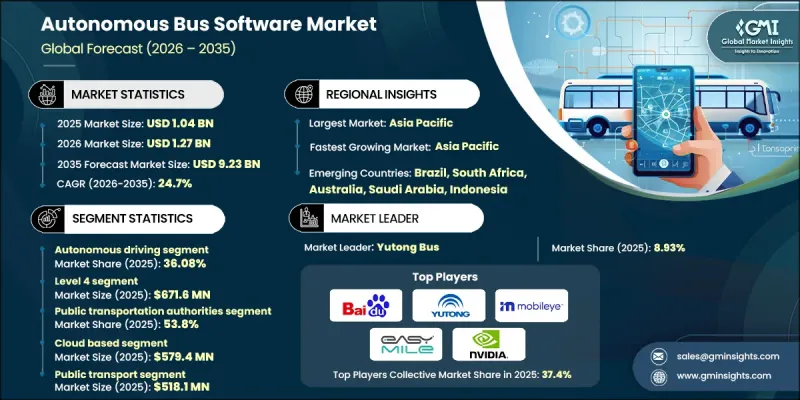
全球對永續、高效和智慧化的城市交通解決方案日益成長的需求,推動了這個市場的成長。世界各地的城市都在投資能夠緩解交通堵塞、減少排放氣體並提升乘客整體體驗的技術。配備先進軟體的自動駕駛公車正成為這些策略的關鍵組成部分。人工智慧、機器學習、先進感測器和雲端分析的融合,實現了即時導航、路線最佳化,並提高了乘客和行人的安全性。各國政府、交通管理部門和技術供應商正攜手合作,加速智慧交通系統的應用,尤其是在智慧城市建設中,使自動駕駛公車能夠與基礎設施、其他車輛和交通管理系統協同運作。這種合作不僅提高了營運效率,還有助於實現環境目標,使自動駕駛公車成為未來城市公共交通的核心。
| 市場範圍 | |
|---|---|
| 開始年份 | 2025 |
| 預測年份 | 2026-2035 |
| 起始值 | 10.4億美元 |
| 預測金額 | 92.3億美元 |
| 複合年成長率 | 24.7% |
預計到2025年,自動駕駛領域的市佔率將達到36.08%,並在2035年之前以26.1%的複合年成長率成長。這一成長主要得益於車隊管理軟體的日益普及,該軟體能夠提高營運效率並增強安全性。營運商可以遠端即時監控公車,追蹤技術問題,並對延誤和故障做出快速反應。基於物聯網的預測性維護能夠預先發現潛在問題,從而減少停機時間和維修成本。該軟體還包含路線最佳化和油耗追蹤功能,有助於降低營運成本並提高車隊管理效率。這些因素使得自動駕駛軟體成為運輸業者提高可靠性和盈利,同時確保乘客安全的必備工具。
預計到2025年,L4級自動駕駛公車市場規模將達6.716億美元。這些公車旨在預設區域內自主運行,例如商業區、校園和智慧城市走廊。人工智慧驅動的預測分析、即時交通資訊和機器學習技術使其能夠有效率地應對複雜的城市環境。 L4級自動駕駛公車透過持續適應交通模式和乘客需求,提供最佳化的性能。儘管法規結構和基礎設施的限制阻礙了其在公共道路上的廣泛部署,但各個城市正在進行的受控測試和試驗計畫正在加速這些系統的完善及其未來的主流化應用。
預計2026年至2035年,中國自動駕駛公車軟體市場將以27.1%的複合年成長率成長。快速的都市化、大規模的公共交通升級以及智慧城市建設是推動市場需求的主要因素。政府對自動駕駛技術、人工智慧和智慧型運輸系統(ITS)的支持,正在加速自動駕駛公車軟體解決方案的投資。中國致力於減少交通堵塞和環境污染,加上其強大的技術生態系統,使其成為自動駕駛公車軟體應用和創新領域的領先市場。隨著都市區採用智慧運輸解決方案,亞太其他地區國家也為全部區域成長做出了貢獻。
目錄
第1章:調查方法和範圍
第2章執行摘要
第3章業界考察
- 生態系分析
- 供應商情況
- 成本結構
- 利潤率
- 每個階段增加的價值
- 垂直整合趨勢
- 顛覆者
- 影響因素
- 促進因素
- 共用出行和按需交通的需求日益成長
- 改善安全和交通管理
- 社會認可和接受度不斷提高
- 人們對自動駕駛汽車的興趣日益濃厚
- 產業潛在風險與挑戰
- 監管和法律挑戰
- 高昂的開發和營運成本
- 市場機遇
- 人工智慧驅動的自動化效能管理 (APM) 和預測分析
- 與城市和交通運營商開展合作與夥伴關係
- 促進因素
- 技術趨勢與創新生態系統
- 目前技術
- 新興技術
- 成長潛力分析
- 監理情勢
- 北美洲
- 美國聯邦和州網路安全法規
- 加拿大《個人資料保護法》(PIPEDA) 和省級隱私法規
- 歐洲
- 一般資料保護規則
- 數位營運彈性法案
- NIS2 和網路安全指令
- 亞太地區
- 中國網路安全法與個人資訊保護法
- 印度數位個人資料保護法
- 日本《個人資訊保護法》(APPI)和國土交通省(MLIT)資訊通訊技術(ICT)指南
- 東協資料保護與網路安全框架
- 拉丁美洲
- 巴西 LGPD(通用資料保護法)
- 阿根廷個人資料保護法
- 墨西哥聯邦資料保護法和隱私權法規
- 中東和非洲
- 沙烏地阿拉伯國家網路安全局 (NCA) 的規章制度
- 南非的《個人資訊保護法》(POPIA)
- 阿拉伯聯合大公國(阿拉伯聯合大公國)資料保護及歐洲證券及市場管理局(ESMA)網路安全標準
- 北美洲
- 波特五力分析
- PESTEL 分析
- 價格趨勢
- 按地區
- 依產品
- 成本細分分析
- 專利分析
- 永續性和環境方面
- 導航系統的碳足跡
- 循環經濟戰略
- 永續航行能力
- 企業永續發展舉措
- 氣候變遷對航行的影響
- 案例研究
- 作戰準備與區域部署的可行性
- 安全檢驗、認證和問責框架
- 基礎建設依賴與智慧城市融合
第4章 競爭情勢
- 介紹
- 企業市佔率分析
- 北美洲
- 歐洲
- 亞太地區
- 拉丁美洲
- 中東和非洲
- 主要市場公司的競爭分析
- 競爭定位矩陣
- 戰略展望矩陣
- 主要進展
- 併購
- 夥伴關係與合作
- 新產品發布
- 業務拓展計劃及資金籌措
第5章 市場估計與預測:依功能分類,2022-2035年
- 車隊管理軟體
- 自動駕駛
- 交通管理
- 乘客管理
- 安全保障
- 公車線路設計
第6章 市場估算與預測:依自動化程度分類,2022-2035年
- 3級
- 4級
- 5級
第7章 市場估算與預測:依部署類型分類,2022-2035年
- 現場
- 基於雲端的
- 混合
第8章 市場估計與預測:依應用領域分類,2022-2035年
- 公共運輸
- 校園和公司接駁車
- 機場接送服務
- 其他
第9章 市場估計與預測:依最終用途分類,2022-2035年
- 公共運輸
- 私人運輸業者
- 企業用車
第10章 市場估價與預測:依地區分類,2022-2035年
- 北美洲
- 美國
- 加拿大
- 歐洲
- 英國
- 德國
- 法國
- 義大利
- 西班牙
- 比利時
- 荷蘭
- 瑞典
- 俄羅斯
- 亞太地區
- 中國
- 印度
- 日本
- 澳洲
- 新加坡
- 韓國
- 越南
- 印尼
- 拉丁美洲
- 巴西
- 墨西哥
- 阿根廷
- 中東和非洲
- 南非
- 沙烏地阿拉伯
- 阿拉伯聯合大公國
第11章:公司簡介
- 世界公司
- Baidu
- EasyMile
- Mobileye
- NVIDIA
- Yutong Bus
- Volvo
- Navya
- Mercedes-Benz
- BYD
- Transdev
- Region players
- Karsan Otomotiv Sanayi
- Scania
- Continental
- Aptiv
- ZF Friedrichshafen
- NFI
- Keolis
- New Flyer
- Aurrigo International
- Lilee Technology
- 新興企業
- WeRide
- May Mobility
- Local Motors
- Sensible 4
- Mozee
The Global Autonomous Bus Software Market was valued at USD 1.04 billion in 2025 and is estimated to grow at a CAGR of 24.7% to reach USD 9.23 billion by 2035.
The market growth is driven by an increasing global emphasis on sustainable, efficient, and intelligent urban mobility solutions. Cities worldwide are investing in technologies that reduce congestion, lower emissions, and improve the overall passenger experience. Autonomous buses, powered by advanced software, are becoming a critical component of these strategies. The integration of AI, machine learning, sophisticated sensors, and cloud analytics allows buses to navigate in real time, optimize routes, and enhance safety for passengers and pedestrians. Governments, transit authorities, and technology providers are collaborating to accelerate adoption, particularly in smart city initiatives where intelligent transportation systems enable autonomous buses to communicate with infrastructure, other vehicles, and traffic management systems. These partnerships are not only advancing operational efficiency but also helping meet environmental targets, positioning autonomous buses as central to the future of urban public transportation.
| Market Scope | |
|---|---|
| Start Year | 2025 |
| Forecast Year | 2026-2035 |
| Start Value | $1.04 Billion |
| Forecast Value | $9.23 Billion |
| CAGR | 24.7% |
The autonomous driving segment accounted for 36.08% share in 2025 and is projected to grow at a CAGR of 26.1% through 2035. Growth is fueled by the rising adoption of fleet management software that improves operational efficiency and enhances safety. Operators can remotely monitor buses in real time, track technical issues, and respond immediately to delays or malfunctions. IoT-based predictive maintenance helps forecast potential problems before they escalate, reducing downtime and repair costs. The software also includes route optimization and fuel consumption tracking, which contribute to lower operating costs and more efficient fleet management. These factors make autonomous driving software a vital tool for transit operators seeking to enhance reliability and profitability while ensuring passenger safety.
The level 4 autonomous buses segment accounted for USD 671.6 million in 2025. These buses are designed to operate independently within predefined zones, including business districts, campuses, and smart city corridors. AI-powered predictive analytics, real-time traffic updates, and machine learning allow them to navigate complex urban environments efficiently. By continuously adapting to traffic patterns and passenger demand, Level 4 autonomous buses deliver optimized performance. Although regulatory frameworks and infrastructure limitations restrict their widespread deployment on public roads, controlled trials and pilot programs in various cities are helping to refine these systems and accelerate eventual mainstream adoption.
China Autonomous Bus Software Market is expected to register a CAGR of 27.1% from 2026 to 2035. Rapid urbanization, large-scale public transportation upgrades, and smart city initiatives are driving strong demand. Government support for autonomous driving technologies, AI, and intelligent transportation systems is accelerating investment in autonomous bus software solutions. China's emphasis on reducing traffic congestion and environmental pollution, combined with its robust technology ecosystem, makes it a leading market for adoption and innovation in autonomous bus software. Other Asia-Pacific nations are also contributing to regional growth as urban centers embrace smart mobility solutions.
Major companies operating in the Global Autonomous Bus Software Market include Baidu, Waymo, NVIDIA, Aurora Innovation, Mobileye, Easy Mile, Volvo, Yutong Bus, May Mobility, and WeRide. Companies in the autonomous bus software market are employing multiple strategies to strengthen their position and expand market share. They are heavily investing in research and development to enhance AI algorithms, machine learning models, and sensor technologies for safer, more efficient autonomous driving. Strategic partnerships with automotive manufacturers, transit authorities, and city governments are helping companies scale pilot programs and accelerate commercial deployment. Expanding software capabilities to include fleet management, predictive maintenance, and route optimization increases value for operators. Additionally, firms are focusing on global expansion, regulatory compliance, and smart city integration to secure contracts and long-term adoption.
Table of Contents
Chapter 1 Methodology & Scope
- 1.1 Research approach
- 1.2 Quality commitments
- 1.2.1 GMI AI policy & data integrity commitment
- 1.3 Research trail & confidence scoring
- 1.3.1 Research trail components
- 1.3.2 Scoring components
- 1.4 Data collection
- 1.4.1 Partial list of primary sources
- 1.5 Data mining sources
- 1.5.1 Paid sources
- 1.6 Base estimates and calculations
- 1.6.1 Base year calculation
- 1.7 Forecast model
- 1.8 Research transparency addendum
Chapter 2 Executive Summary
- 2.1 Industry 360° synopsis
- 2.2 Key market trends
- 2.2.1 Regional
- 2.2.2 Functionality
- 2.2.3 Level of automation
- 2.2.4 Deployment model
- 2.2.5 Application
- 2.2.6 End Use
- 2.3 TAM Analysis, 2026-2035
- 2.4 CXO perspectives: Strategic imperatives
- 2.4.1 Key decision points for industry executives
- 2.4.2 Critical success factors for market players
- 2.5 Future outlook and strategic recommendations
Chapter 3 Industry Insights
- 3.1 Industry ecosystem analysis
- 3.1.1 Supplier landscape
- 3.1.2 Cost structure
- 3.1.3 Profit margin
- 3.1.4 Value addition at each stage
- 3.1.5 Vertical integration trends
- 3.1.6 Disruptors
- 3.2 Impact on forces
- 3.2.1 Growth drivers
- 3.2.1.1 Rising Demand for Shared Mobility and On-Demand Transport
- 3.2.1.2 Improved Safety and Traffic Management
- 3.2.1.3 Growing Public Awareness and Acceptance
- 3.2.1.4 Rising Interest in Autonomous Vehicles
- 3.2.2 Industry pitfalls & challenges
- 3.2.2.1 Regulatory and Legal Challenges
- 3.2.2.2 High Development and Operational Costs
- 3.2.3 Market opportunities
- 3.2.3.1 AI-driven APM & predictive analytics
- 3.2.3.2 Collaborations and Partnerships with Cities and Transport Operators
- 3.2.1 Growth drivers
- 3.3 Technology trends & innovation ecosystem
- 3.3.1 Current technologies
- 3.3.2 Emerging technologies
- 3.4 Growth potential analysis
- 3.5 Regulatory landscape
- 3.5.1 North America
- 3.5.1.1 U.S. Federal & State Cybersecurity Regulations
- 3.5.1.2 Canada PIPEDA & Provincial Privacy Regulations
- 3.5.2 Europe
- 3.5.2.1 General Data Protection Regulation
- 3.5.2.2 Digital Operational Resilience Act
- 3.5.2.3 NIS2 & Cybersecurity Directives
- 3.5.3 Asia-Pacific
- 3.5.3.1 China Cybersecurity Law & PIPL
- 3.5.3.2 India Digital Personal Data Protection Act
- 3.5.3.3 Japan APPI & MLIT ICT Guidelines
- 3.5.3.4 ASEAN Data Protection & Cybersecurity Frameworks
- 3.5.4 Latin America
- 3.5.4.1 Brazil LGPD (General Data Protection Law)
- 3.5.4.2 Argentina Personal Data Protection Act
- 3.5.4.3 Mexico Federal Data Protection Law & Privacy Regulations
- 3.5.5 Middle East & Africa
- 3.5.5.1 Saudi Arabia National Cybersecurity Authority (NCA) Regulations
- 3.5.5.2 South Africa POPIA (Protection of Personal Information Act)
- 3.5.5.3 UAE Data Protection & ESMA Cybersecurity Standards
- 3.5.1 North America
- 3.6 Porter's analysis
- 3.7 PESTEL analysis
- 3.8 Price trends
- 3.8.1 By region
- 3.8.2 By product
- 3.9 Cost breakdown analysis
- 3.10 Patent analysis
- 3.11 Sustainability and environmental aspects
- 3.11.1 Carbon footprint of navigation systems
- 3.11.2 Circular economic strategies
- 3.11.3 Sustainable navigation features
- 3.11.4 Corporate sustainability initiatives
- 3.11.5 Climate change impact on navigation
- 3.12 Case studies
- 3.13 Operational Readiness & Regional Deployment Feasibility
- 3.14 Safety Validation, Certification & Liability Framework
- 3.15 Infrastructure Dependency & Smart City Integration
Chapter 4 Competitive Landscape, 2025
- 4.1 Introduction
- 4.2 Company market share analysis
- 4.2.1 North America
- 4.2.2 Europe
- 4.2.3 Asia Pacific
- 4.2.4 LATAM
- 4.2.5 MEA
- 4.3 Competitive analysis of major market players
- 4.4 Competitive positioning matrix
- 4.5 Strategic outlook matrix
- 4.6 Key developments
- 4.6.1 Mergers & acquisitions
- 4.6.2 Partnerships & collaborations
- 4.6.3 New product launches
- 4.6.4 Expansion plans and funding
Chapter 5 Market Estimates & Forecast, By Functionality, 2022 - 2035 ($Bn, Units)
- 5.1 Key trends
- 5.2 Fleet management software
- 5.3 Autonomous driving
- 5.4 Traffic management
- 5.5 Passenger management
- 5.6 Safety & security
- 5.7 Bus route design
Chapter 6 Market Estimates & Forecast, By Level of Automation, 2022 - 2035 ($Bn, Units)
- 6.1 Key trends
- 6.2 Level 3
- 6.3 Level 4
- 6.4 Level 5
Chapter 7 Market Estimates & Forecast, By Deployment model, 2022 - 2035 ($Bn, Units)
- 7.1 Key trends
- 7.2 On premises
- 7.3 Cloud-based
- 7.4 Hybrid
Chapter 8 Market Estimates & Forecast, By Application, 2022 - 2035 ($Bn, Units)
- 8.1 Key trends
- 8.2 Public transport
- 8.3 Campus and corporate shuttles
- 8.4 Airport shuttles
- 8.5 Others
Chapter 9 Market Estimates & Forecast, By End Use, 2022 - 2035 ($Bn, Units)
- 9.1 Key trends
- 9.2 Public transportation authorities
- 9.3 Private transport operators
- 9.4 Corporate fleets
Chapter 10 Market Estimates & Forecast, By Region, 2022 - 2035 ($Bn, Units)
- 10.1 North America
- 10.1.1 US
- 10.1.2 Canada
- 10.2 Europe
- 10.2.1 UK
- 10.2.2 Germany
- 10.2.3 France
- 10.2.4 Italy
- 10.2.5 Spain
- 10.2.6 Belgium
- 10.2.7 Netherlands
- 10.2.8 Sweden
- 10.2.9 Russia
- 10.3 Asia Pacific
- 10.3.1 China
- 10.3.2 India
- 10.3.3 Japan
- 10.3.4 Australia
- 10.3.5 Singapore
- 10.3.6 South Korea
- 10.3.7 Vietnam
- 10.3.8 Indonesia
- 10.4 Latin America
- 10.4.1 Brazil
- 10.4.2 Mexico
- 10.4.3 Argentina
- 10.5 MEA
- 10.5.1 South Africa
- 10.5.2 Saudi Arabia
- 10.5.3 UAE
Chapter 11 Company Profiles
- 11.1 Global players
- 11.1.1 Baidu
- 11.1.2 EasyMile
- 11.1.3 Mobileye
- 11.1.4 NVIDIA
- 11.1.5 Yutong Bus
- 11.1.6 Volvo
- 11.1.7 Navya
- 11.1.8 Mercedes-Benz
- 11.1.9 BYD
- 11.1.10 Transdev
- 11.2 Region players
- 11.2.1 Karsan Otomotiv Sanayi
- 11.2.2 Scania
- 11.2.3 Continental
- 11.2.4 Aptiv
- 11.2.5 ZF Friedrichshafen
- 11.2.6 NFI
- 11.2.7 Keolis
- 11.2.8 New Flyer
- 11.2.9 Aurrigo International
- 11.2.10 Lilee Technology
- 11.3 Emerging players
- 11.3.1 WeRide
- 11.3.2 May Mobility
- 11.3.3 Local Motors
- 11.3.4 Sensible 4
- 11.3.5 Mozee
 中國獨立OEM的ADAS和自動駕駛技術(2026年)
 低速自動駕駛市場:按類別、組件、最終用戶產業和用例分類-2026-2032年全球市場預測
 2026年道路人工智慧(AI)模式標註服務全球市場報告共用自動駕駛汽車市場:按自動駕駛等級、服務模式、動力系統、車輛類型和應用程式分類-2026-2032年全球預測自動駕駛市場:按組件、自動化程度、動力傳動系統、車輛類型和最終用戶分類-2026年至2032年全球預測
 自動駕駛技術市場-策略洞察與預測(2026-2031年)自動駕駛LiDAR系統市場:按LiDAR類型、偵測範圍、車輛類型、安裝方式和最終用戶分類-全球預測,2026-2032年汽車虛擬ECU市場:策略洞察與預測(2026-2031年)
 自動駕駛系統市場規模、佔有率和成長分析:按級別、技術、應用和地區分類-2026-2033年產業預測
 端對端神經網路自動駕駛系統市場:機會、成長要素、產業趨勢分析及2026年至2035年預測