


 |
市場調查報告書
商品編碼
1959567
LiDAR市場機會、成長要素、產業趨勢分析及測繪預測(2026-2035年)LiDAR in Mapping Market Opportunity, Growth Drivers, Industry Trend Analysis, and Forecast 2026 - 2035 |
||||||
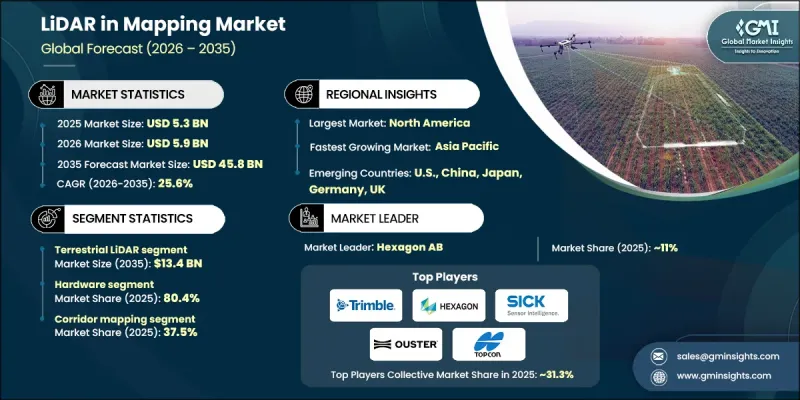
2025 年全球測繪用LiDAR市場價值 53 億美元,預計到 2035 年將達到 458 億美元,年複合成長率為 25.6%。
市場擴張的驅動力在於雷射雷達(LiDAR)與人工智慧(AI)、地理資訊系統(GIS)平台以及新興數位雙胞胎解決方案的日益融合。這些融合實現了即時空間分析和自動特徵提取,從而革新了測繪工作流程。訂閱模式和地圖即服務(MaaS)交付模式的興起,使得雷射雷達的應用更加普及,無需大量的硬體前期投資。雲端基礎架構進一步支援協作計劃管理、即時資料共用以及從資料擷取到交貨的端到端地理空間工作流程支援。北美和歐洲的中小型企業對LiDAR的採用尤為顯著,他們無需大量資本投入即可享受可擴展的處理能力。隨著政府機構和私人企業對高效大規模測繪和即時地理空間洞察的需求不斷成長,LiDAR與無人機(UAV)、自動駕駛車輛和數位雙胞胎的融合正在加速市場形成。
| 市場範圍 | |
|---|---|
| 開始年份 | 2025 |
| 預測年份 | 2026-2035 |
| 起始金額 | 53億美元 |
| 預測金額 | 458億美元 |
| 複合年成長率 | 25.6% |
預計到2035年,地面LiDAR市場規模將達134億美元。其成長主要得益於在基礎設施建設、建築施工和城市規劃計劃中的廣泛應用。高精度測繪道路、公共設施和建築物,能夠幫助工程師最大限度地減少誤差、最佳化材料使用並加快專案進度。北美、歐洲和亞太地區的各國政府正日益強制要求在城市發展和智慧城市計劃中採用雷射雷達技術。移動式和手持式地面LiDAR系統的進步也使得中型企業更容易獲得這些解決方案。與人工智慧驅動的點雲處理、BIM和GIS平台整合,能夠提升公共產業、工業工廠和環境監測領域的預測性維護、即時決策和效率。
預計到2025年,硬體部分將佔據80.4%的市場。這一主導地位源自於先進雷射雷達感測器和掃描設備在機載、地面和無人機(UAV)應用方面的可靠性、成本效益和監管核准。北美、歐洲和亞太地區對能夠產生高密度、高精度點雲資料的專用雷射雷達硬體的需求,正推動其在精密測繪、基礎設施監測和環境分析等領域的應用。
預計到2025年,北美LiDAR測繪市場佔有率將達到49.8%。該地區的成長主要得益於大規模基礎設施計劃、都市化以及交通網路的發展。政府在智慧城市建設、洪水測繪和資產管理等領域的舉措日益依賴雷射雷達進行精確的地形和地理空間資料收集,從而提升規劃水準、營運效率和城市韌性。無人機和機載雷射雷達系統的高普及率,以及領先製造商的大力研發投入,進一步推動了該地區市場的擴張。
目錄
第1章:調查方法和範圍
第2章執行摘要
第3章業界考察
- 生態系分析
- 供應商情況
- 利潤率分析
- 成本結構
- 每個階段增加的價值
- 影響價值鏈的因素
- 中斷
- 影響產業的因素
- 促進因素
- 高精度地理空間資料的需求日益成長
- 快速的基礎設施建設和都市化
- 政府主導的國家調查和韌性計劃增加
- 基於無人機(UAV)的LiDAR測量技術的快速普及
- 環境監測和氣候應用領域的成長
- 產業潛在風險與挑戰
- 初始資本成本高
- 複雜的數據處理和技能要求
- 市場機遇
- 訂閱式地圖服務模式的成長
- 在未開發的市場中尋求擴張機會
- 促進因素
- 監理情勢
- 北美洲
- 歐洲
- 亞太地區
- 拉丁美洲
- 中東和非洲
- 波特的分析
- PESTEL 分析
- 科技與創新趨勢
- 當前技術趨勢
- 新興技術
- 新興經營模式
- 合規要求
- 專利和智慧財產權分析
- 地緣政治和貿易趨勢
第4章 競爭情勢
- 介紹
- 企業市佔率分析
- 按地區
- 北美洲
- 歐洲
- 亞太地區
- 拉丁美洲
- 中東和非洲
- 按地區
- 主要企業的競爭標竿分析
- 財務績效比較
- 收入
- 利潤率
- 研究與開發
- 產品系列比較
- 產品線的廣度
- 科技
- 創新
- 地理位置比較
- 全球擴張分析
- 服務網路覆蓋
- 按地區分類的市場滲透率
- 競爭定位矩陣
- 領導企業
- 挑戰者
- 追蹤者
- 小眾玩家
- 戰略展望矩陣
- 財務績效比較
- 2021-2024 年重大發展
- 併購
- 夥伴關係與合作
- 技術進步
- 擴張和投資策略
- 數位轉型計劃
- 新興/Start-Ups競爭對手的發展趨勢
第5章 市場估計與預測:依平台分類,2022-2035年
- 無人機
- 固定翼無人機
- 單旋翼無人機
- 多旋翼無人機
- 地面LiDAR
- 固定類型
- 移動的
- 載人機載雷射雷達
- 專用於手持式/背包式雷射雷達的托盤
第6章 市場估算與預測:基於距離原則,2022-2035年
- Time-of-Flight (ToF) LiDAR
- 相移雷射雷達
- 頻率調變連續波(FMCW)
第7章 市場估計與預測:依掃描法,2022-2035年
- 機械掃描
- 固態掃描
第8章 市場估算與預測:依組件分類,2022-2035年
- 硬體
- 軟體
第9章 市場估計與預測:依應用領域分類,2022-2035年
- 線路測量製圖
- 建築/測量
- 農業/林業
- 採礦和採石
- 教育
- 環境
- 運輸
- 緊急服務
- 其他
第10章 市場估價與預測:依地區分類,2022-2035年
- 北美洲
- 美國
- 加拿大
- 歐洲
- 德國
- 英國
- 法國
- 西班牙
- 義大利
- 荷蘭
- 亞太地區
- 中國
- 印度
- 日本
- 澳洲
- 韓國
- 拉丁美洲
- 巴西
- 墨西哥
- 阿根廷
- 中東和非洲
- 南非
- 沙烏地阿拉伯
- 阿拉伯聯合大公國
第11章:公司簡介
- Trimble Inc.
- Hexagon AB
- SICK AG
- Topcon
- Ouster Inc.
- RIEGL
- FARO
- Quanergy Solutions, Inc.
- Teledyne Technologies Inc.
- Valeo
- NV5 Global, Inc.
- Shanghai Slamtec Co., Ltd.
- Vaisala
- Hesai Group.
- Pix4D SA
The Global LiDAR in Mapping Market was valued at USD 5.3 billion in 2025 and is estimated to grow at a CAGR of 25.6% to reach USD 45.8 billion by 2035.
Market expansion is driven by the growing integration of LiDAR with artificial intelligence, GIS platforms, and emerging digital twin solutions, which are transforming mapping workflows by enabling real-time spatial analytics and automated feature extraction. The rise of subscription-based and Mapping as a Service (MaaS) offerings is making LiDAR more accessible by eliminating significant upfront hardware investments. Cloud-based infrastructure further allows for collaborative project management, real-time data sharing, and end-to-end geospatial workflow support from data capture to delivery. Adoption is particularly strong among small to mid-sized enterprises in North America and Europe, which benefit from scalable processing without heavy capital expenditure. The integration of LiDAR with UAVs, autonomous vehicles, and digital twins is increasingly shaping the market, as both government bodies and private enterprises seek efficient, large-scale mapping and real-time geospatial insights.
| Market Scope | |
|---|---|
| Start Year | 2025 |
| Forecast Year | 2026-2035 |
| Start Value | $5.3 Billion |
| Forecast Value | $45.8 Billion |
| CAGR | 25.6% |
The terrestrial LiDAR segment is projected to reach USD 13.4 billion by 2035. Growth is fueled by its use in infrastructure development, construction, and urban planning projects. High-precision mapping of roads, utilities, and buildings allows engineers to minimize errors, optimize material usage, and accelerate timelines. Governments across North America, Europe, and Asia-Pacific are increasingly mandating LiDAR adoption for urban development and smart city projects. Advancements in mobile and handheld terrestrial LiDAR systems are also making these solutions more accessible for mid-sized organizations. Integration with AI-powered point-cloud processing, BIM, and GIS platforms enhances predictive maintenance, real-time decision-making, and efficiency in utilities, industrial plants, and environmental monitoring.
The hardware segment accounted for 80.4% share in 2025. Its dominance is due to the reliability, cost-effectiveness, and regulatory approval of advanced LiDAR sensors and scanning equipment for airborne, terrestrial, and UAV applications. Precision mapping, infrastructure monitoring, and environmental analysis demand specialized LiDAR hardware capable of generating dense and accurate point-cloud data, driving widespread adoption in North America, Europe, and Asia-Pacific.
North America LiDAR in Mapping Market contributed 49.8% share in 2025. Growth in the region is driven by extensive infrastructure projects, urbanization, and transportation development. Government initiatives in smart cities, flood mapping, and asset management increasingly rely on LiDAR for precise topographic and geospatial data, enhancing planning, operational efficiency, and urban resilience. The region benefits from high adoption of UAV and airborne LiDAR systems and strong R&D investments by leading manufacturers, which further propels market expansion.
Key companies in the Global LiDAR in Mapping Market include Hexagon AB, Teledyne Technologies Inc., Trimble Inc., RIEGL, FARO, Topcon, Vaisala, NV5 Global, Inc., Pix4D SA, Hesai Group, Valeo, Quanergy Solutions, Inc., Ouster Inc., Shanghai Slamtec Co., Ltd., and SICK AG. Companies in the LiDAR in mapping market are adopting multiple strategies to strengthen their presence. They are investing heavily in R&D to enhance sensor accuracy, range, and integration with AI, GIS, and digital twin platforms. Strategic collaborations with UAV, autonomous vehicle, and mapping service providers expand deployment opportunities. Cloud-based solutions and subscription models reduce upfront costs, broadening accessibility for small and mid-sized firms. Geographic expansion, localized support, and training programs help capture regional demand. Firms also focus on software ecosystem development, including AI-powered point-cloud processing, predictive maintenance, and real-time analytics, ensuring long-term adoption and recurring revenue streams.
Table of Contents
Chapter 1 Methodology and Scope
- 1.1 Market scope and definition
- 1.2 Research design
- 1.2.1 Research approach
- 1.2.2 Data collection methods
- 1.3 Data mining sources
- 1.3.1 Global
- 1.3.2 Regional/Country
- 1.4 Base estimates and calculations
- 1.4.1 Base year calculation
- 1.4.2 Key trends for market estimation
- 1.5 Primary research and validation
- 1.5.1 Primary sources
- 1.6 Forecast model
- 1.7 Research assumptions and limitations
Chapter 2 Executive Summary
- 2.1 Industry 360° synopsis, 2022 - 2035
- 2.2 Key market trends
- 2.2.1 System type trends
- 2.2.2 Deployment model trends
- 2.2.3 End-user industry trends
- 2.2.4 Regional trends
- 2.3 TAM analysis, 2025-2034
- 2.4 CXO perspectives: Strategic imperatives
- 2.4.1 Executive decision points
- 2.4.2 Critical success factors
- 2.5 Future outlook and strategic recommendations
Chapter 3 Industry Insights
- 3.1 Industry ecosystem analysis
- 3.1.1 Supplier landscape
- 3.1.2 Profit margin analysis
- 3.1.3 Cost structure
- 3.1.4 Value addition at each stage
- 3.1.5 Factor affecting the value chain
- 3.1.6 Disruptions
- 3.2 Industry impact forces
- 3.2.1 Growth drivers
- 3.2.1.1 Rising demand for high-accuracy geospatial data
- 3.2.1.2 Rapid infrastructure development & urbanization
- 3.2.1.3 Increasing government-led national mapping & resilience programs
- 3.2.1.4 Rapid adoption of UAV-based lidar mapping
- 3.2.1.5 Growth in environmental monitoring & climate applications
- 3.2.2 Industry pitfalls and challenges
- 3.2.2.1 High initial capital cost
- 3.2.2.2 Complex data processing & skill requirements
- 3.2.3 Market opportunities
- 3.2.3.1 Growth of subscription-based & mapping-as-a-service models
- 3.2.3.2 Expansion opportunities in underpenetrated markets
- 3.2.1 Growth drivers
- 3.3 Regulatory landscape
- 3.3.1 North America
- 3.3.2 Europe
- 3.3.3 Asia Pacific
- 3.3.4 Latin America
- 3.3.5 Middle East & Africa
- 3.4 Porter’s analysis
- 3.5 PESTEL analysis
- 3.6 Technology and innovation landscape
- 3.6.1 Current technological trends
- 3.6.2 Emerging technologies
- 3.7 Emerging business models
- 3.8 Compliance requirements
- 3.9 Patent and IP analysis
- 3.10 Geopolitical and trade dynamics
Chapter 4 Competitive Landscape, 2024
- 4.1 Introduction
- 4.2 Company market share analysis
- 4.2.1 By region
- 4.2.1.1 North America
- 4.2.1.2 Europe
- 4.2.1.3 Asia Pacific
- 4.2.1.4 Latin America
- 4.2.1.5 Middle East & Africa
- 4.2.1 By region
- 4.3 Competitive benchmarking of key players
- 4.3.1 Financial performance comparison
- 4.3.1.1 Revenue
- 4.3.1.2 Profit margin
- 4.3.1.3 R&D
- 4.3.2 Product portfolio comparison
- 4.3.2.1 Product range breadth
- 4.3.2.2 Technology
- 4.3.2.3 Innovation
- 4.3.3 Geographic presence comparison
- 4.3.3.1 Global footprint analysis
- 4.3.3.2 Service network coverage
- 4.3.3.3 Market penetration by region
- 4.3.4 Competitive positioning matrix
- 4.3.4.1 Leaders
- 4.3.4.2 Challengers
- 4.3.4.3 Followers
- 4.3.4.4 Niche players
- 4.3.5 Strategic outlook matrix
- 4.3.1 Financial performance comparison
- 4.4 Key developments, 2021-2024
- 4.4.1 Mergers and acquisitions
- 4.4.2 Partnerships and collaborations
- 4.4.3 Technological advancements
- 4.4.4 Expansion and investment strategies
- 4.4.5 Digital transformation initiatives
- 4.5 Emerging/ startup competitors’ landscape
Chapter 5 Market Estimates and Forecast, By Platform, 2022 - 2035 (USD Mn)
- 5.1 Key trends
- 5.1.1 Drone
- 5.1.1.1 Fixed wing drones
- 5.1.1.2 Single rotor drones
- 5.1.1.3 Multi rotor drones
- 5.1.2 Terrestrial LiDAR
- 5.1.2.1 Stationary
- 5.1.2.2 Mobile
- 5.1.3 Manned Airborne LiDAR
- 5.1.4 Handheld / Backpack LiDAR Specialized pallets
- 5.1.1 Drone
Chapter 6 Market Estimates and Forecast, By Ranging Principle, 2022 - 2035 (USD Mn)
- 6.1 Key trends
- 6.2 Time-of-Flight (ToF) LiDAR
- 6.3 Phase Shift LiDAR
- 6.4 Frequency-Modulated Continuous Wave (FMCW)
Chapter 7 Market Estimates and Forecast, By Scanning Architecture, 2022 - 2035 (USD Mn)
- 7.1 Key trends
- 7.2 Mechanical Scanning
- 7.3 Solid-State Scanning
Chapter 8 Market Estimates and Forecast, By Component, 2022 - 2035 (USD Mn)
- 8.1 Key trends
- 8.2 Hardware
- 8.3 Software
Chapter 9 Market Estimates and Forecast, By Application, 2022 - 2035 (USD Mn)
- 9.1 Key trends
- 9.2 Corridor mapping
- 9.3 Construction & Surveying
- 9.4 Agriculture & Forestry
- 9.5 Mining & Quarrying
- 9.6 Education
- 9.7 Environmental
- 9.8 Transport
- 9.9 Emergency services
- 9.10 Others
Chapter 10 Market Estimates and Forecast, By Region, 2022 - 2035 (USD Mn)
- 10.1 Key trends
- 10.2 North America
- 10.2.1 U.S.
- 10.2.2 Canada
- 10.3 Europe
- 10.3.1 Germany
- 10.3.2 UK
- 10.3.3 France
- 10.3.4 Spain
- 10.3.5 Italy
- 10.3.6 Netherlands
- 10.4 Asia Pacific
- 10.4.1 China
- 10.4.2 India
- 10.4.3 Japan
- 10.4.4 Australia
- 10.4.5 South Korea
- 10.5 Latin America
- 10.5.1 Brazil
- 10.5.2 Mexico
- 10.5.3 Argentina
- 10.6 Middle East and Africa
- 10.6.1 South Africa
- 10.6.2 Saudi Arabia
- 10.6.3 UAE
Chapter 11 Company Profiles
- 11.1 Trimble Inc.
- 11.2 Hexagon AB
- 11.3 SICK AG
- 11.4 Topcon
- 11.5 Ouster Inc.
- 11.6 RIEGL
- 11.7 FARO
- 11.8 Quanergy Solutions, Inc.
- 11.9 Teledyne Technologies Inc.
- 11.10 Valeo
- 11.11 NV5 Global, Inc.
- 11.12 Shanghai Slamtec Co., Ltd.
- 11.13 Vaisala
- 11.14 Hesai Group.
- 11.15 Pix4D SA
 LiDAR市場:按類型、組件、技術、測量距離、最終用戶和應用分類-2026-2032年全球市場預測
 LiDAR測繪市場分析及預測(至2035年):按類型、產品、服務、技術、組件、應用、部署、最終用戶和功能分類
 2026年全球LiDAR軟體市場報告LiDAR濾光片市場:按濾光片類型、波長、技術、應用和部署分類-2026-2032年全球預測
 LiDAR技術市場:策略洞察與預測(2026-2031年)行動雷射掃描系統市場:按組件、掃描器類型、技術、應用和最終用戶分類,全球預測,2026-2032年LiDAR(LiDAR)市場規模、佔有率、成長率及全球產業分析:按類型、應用和地區分類,預測2026-2034年LiDAR市場分析及預測(至2035年):依類型、產品類型、服務、技術、組件、應用、部署、最終用戶及解決方案分類鐵路雷達和LiDAR技術市場分析及預測(至2035年):按類型、產品、服務、技術、組件、應用、部署、最終用戶、安裝類型和解決方案分類2026-2034年全球LiDAR市場規模、佔有率、趨勢和成長分析報告