


 |
市場調查報告書
商品編碼
1959562
遠端汽車廢氣檢測市場機會、成長要素、產業趨勢分析及預測(2026-2035年)Remote Automotive Exhaust Sensing Market Opportunity, Growth Drivers, Industry Trend Analysis, and Forecast 2026 - 2035 |
||||||
2025 年全球遠端汽車廢氣檢測市場價值 8,770 萬美元,預計到 2035 年將達到 2.186 億美元,年複合成長率為 9.7%。
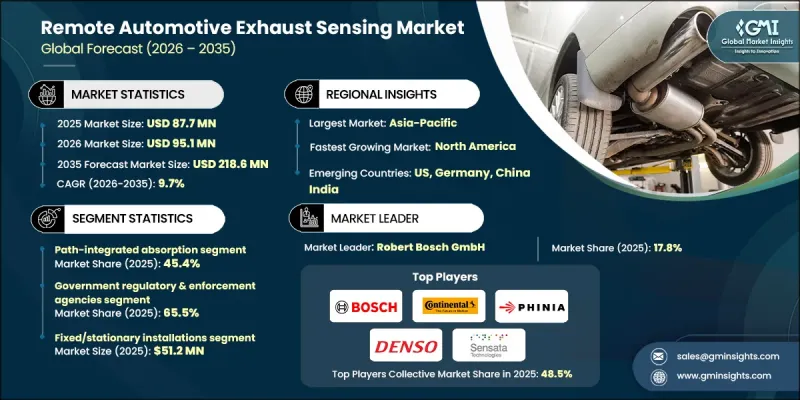
全球主要汽車市場日益嚴格的排放氣體法規正在推動市場擴張,並加速車輛實際排放氣體監測解決方案的普及。各國政府正大力投資建造用於空氣品質管理的遠端排放檢測基礎設施,尤其是在都市區和交通繁忙區域。與傳統的實驗室測試和隨機檢查不同,這些技術能夠即時採集車輛排放氣體數據,使相關部門能夠更有效地實施污染防治。此外,政府對都市區空氣品質改善舉措的公共資金投入以及將排放感測器整合到智慧城市交通網路中,也為市場發展提供了支持。偵測精確度、數據分析和自動報告功能的進步增強了環境和交通管理部門的信心,從而加速了這些解決方案的普及。人們對都市區空氣污染日益成長的擔憂以及應對不斷變化的排放法規的需求,正在推動遠端檢測系統在全球範圍內的穩步部署。
| 市場範圍 | |
|---|---|
| 開始年份 | 2025 |
| 預測年份 | 2026-2035 |
| 起始金額 | 8770萬美元 |
| 預測金額 | 2.186億美元 |
| 複合年成長率 | 9.7% |
到2025年,路徑整合吸收式感測器市場佔有率將達到45.4%。這類感測器因其能夠遠距離、高精度、即時地測量氮氧化物(NOx)、一氧化碳(CO)和顆粒物而備受青睞。它們能夠對繁忙道路進行連續監測,並可與自動化路邊監測站整合,有助於遵守排放氣體法規和車隊管理計劃。其高效可靠的數據提供能力使其成為城市和監管應用領域的基礎技術。
預計2026年至2035年,汽車製造商產業將以9.6%的複合年成長率成長。汽車原始設備製造商(OEM)和商用車車隊營運商正在擴大遠端排放感測器的應用範圍,用於實際道路排放氣體性能評估、引擎標定最佳化以及符合國內外排放氣體標準。日益嚴格的監管以及企業對永續性的承諾正推動製造商採用道路感測解決方案,尤其是在歐洲、北美和東亞等排放氣體性能持續受到評估的地區。
預計到2025年,北美遠端車輛排放檢測市場佔有率將達到18.9%。該地區市場成長的促進因素包括美國環保署(EPA)日益嚴格的排放氣體標準、不斷擴大的都市區空氣品質改善計劃以及對即時排放氣體監測需求的不斷成長。在交通繁忙的城市,車載感測裝置的部署正在擴大,使政府部門和私人車隊能夠持續監測氮氧化物(NOx)和顆粒物(PM)的排放。對物聯網感測器和人工智慧驅動的數據分析的投資正在增強即時追蹤排放氣體的能力,從而實現快速響應和合規。
目錄
第1章:調查方法和範圍
第2章執行摘要
第3章業界考察
- 生態系分析
- 供應商情況
- 利潤率
- 成本結構
- 每個階段增加的價值
- 影響價值鏈的因素
- 中斷
- 影響產業的因素
- 促進因素
- 世界各國政府加強汽車排放氣體法規
- 政府對路邊遠端檢測項目的投資
- 都市區對空氣品質合規性監測的需求日益成長
- 需要盡快對道路上行駛的車輛進行排放氣體檢測。
- 紅外線光譜學和數據分析技術的進步
- 產業潛在風險與挑戰
- 天氣和交通狀況下的精度變化
- 高昂的安裝和系統維護成本
- 市場機遇
- 支持智慧城市空氣品質監測計劃
- 車隊營運商用於追蹤排放
- 促進因素
- 成長潛力分析
- 監理情勢
- 北美洲
- 歐洲
- 亞太地區
- 拉丁美洲
- 中東和非洲
- 波特的分析
- PESTEL 分析
- 科技與創新趨勢
- 當前技術趨勢
- 新興技術
- 價格趨勢
- 按地區
- 依產品
- 定價策略
- 新興經營模式
- 合規要求
- 專利和智慧財產權分析
- 地緣政治和貿易趨勢
第4章 競爭情勢
- 介紹
- 企業市佔率分析
- 按地區
- 北美洲
- 歐洲
- 亞太地區
- 拉丁美洲
- 中東和非洲
- 市場集中度分析
- 按地區
- 主要企業的競爭標竿分析
- 財務績效比較
- 收入
- 利潤率
- 研究與開發
- 產品系列比較
- 產品線的廣度
- 科技
- 創新
- 地理位置比較
- 全球擴張分析
- 服務網路覆蓋
- 按地區分類的市場滲透率
- 競爭定位矩陣
- 領導企業
- 挑戰者
- 追蹤者
- 小眾玩家
- 戰略展望矩陣
- 財務績效比較
- 主要進展
- 併購
- 夥伴關係與合作
- 技術進步
- 擴張和投資策略
- 數位轉型計劃
- 新興/Start-Ups競爭對手的發展趨勢
第5章 市場估計與預測:依檢測方法分類,2022-2035年
- 路徑積分吸收
- 雷射測距/主動雷射
- 粒子相位光學
- 成像光譜學
第6章 市場估計與預測:依目標污染物分類,2022-2035年
- 氣相
- 氮氧化物(一氧化氮)
- CO
- CO2
- HC/VOC
- NH3
- SO2
- 其他受管制物質/目標氣體(甲醛、甲烷)
第7章 市場估算與預測:依產品類型分類,2022-2035年
- 硬體
- 軟體分析
- 服務
第8章 市場估算與預測:依部署類型分類,2022-2035年
- 固定式/獨立式安裝
- 行動執法平台
- 攜帶式/現場設備
- 網路連接感測器陣列
第9章 市場估價與預測:依車輛類型分類,2022-2035年
- 非機動車輛
- 大型車輛
- 摩托車
- 非道路引擎和非公路用設備車輛
第10章 市場估價與預測:依最終用戶分類,2022-2035年
- 政府監管和執法機構
- 汽車製造商
- 第三方檢驗和認證機構
- 學術和研究機構
- 商用車車主
第11章 市場估價與預測:按地區分類,2022-2035年
- 北美洲
- 美國
- 加拿大
- 歐洲
- 德國
- 英國
- 法國
- 西班牙
- 義大利
- 亞太地區
- 中國
- 印度
- 日本
- 澳洲
- 韓國
- 拉丁美洲
- 巴西
- 墨西哥
- 阿根廷
- 中東和非洲
- 南非
- 沙烏地阿拉伯
- 阿拉伯聯合大公國
第12章:公司簡介
- 主要企業
- Robert Bosch GmbH
- Continental AG
- Denso Corporation
- Sensata Technologies, Inc.
- Valeo SA
- HELLA GmbH &Co. KGaA
- 按地區分類的主要企業
- 北美洲
- Amphenol Advanced Sensors
- Opus Group AB
- 亞太地區
- Niterra India PVT. LTD.
- Korea Environment Corporation(K-eco)
- 歐洲
- AVL List GmbH
- PHINIA Inc.
- Hager Environmental &Atmospheric Technologies(HEAT)
- 北美洲
The Global Remote Automotive Exhaust Sensing Market was valued at USD 87.7 million in 2025 and is estimated to grow at a CAGR of 9.7% to reach USD 218.6 million by 2035.
The market is expanding due to stringent emission standards in major automotive regions worldwide, which are driving the adoption of real-world vehicle emissions monitoring solutions. Governments are heavily investing in remote exhaust sensing infrastructure, particularly in urban centers and high-traffic areas, to manage air quality. Unlike traditional laboratory testing or random inspections, these technologies capture real-time emissions data from vehicles, enabling authorities to address pollution more effectively. The market is further supported by public funding for urban air quality initiatives and integration of exhaust sensors into smart city transportation networks. Advances in sensing accuracy, data analytics, and automated reporting have increased trust among environmental and transport authorities, accelerating widespread deployment. Rising concerns over urban air pollution and compliance with evolving emission regulations are fueling the steady adoption of remote sensing systems globally.
| Market Scope | |
|---|---|
| Start Year | 2025 |
| Forecast Year | 2026-2035 |
| Start Value | $87.7 Million |
| Forecast Value | $218.6 Million |
| CAGR | 9.7% |
The path-integrated absorption segment held 45.4% share in 2025. These sensors are preferred for their ability to deliver highly accurate, real-time measurements of nitrogen oxides (NOx), carbon monoxide (CO), and particulate matter over extended distances. They enable continuous monitoring on busy roadways and can be integrated with automated roadside stations, supporting compliance with emission regulations and fleet management programs. Their efficiency in providing reliable data has made them a cornerstone technology for urban and regulatory applications.
The vehicle manufacturers segment is projected to grow at a CAGR of 9.6% during 2026 to 2035. Automotive OEMs and commercial fleet operators are increasingly deploying remote exhaust sensors to evaluate real-world emissions performance, optimize engine calibration, and comply with local and international emission standards. Heightened regulatory scrutiny and corporate sustainability initiatives are encouraging manufacturers to adopt on-road sensing solutions, especially across Europe, North America, and East Asia, where emissions performance is under continuous evaluation.
North America Remote Automotive Exhaust Sensing Market accounted for 18.9% share in 2025. Market growth in the region is driven by strict EPA emission standards, growing urban air quality programs, and rising demand for real-time emissions monitoring. Deployment of roadside sensing units is expanding in cities with high traffic density, enabling authorities and private fleets to monitor NOx and particulate matter emissions continuously. Investments in IoT-enabled sensors and AI-driven data analytics are enhancing the capability to track emissions in real time, allowing for prompt interventions and regulatory compliance.
Key players in the Global Remote Automotive Exhaust Sensing Market include Amphenol Advanced Sensors, AVL List GmbH, Continental AG, Denso Corporation, Hager Environmental & Atmospheric Technologies (HEAT), HELLA GmbH & Co. KGaA, Korea Environment Corporation (K-eco), Niterra India PVT. LTD., Opus Group AB, PHINIA Inc., Robert Bosch GmbH, Sensata Technologies, Inc., and Valeo SA. Companies in the Remote Automotive Exhaust Sensing Market are adopting multiple strategies to strengthen their market position. They are investing in advanced sensor technologies to improve accuracy, range, and data processing speed. Strategic collaborations with government agencies, transport authorities, and fleet operators are enabling early adoption and integration into smart city programs. Firms are expanding their global presence through partnerships, joint ventures, and localized manufacturing to meet regional regulatory requirements. Incorporation of AI, machine learning, and cloud-based analytics enhances predictive maintenance, emissions reporting, and fleet optimization services.
Table of Contents
Chapter 1 Methodology and Scope
- 1.1 Market scope and definition
- 1.2 Research design
- 1.2.1 Research approach
- 1.2.2 Data collection methods
- 1.3 Data mining sources
- 1.3.1 Global
- 1.3.2 Regional/Country
- 1.4 Base estimates and calculations
- 1.4.1 Base year calculation
- 1.4.2 Key trends for market estimation
- 1.5 Primary research and validation
- 1.5.1 Primary sources
- 1.6 Forecast model
- 1.7 Research assumptions and limitations
Chapter 2 Executive Summary
- 2.1 Industry 360° synopsis, 2022 - 2035
- 2.2 Key market trends
- 2.2.1 Sensing modality trends
- 2.2.2 Target pollutant trends
- 2.2.3 Offering trends
- 2.2.4 Deployment configuration trends
- 2.2.5 End user trends
- 2.2.6 Vehicle type trends
- 2.2.7 Regional trends
- 2.3 TAM Analysis, 2026-2035
- 2.4 CXO perspectives: Strategic imperatives
- 2.4.1 Executive decision points
- 2.4.2 critical success factors
- 2.5 Future outlook and strategic recommendations
Chapter 3 Industry Insights
- 3.1 Industry ecosystem analysis
- 3.1.1 Supplier Landscape
- 3.1.2 Profit Margin
- 3.1.3 Cost structure
- 3.1.4 Value addition at each stage
- 3.1.5 Factor affecting the value chain
- 3.1.6 Disruptions
- 3.2 Industry impact forces
- 3.2.1 Growth drivers
- 3.2.1.1 Stricter vehicle emission rules by governments globally
- 3.2.1.2 Government investment in roadside remote sensing programs
- 3.2.1.3 Rising urban air quality compliance monitoring needs
- 3.2.1.4 Need for fast on-road vehicle emission checks
- 3.2.1.5 Advances in infrared spectroscopy and data analytics
- 3.2.2 Industry pitfalls and challenges
- 3.2.2.1 Accuracy variability under weather and traffic conditions
- 3.2.2.2 High installation and system maintenance costs
- 3.2.3 Market opportunities
- 3.2.3.1 Support for smart city air monitoring programs
- 3.2.3.2 Use by fleet operators for emission tracking
- 3.2.1 Growth drivers
- 3.3 Growth potential analysis
- 3.4 Regulatory landscape
- 3.4.1 North America
- 3.4.2 Europe
- 3.4.3 Asia Pacific
- 3.4.4 Latin America
- 3.4.5 Middle East & Africa
- 3.5 Porter’s analysis
- 3.6 PESTEL analysis
- 3.7 Technology and Innovation landscape
- 3.7.1 Current technological trends
- 3.7.2 Emerging technologies
- 3.8 Price trends
- 3.8.1 By region
- 3.8.2 By product
- 3.9 Pricing Strategies
- 3.10 Emerging Business Models
- 3.11 Compliance Requirements
- 3.12 Patent and IP analysis
- 3.13 Geopolitical and trade dynamics
Chapter 4 Competitive Landscape, 2025
- 4.1 Introduction
- 4.2 Company market share analysis
- 4.2.1 By region
- 4.2.1.1 North America
- 4.2.1.2 Europe
- 4.2.1.3 Asia Pacific
- 4.2.1.4 Latin America
- 4.2.1.5 Middle East & Africa
- 4.2.2 Market concentration analysis
- 4.2.1 By region
- 4.3 Competitive benchmarking of key players
- 4.3.1 Financial performance comparison
- 4.3.1.1 Revenue
- 4.3.1.2 Profit margin
- 4.3.1.3 R&D
- 4.3.2 Product portfolio comparison
- 4.3.2.1 Product range breadth
- 4.3.2.2 Technology
- 4.3.2.3 Innovation
- 4.3.3 Geographic presence comparison
- 4.3.3.1 Global footprint analysis
- 4.3.3.2 Service network coverage
- 4.3.3.3 Market penetration by region
- 4.3.4 Competitive positioning matrix
- 4.3.4.1 Leaders
- 4.3.4.2 Challengers
- 4.3.4.3 Followers
- 4.3.4.4 Niche players
- 4.3.5 Strategic outlook matrix
- 4.3.1 Financial performance comparison
- 4.4 Key developments
- 4.4.1 Mergers and acquisitions
- 4.4.2 Partnerships and collaborations
- 4.4.3 Technological advancements
- 4.4.4 Expansion and investment strategies
- 4.4.5 Digital transformation initiatives
- 4.5 Emerging/ startup competitors landscape
Chapter 5 Market Estimates and Forecast, By Sensing Modality, 2022 - 2035 (USD Million & Units)
- 5.1 Key trends
- 5.2 Path-integrated absorption
- 5.3 Laser ranging / active laser
- 5.4 Particle-phase optical
- 5.5 Imaging spectroscopy
Chapter 6 Market Estimates and Forecast, By Target Pollutant, 2022 - 2035 (USD Million & Units)
- 6.1 Key trends
- 6.2 Gas-Phase
- 6.2.1 NOx (NO, NO2)
- 6.2.2 CO
- 6.2.3 CO2
- 6.2.4 HC/VOC
- 6.2.5 NH3
- 6.2.6 SO2
- 6.3 Other regulated/target gases (HCHO, CH4)
Chapter 7 Market Estimates and Forecast, By Offering, 2022 - 2035 (USD Million & Units)
- 7.1 Key trends
- 7.2 Hardware
- 7.3 Software & analytics
- 7.4 Services
Chapter 8 Market Estimates and Forecast, By Deployment Configuration, 2022 - 2035 (USD Million & Units)
- 8.1 Key trends
- 8.2 Fixed/stationary installations
- 8.3 Mobile enforcement platforms
- 8.4 Portable handheld/field devices
- 8.5 Networked sensor arrays
Chapter 9 Market Estimates and Forecast, By Vehicle Type, 2022 - 2035 (USD Million & Units)
- 9.1 Key trends
- 9.2 Light-duty vehicles
- 9.3 Heavy-duty vehicle
- 9.4 Two-wheelers
- 9.5 Non-road engines & off-highway equipment vehicle
Chapter 10 Market Estimates and Forecast, By End-User, 2022 - 2035 (USD Million & Units)
- 10.1 Key trends
- 10.2 Government regulatory & enforcement agencies
- 10.3 Vehicle manufacturers
- 10.4 Third-party inspection & certification bodies
- 10.5 Academic & research institutions
- 10.6 Commercial fleet owners
Chapter 11 Market Estimates and Forecast, By Region, 2022 - 2035 (USD Million & Units)
- 11.1 Key trends
- 11.2 North America
- 11.2.1 U.S.
- 11.2.2 Canada
- 11.3 Europe
- 11.3.1 Germany
- 11.3.2 UK
- 11.3.3 France
- 11.3.4 Spain
- 11.3.5 Italy
- 11.4 Asia Pacific
- 11.4.1 China
- 11.4.2 India
- 11.4.3 Japan
- 11.4.4 Australia
- 11.4.5 South Korea
- 11.5 Latin America
- 11.5.1 Brazil
- 11.5.2 Mexico
- 11.5.3 Argentina
- 11.6 Middle East and Africa
- 11.6.1 South Africa
- 11.6.2 Saudi Arabia
- 11.6.3 UAE
Chapter 12 Company Profiles
- 12.1 Global Key Players
- 12.1.1 Robert Bosch GmbH
- 12.1.2 Continental AG
- 12.1.3 Denso Corporation
- 12.1.4 Sensata Technologies, Inc.
- 12.1.5 Valeo SA
- 12.1.6 HELLA GmbH & Co. KGaA
- 12.2 Regional key players
- 12.2.1 North America
- 12.2.1.1 Amphenol Advanced Sensors
- 12.2.1.2 Opus Group AB
- 12.2.2 Asia Pacific
- 12.2.2.1 Niterra India PVT. LTD.
- 12.2.2.2 Korea Environment Corporation (K-eco)
- 12.2.3 Europe
- 12.2.3.1 AVL List GmbH
- 12.2.3.2 PHINIA Inc.
- 12.2.3.3 Hager Environmental & Atmospheric Technologies (HEAT)
- 12.2.1 North America


