

 |
市場調查報告書
商品編碼
1959547
手勢姿態辨識市場機會、成長要素、產業趨勢分析及2026年至2035年預測Gesture Recognition Market Opportunity, Growth Drivers, Industry Trend Analysis, and Forecast 2026 - 2035 |
||||||
2025 年全球手勢姿態辨識市場價值 299 億美元,預計到 2035 年將達到 2,515 億美元,年複合成長率為 23.8%。
市場成長的驅動力來自人們對非接觸式互動日益成長的偏好、智慧零售和數位商店的擴張、電腦視覺和人工智慧技術的進步,以及攝影機和監控基礎設施的日益普及。各組織和政府將改善公共衛生和安全放在首位,推動非接觸式運營,這在新冠疫情期間加速了需求成長。手勢姿態辨識技術是無接觸式自助服務終端、數位電子看板和服務櫃檯的基礎,最大限度地減少了公共場所的實體接觸。世界各國政府正在將這些解決方案整合到智慧公共基礎設施中,人工智慧和自動化是國家數位轉型議程的核心,推動相關研究和商業化進程。在醫療保健、零售、教育和汽車等領域的廣泛應用,正在提升對先進的基於手勢的人機互動介面的需求。
| 市場範圍 | |
|---|---|
| 開始年份 | 2025 |
| 預測年份 | 2026-2035 |
| 起始值 | 299億美元 |
| 預測金額 | 2515億美元 |
| 複合年成長率 | 23.8% |
預計到2025年,硬體市場規模將達到166億美元,這主要得益於遊戲、擴增實境(AR)、虛擬實境(VR)和汽車應用領域對高精度感測器、攝影機和運動檢測器的需求不斷成長。供應商正致力於開發耐用且精準的硬體,以滿足消費性電子和智慧家居技術日益成長的需求。隨著手勢姿態辨識技術被整合到智慧家電、穿戴式裝置和車載系統等日常設備中,硬體的普及率預計將迅速提高。為了滿足不斷擴大的AR/VR和汽車市場的需求,各公司正在投資研發更小巧、更堅固耐用且精度更高的感測器。
預計到2025年,基於觸控的手勢姿態辨識市場規模將達到155億美元。智慧型手機、平板電腦、自助服務終端和工業控制面板等觸控螢幕設備的普及,推動了對精準、直覺的觸控作業系統的需求。這項技術提升了遊戲機、ATM、汽車儀錶板和家用電子電器的易用性,增強了使用者體驗和參與度。製造商正致力於提高感測器的反應速度、耐用性和成本效益,同時確保其在工業和消費應用中的準確性。觸控介面正逐漸成為所有設備的標配功能,推動著全球範圍內的普及,並加速了手勢姿態辨識在整個數位生態系統中的整合。
預計到2025年,北美手勢姿態辨識市佔率將達到33.5%。該地區受益於強大的數位基礎設施、人工智慧的早期應用以及研究機構、技術提供商和商業企業之間的積極合作。零售商、商業設施和智慧公共基礎設施正在擴大手勢識別系統的應用範圍,以提升客戶參與和營運效率。北美也高度重視以隱私為中心的人工智慧和邊緣運算,打造出既能保持高精度和高效能,又能滿足嚴格監管要求的解決方案。政府對人工智慧驅動技術發展的支持,進一步加速了企業和消費者領域手勢姿態辨識解決方案的採用和商業化。
目錄
第1章:調查方法和範圍
第2章執行摘要
第3章業界考察
- 生態系分析
- 供應商情況
- 利潤率
- 成本結構
- 每個階段增加的價值
- 影響價值鏈的因素
- 中斷
- 影響產業的因素
- 促進因素
- 非接觸式互動的需求日益成長
- 智慧零售和數位商店的成長
- 電腦視覺和人工智慧的進展
- 監視錄影機基礎設施的使用日益增多
- 對客戶行為分析的關注日益增加
- 陷阱與挑戰
- 隱私和倫理問題
- 高昂的計算成本和實施成本
- 促進因素
- 成長潛力分析
- 監理情勢
- 北美洲
- 歐洲
- 亞太地區
- 拉丁美洲
- 中東和非洲
- 波特的分析
- PESTEL 分析
- 科技與創新趨勢
- 當前技術趨勢
- 新興技術
- 新興經營模式
- 合規要求
- 供應鏈韌性
- 地緣政治分析
第4章 競爭情勢
- 介紹
- 企業市佔率分析
- 按地區
- 北美洲
- 歐洲
- 亞太地區
- 拉丁美洲
- 中東和非洲
- 市場集中度分析
- 按地區
- 主要企業的競爭標竿分析
- 產品系列比較
- 產品線的廣度
- 科技
- 創新
- 區域企業發展比較
- 全球擴張分析
- 服務網路覆蓋
- 按地區分類的市場滲透率
- 競爭定位矩陣
- 領導企業
- 受讓人
- 追蹤者
- 小眾玩家
- 產品系列比較
- 2022-2025 年重大發展
- 併購
- 夥伴關係與合作
- 技術進步
- 擴張和投資策略
- 永續發展計劃
- 數位轉型計劃
- 新興/Start-Ups競爭對手的發展趨勢
第5章 市場估計與預測:依組件分類,2022-2035年
- 硬體
- 感應器
- 相機
- 控制器
- 其他
- 軟體
第6章 市場估計與預測:依技術分類,2022-2035年
- 基於觸摸的手勢姿態辨識
- 多點觸控系統
- 動作感測器
- 非接觸手勢姿態辨識
- 超音波
- 紅外線的
- 電容式/電場式
- QR 圖相機
- 3D相機
- 語音辨識
- 其他
第7章 市場估計與預測:依類型分類,2022-2035年
- 主要趨勢
- 手部和手指手勢姿態辨識
- 臉部手勢姿態辨識
- 語音手勢姿態辨識
- 眼動手手勢姿態辨識
- 身體動作手勢姿態辨識
第8章 市場估算與預測:依認證方法分類,2022-2035年
- 主要趨勢
- 單因素身份驗證
- 多因素身份驗證
第9章 市場估計與預測:依最終用途產業分類,2022-2035年
- 主要趨勢
- 車
- 照明系統
- HUD
- 生物識別訪問
- 其他
- 家用電子電器
- 智慧型手機
- 筆記型電腦和平板電腦
- 遊戲機
- 智慧電視
- 機上盒
- 頭戴式顯示器(HMD)
- 其他
- 衛生保健
- 手語
- 實驗室/手術室
- 診斷
- 其他
- 廣告與傳播
- 飯店業
- 其他
第10章 市場估價與預測:依地區分類,2022-2035年
- 北美洲
- 美國
- 加拿大
- 歐洲
- 德國
- 英國
- 法國
- 西班牙
- 義大利
- 荷蘭
- 亞太地區
- 中國
- 印度
- 日本
- 澳洲
- 韓國
- 拉丁美洲
- 巴西
- 墨西哥
- 阿根廷
- 中東和非洲
- 沙烏地阿拉伯
- 南非
- 阿拉伯聯合大公國
第11章:公司簡介
- 主要企業
- Apple Inc.
- Google LLC
- Microsoft Corporation
- Intel Corporation
- Qualcomm Technologies, Inc.
- 按地區分類的主要企業
- 北美洲
- Microchip Technology Inc.
- Synaptics Incorporated
- GestureTek
- 歐洲
- Crunchfish
- Elliptic Labs
- Pyreos
- 亞太地區
- Infineon
- EyeSight Technologies
- SoftKinetic(Sony Depthsensing Solutions)
- 北美洲
- 小眾/顛覆者
- Leap Motion(UltraHaptics)
- ManoMotion
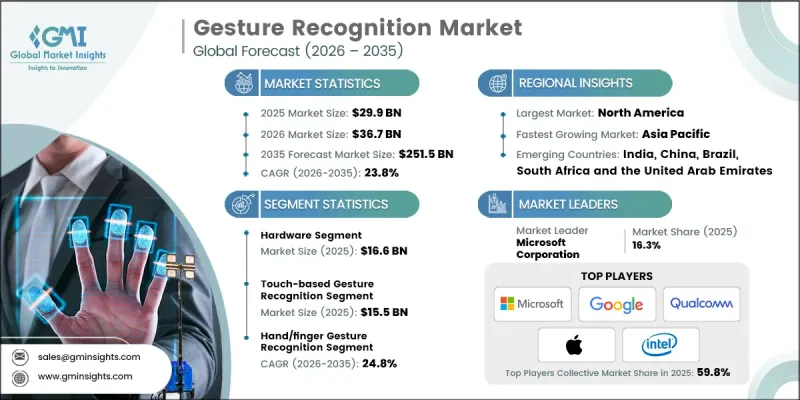
The Global Gesture Recognition Market was valued at USD 29.9 billion in 2025 and is estimated to grow at a CAGR of 23.8% to reach USD 251.5 billion in 2035.
Market growth is driven by the rising preference for touchless interaction, the growth of smart retail and digital stores, advancements in computer vision and artificial intelligence, and increased deployment of camera and surveillance infrastructure. Organizations and governments are prioritizing non-contact operations to enhance public health and safety, which accelerated demand during the COVID-19 pandemic. Gesture recognition technology supports touch-free kiosks, digital signage, and service counters, minimizing physical contact in public spaces. Governments are integrating these solutions into smart public infrastructure, while AI and automation are central to national digital transformation agendas, encouraging both research adoption and commercialization. Increasing use in sectors like healthcare, retail, education, and automotive is fueling demand for advanced gesture-based human-machine interfaces.
| Market Scope | |
|---|---|
| Start Year | 2025 |
| Forecast Year | 2026-2035 |
| Start Value | $29.9 Billion |
| Forecast Value | $251.5 Billion |
| CAGR | 23.8% |
The hardware segment reached USD 16.6 billion in 2025, fueled by the increasing demand for high-precision sensors, cameras, and motion detectors across gaming, augmented reality (AR), virtual reality (VR), and automotive applications. Vendors are focusing on developing durable and accurate hardware to meet rising expectations in consumer electronics and smart home technologies. As gesture recognition becomes more integrated into everyday devices, including smart appliances, wearables, and in-vehicle systems, hardware adoption is expected to rise sharply. Companies are investing in sensor miniaturization, rugged designs, and improved accuracy to serve the expanding AR/VR and automotive markets.
The touch-based gesture recognition segment accounted for USD 15.5 billion in 2025. Widespread adoption of touchscreen-enabled devices such as smartphones, tablets, kiosks, and industrial control panels is driving demand for precise and intuitive touch-based interaction systems. This technology enhances the usability of gaming consoles, ATMs, automotive dashboards, and consumer electronics, improving user experience and engagement. Manufacturers are concentrating on improving sensor responsiveness, durability, and cost-effectiveness while ensuring accuracy for both industrial and consumer applications. Touch-based interfaces are becoming a standard feature across devices, fueling adoption globally and increasing the integration of gesture recognition across digital ecosystems.
North America Gesture Recognition Market held 33.5% share in 2025. The region benefits from strong digital infrastructure, early AI adoption, and active collaboration between research institutions, technology providers, and commercial enterprises. Retailers, commercial spaces, and smart public infrastructure increasingly deploy gesture-based systems to improve engagement and operational efficiency. North America also emphasizes privacy-focused AI and edge computing, enabling solutions that comply with stringent regulatory requirements while maintaining high accuracy and performance. Government support for AI-driven technology development further accelerates the adoption and commercialization of gesture recognition solutions in both enterprise and consumer segments.
Leading players in the Global Gesture Recognition Market include Apple Inc., Crunchfish, Elliptic Labs, EyeSight Technologies, GestureTek, Google LLC, Infineon, Intel Corporation, Leap Motion (UltraHaptics), ManoMotion, Microchip Technology Inc., Microsoft Corporation, Pyreos, Qualcomm Technologies, Inc., SoftKinetic (Sony Depthsensing Solutions), and Synaptics Incorporated. Companies in the Global Gesture Recognition Market are strengthening their presence by investing heavily in R&D to enhance sensor precision, reduce latency, and improve AI-driven gesture interpretation. Strategic collaborations with AR/VR, automotive, and consumer electronics firms allow technology providers to integrate solutions across multiple platforms. Firms are also focusing on expanding distribution channels, entering emerging markets, and delivering customized solutions for specific industry needs. Continuous hardware optimization, software platform updates, and edge computing integration enhance performance while maintaining cost efficiency.
Table of Contents
Chapter 1 Methodology and Scope
- 1.1 Market scope and definition
- 1.2 Research design
- 1.2.1 Research approach
- 1.2.2 Data collection methods
- 1.3 Data mining sources
- 1.3.1 Global
- 1.3.2 Regional/Country
- 1.4 Base estimates and calculations
- 1.4.1 Base year calculation
- 1.4.2 Key trends for market estimation
- 1.5 Primary research and validation
- 1.5.1 Primary sources
- 1.6 Forecast model
- 1.7 Research assumptions and limitations
Chapter 2 Executive Summary
- 2.1 Industry 360° synopsis
- 2.2 Key market trends
- 2.2.1 Component trends
- 2.2.2 Technology trends
- 2.2.3 Type trends
- 2.2.4 Authentication type trends
- 2.2.5 Application trends
- 2.2.6 End-use industry trends
- 2.2.7 Regional trends
- 2.3 TAM Analysis, 2026 - 2035 (USD Million)
- 2.4 CXO perspectives: Strategic imperatives
Chapter 3 Industry Insights
- 3.1 Industry ecosystem analysis
- 3.1.1 Supplier landscape
- 3.1.2 Profit margin
- 3.1.3 Cost structure
- 3.1.4 Value addition at each stage
- 3.1.5 Factor affecting the value chain
- 3.1.6 Disruptions
- 3.2 Industry impact forces
- 3.2.1 Growth drivers
- 3.2.1.1 Rising demand for touchless interaction
- 3.2.1.2 Growth of smart retail and digital stores
- 3.2.1.3 Advancements in computer vision and artificial intelligence
- 3.2.1.4 Increased use of surveillance and camera infrastructure
- 3.2.1.5 Rising focus on customer behavior analytics
- 3.2.2 Pitfalls and challenges
- 3.2.2.1 Privacy and ethical concerns
- 3.2.2.2 High computational and implementation cost
- 3.2.1 Growth drivers
- 3.3 Growth potential analysis
- 3.4 Regulatory landscape
- 3.4.1 North America
- 3.4.2 Europe
- 3.4.3 Asia Pacific
- 3.4.4 Latin America
- 3.4.5 Middle East & Africa
- 3.5 Porter’s analysis
- 3.6 PESTEL analysis
- 3.7 Technology and Innovation landscape
- 3.7.1 Current technological trends
- 3.7.2 Emerging technologies
- 3.8 Emerging Business Models
- 3.9 Compliance Requirements
- 3.10 Supply Chain Resilience
- 3.11 Geopolitical Analysis
Chapter 4 Competitive Landscape, 2025
- 4.1 Introduction
- 4.2 Company market share analysis
- 4.2.1 By region
- 4.2.1.1 North America
- 4.2.1.2 Europe
- 4.2.1.3 Asia Pacific
- 4.2.1.4 Latin America
- 4.2.1.5 Middle East & Africa
- 4.2.2 Market concentration analysis
- 4.2.1 By region
- 4.3 Competitive benchmarking of key players
- 4.3.1 Product portfolio comparison
- 4.3.1.1 Product range breadth
- 4.3.1.2 Technology
- 4.3.1.3 Innovation
- 4.3.2 Geographic presence comparison
- 4.3.2.1 Global footprint analysis
- 4.3.2.2 Service network coverage
- 4.3.2.3 Market penetration by region
- 4.3.3 Competitive positioning matrix
- 4.3.3.1 Leaders
- 4.3.3.2 Challengers
- 4.3.3.3 Followers
- 4.3.3.4 Niche players
- 4.3.1 Product portfolio comparison
- 4.4 Key developments, 2022-2025
- 4.4.1 Mergers and acquisitions
- 4.4.2 Partnerships and collaborations
- 4.4.3 Technological advancements
- 4.4.4 Expansion and investment strategies
- 4.4.5 Sustainability initiatives
- 4.4.6 Digital transformation initiatives
- 4.5 Emerging/ startup competitors landscape
Chapter 5 Market Estimates and Forecast, By Component, 2022 - 2035 (USD Million)
- 5.1 Key trends
- 5.2 Hardware
- 5.2.1 Sensors
- 5.2.2 Cameras
- 5.2.3 Controllers
- 5.2.4 Others
- 5.3 Software
Chapter 6 Market Estimates and Forecast, By Technology, 2022 - 2035 (USD Million)
- 6.1 Key trends
- 6.2 Touch-based gesture recognition
- 6.2.1 Multi-touch system
- 6.2.2 Motion sensors
- 6.3 Touchless gesture recognition
- 6.3.1 Ultrasonic
- 6.3.2 Infrared
- 6.3.3 Capacitive/electric field
- 6.3.4 2D cameras
- 6.3.5 3D cameras
- 6.3.6 Voice recognition
- 6.3.7 Others
Chapter 7 Market Estimates and Forecast, By Type, 2022 - 2035 (USD Million)
- 7.1 Key Trends
- 7.2 Hand/finger gesture recognition
- 7.3 Facial gesture recognition
- 7.4 Voice gesture recognition
- 7.5 Eye movement gesture recognition
- 7.6 Body movement gesture recognition
Chapter 8 Market Estimates and Forecast, By Authentication, 2022 - 2035 (USD Million)
- 8.1 Key Trends
- 8.2 Single-factor authentication
- 8.3 Multi-factor authentication
Chapter 9 Market Estimates and Forecast, By End-Use Industry, 2022 - 2035 (USD Million)
- 9.1 Key Trends
- 9.2 Automotive
- 9.2.1 Lighting system
- 9.2.2 HUD
- 9.2.3 Biometric access
- 9.2.4 Others
- 9.3 Consumer electronics
- 9.3.1 Smartphone
- 9.3.2 Laptops & tablets
- 9.3.3 Gaming console
- 9.3.4 Smart TV
- 9.3.5 Set-top box
- 9.3.6 Head-mount display (HMD)
- 9.3.7 Others
- 9.4 Healthcare
- 9.4.1 Sign language
- 9.4.2 Lab & operating rooms
- 9.4.3 Diagnosis
- 9.4.4 Others
- 9.5 Advertisement & communication
- 9.6 Hospitality
- 9.7 Others
Chapter 10 Market Estimates and Forecast, By Region, 2022 - 2035 (USD Million)
- 10.1 Key trends
- 10.2 North America
- 10.2.1 U.S.
- 10.2.2 Canada
- 10.3 Europe
- 10.3.1 Germany
- 10.3.2 UK
- 10.3.3 France
- 10.3.4 Spain
- 10.3.5 Italy
- 10.3.6 Netherlands
- 10.4 Asia Pacific
- 10.4.1 China
- 10.4.2 India
- 10.4.3 Japan
- 10.4.4 Australia
- 10.4.5 South Korea
- 10.5 Latin America
- 10.5.1 Brazil
- 10.5.2 Mexico
- 10.5.3 Argentina
- 10.6 Middle East and Africa
- 10.6.1 Saudi Arabia
- 10.6.2 South Africa
- 10.6.3 UAE
Chapter 11 Company Profiles
- 11.1 Global Key Players
- 11.1.1 Apple Inc.
- 11.1.2 Google LLC
- 11.1.3 Microsoft Corporation
- 11.1.4 Intel Corporation
- 11.1.5 Qualcomm Technologies, Inc.
- 11.2 Regional Key Players
- 11.2.1 North America
- 11.2.1.1 Microchip Technology Inc.
- 11.2.1.2 Synaptics Incorporated
- 11.2.1.3 GestureTek
- 11.2.2 Europe
- 11.2.2.1 Crunchfish
- 11.2.2.2 Elliptic Labs
- 11.2.2.3 Pyreos
- 11.2.3 Asia Pacific
- 11.2.3.1 Infineon
- 11.2.3.2 EyeSight Technologies
- 11.2.3.3 SoftKinetic (Sony Depthsensing Solutions)
- 11.2.1 North America
- 11.3 Niche / Disruptors
- 11.3.1 Leap Motion (UltraHaptics)
- 11.3.2 ManoMotion
 手勢姿態辨識市場規模、佔有率、趨勢和預測:按技術、終端用戶產業和地區分類,2026-2034 年
 2026年全球汽車手勢姿態辨識市場報告2026年全球汽車手勢姿態辨識系統市場報告
 汽車手勢姿態辨識系統市場:按車輛類型、組件、技術、應用和最終用戶分類-2026-2032年全球市場預測
 全球手勢姿態辨識市場規模、佔有率、趨勢和成長分析報告(2026-2034)手勢姿態辨識市場規模、佔有率、成長及全球產業分析:按類型、應用和地區分類的洞察,2026-2034 年預測2026年全球桌面和可攜式個人電腦(PC)手勢姿態辨識技術市場報告
 汽車手勢姿態辨識市場-全球產業規模、佔有率、趨勢、機會及預測(依技術、應用、區域及競爭格局分類,2021-2031年)
 手勢姿態辨識市場規模、佔有率和成長分析(按組件、技術、類型、認證方法、最終用途和地區分類)-2026-2033年產業預測
 汽車手勢姿態辨識市場規模、佔有率和成長分析(按類型、產品類型、分銷管道、應用、技術、產品和地區分類)—產業預測(2026-2033 年)