


 |
市場調查報告書
商品編碼
1959545
貨物掃描設備市場機會、成長要素、產業趨勢分析及2026年至2035年預測。Cargo Scanning Equipment Market Opportunity, Growth Drivers, Industry Trend Analysis, and Forecast 2026 - 2035 |
||||||
2025 年全球貨物掃描設備市場價值為 40.5 億美元,預計到 2035 年將達到 83.7 億美元,年複合成長率為 7.7%。
全球貿易的快速擴張、貨櫃貨運量的激增以及日益成長的全球安全隱患,共同推動了這個市場的成長。各國政府和運輸管理部門正大力推行更嚴格的海關、邊境管制和港口安全法規,加速了3D X光掃描儀和電腦斷層掃描(CT)掃描儀等先進影像技術的應用。人工智慧(AI)和自動化技術在貨物檢查中的應用,透過提高準確性、減少人為錯誤和提升處理能力,進一步促進了市場成長。隨著安全威脅的不斷演變,各國政府正大力投資研發能夠偵測複雜隱蔽手段、保護關鍵基礎設施並保障公共的下一代掃描系統。在增強型數據分析和即時監控的支援下,主動風險管理模式的轉變,持續推動全球對技術主導高效能貨物掃描解決方案的需求。
| 市場範圍 | |
|---|---|
| 開始年份 | 2025 |
| 預測年份 | 2026-2035 |
| 起始值 | 40.5億美元 |
| 預測金額 | 83.7億美元 |
| 複合年成長率 | 7.7% |
預計到2025年,小小包裹市場規模將達到19億美元。隨著電子商務的快速發展,迫切需要對小包裹進行快速、非侵入性的檢查,以確保可靠的交付並符合監管要求。小件包裹中走私貨、違禁品和非法物質的風險日益增加,迫使物流和郵政服務提供者部署自動化、高吞吐量的掃描系統。設備製造商正致力於開發緊湊型、高速掃描解決方案,以最佳化應用於末端配送中心和高容量小包裹分類中心。這些系統必須在不影響營運效率的前提下,提供可靠的檢測結果,同時最大限度地減少對供應鏈營運的影響。
預計到2025年,X光掃描儀市場規模將達14億美元。機場、港口和海關部門正擴大採用先進的X光掃描儀,對各類貨物進行快速、無損的檢查。多重視角和3D X光成像技術的進步提高了偵測精度,減少了誤報,並提升了操作人員的工作效率。製造商正在投資研發具備自動威脅偵測功能的高解析度X光系統,能夠在不影響處理能力或安全標準的前提下,對貨櫃、托盤和散裝貨物進行無縫檢查。
預計到2025年,北美貨物掃描設備市場佔有率將達到33.9%,這主要得益於其龐大的貿易量、先進的港口和邊境基礎設施以及嚴格的法規結構。海關和國防安全保障機構正在海港、機場和陸地邊境實施全面的篩檢程序,從而對具備卓越威脅偵測能力的自動化、高通量掃描設備產生了持續的需求。北美當局正在加速整合人工智慧驅動的影像處理和分析技術,以支援基於風險的貨物檢查,在保持嚴格安全標準的同時,加快清關速度。該地區在貨物檢查操作的創新和效率方面持續引領行業標竿。
目錄
第1章:調查方法和範圍
第2章執行摘要
第3章業界考察
- 生態系分析
- 供應商情況
- 利潤率
- 成本結構
- 每個階段增加的價值
- 影響價值鏈的因素
- 中斷
- 影響產業的因素
- 促進因素
- 全球貿易量和貨櫃貨運量增加
- 安全威脅和走私活動日益增多
- 更嚴格的海關、邊境管制和港口安全規定
- 引進先進影像技術(CT、3D X光)
- 將人工智慧和自動化技術應用於貨物檢驗
- 挑戰與困難
- 掃描系統高昂的購置成本與維修成本
- 營運複雜性和對熟練勞動力的需求
- 促進因素
- 成長潛力分析
- 監理情勢
- 波特五力分析
- PESTEL 分析
- 科技與創新趨勢
- 當前技術趨勢
- 新興技術
- 新興經營模式
- 合規要求
- 供應鏈韌性
- 地緣政治分析
- 勞動力分析
- 數位轉型
- 併購和策略聯盟的趨勢
- 風險評估與管理
- 重大合約採購範例(2022-2025 年)
第4章 競爭情勢
- 介紹
- 企業市佔率分析
- 按地區
- 市場集中度分析
- 主要企業的競爭標竿分析
- 產品系列比較
- 產品線的廣度
- 科技
- 創新
- 地理位置比較
- 全球擴張分析
- 服務網路覆蓋
- 按地區分類的市場滲透率
- 競爭定位矩陣
- 領導企業
- 受讓人
- 追蹤者
- 小眾玩家
- 戰略展望矩陣
- 產品系列比較
- 2022-2025 年重大發展
- 併購
- 夥伴關係與合作
- 技術進步
- 擴張和投資策略
- 永續發展計劃
- 數位轉型計劃
- 新興/Start-Ups競爭對手的發展趨勢
第5章 市場估算與預測:依設備類型分類,2022-2035年
- 藥物微量檢測裝置
- 非電腦斷層掃描器
- X光掃描儀
- 爆炸物微量檢測裝置(ETD)
- 輻射檢測器
- 其他
第6章 市場估價與預測:依貨物尺寸分類,2022-2035年
- 小小包裹
- 散貨
- 超大貨物
第7章 市場估計與預測:依應用領域分類,2022-2035年
- 主要趨勢
- 飛機場
- 火車站
- 邊境管制
- 物流/運輸
- 工業和製造設施
- 其他
第8章 市場估計與預測:依地區分類,2022-2035年
- 北美洲
- 美國
- 加拿大
- 歐洲
- 德國
- 英國
- 法國
- 西班牙
- 義大利
- 荷蘭
- 亞太地區
- 中國
- 印度
- 日本
- 澳洲
- 韓國
- 拉丁美洲
- 巴西
- 墨西哥
- 阿根廷
- 中東和非洲
- 沙烏地阿拉伯
- 南非
- 阿拉伯聯合大公國
第9章:公司簡介
- 主要企業
- OSI Systems
- Smiths Detection Group Ltd.
- Leidos Holdings, Inc.
- Nuctech Company Limited
- 按地區分類的主要企業
- 北美洲
- Astrophysics, Inc.
- Autoclear LLC
- TODD Research
- 歐洲
- CEIA
- Gilardoni SpA
- Braun & Co. Limited
- 亞太地區
- LINEV Systems
- 北美洲
- 小眾/顛覆者
- Westminster Group Plc
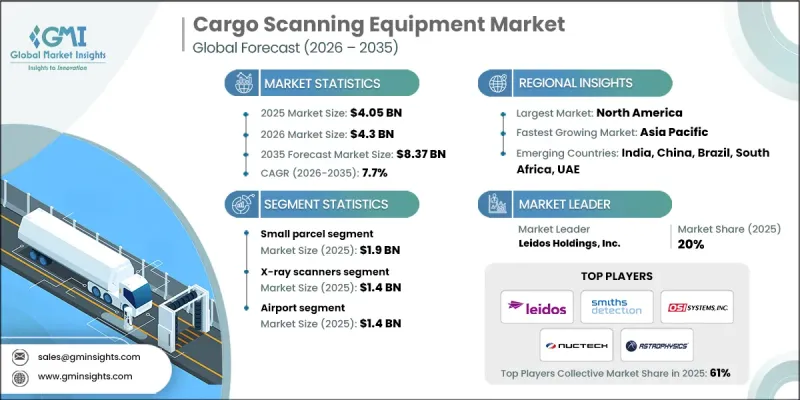
The Global Cargo Scanning Equipment Market was valued at USD 4.05 billion in 2025 and is estimated to grow at a CAGR of 7.7% to reach USD 8.37 billion by 2035.
The market is driven by the rapid growth in global trade, surging containerized cargo volumes, and rising security concerns worldwide. Governments and transport authorities are increasingly enforcing stricter customs, border control, and port security regulations, pushing the adoption of advanced imaging technologies such as 3D X-ray and computed tomography (CT) scanners. Integration of artificial intelligence and automation in cargo inspection is further accelerating market growth by enhancing accuracy, reducing human error, and increasing throughput. As security threats evolve, authorities are investing heavily in next-generation scanning systems capable of detecting sophisticated concealment methods, protecting critical infrastructure, and ensuring public safety. The shift toward proactive risk management, supported by enhanced data analytics and real-time monitoring, continues to drive demand for technology-driven, high-performance cargo scanning solutions globally.
| Market Scope | |
|---|---|
| Start Year | 2025 |
| Forecast Year | 2026-2035 |
| Start Value | $4.05 Billion |
| Forecast Value | $8.37 Billion |
| CAGR | 7.7% |
The small parcel segment reached USD 1.9 billion in 2025. Rapid growth in e-commerce has created an urgent need for fast, non-intrusive screening of small packages to ensure timely deliveries while maintaining regulatory compliance. The rising risk of contraband, prohibited items, and illegal substances in small shipments has compelled logistics and postal service providers to adopt automated, high-throughput scanning systems. Equipment manufacturers are focusing on developing compact, high-speed scanning solutions optimized for last-mile distribution hubs and high-volume parcel sorting centers. These systems must provide reliable detection without slowing operational efficiency, while also ensuring minimal disruption to supply chain operations.
The X-ray scanners segment accounted for USD 1.4 billion in 2025. Airports, seaports, and customs authorities are increasingly deploying advanced X-ray scanners to perform rapid, non-intrusive inspections of diverse cargo types. Technological improvements in multi-view and 3D X-ray imaging have enhanced detection accuracy, reduced false positives, and increased operator efficiency. Manufacturers are investing in high-resolution X-ray systems equipped with automated threat detection capabilities, enabling seamless inspection of containers, pallets, and bulk cargo without compromising throughput or security standards.
North America Cargo Scanning Equipment Market held 33.9% share in 2025 due to high trade volumes, advanced port and border infrastructure, and strict regulatory frameworks. Customs and homeland security agencies employ comprehensive screening protocols across maritime ports, airports, and land borders, creating steady demand for automated, high throughput scanning equipment with superior threat detection capabilities. North American authorities are increasingly integrating AI-driven imaging and analytics to support risk-based cargo inspections, allowing faster clearance while maintaining robust security standards. The region continues to set benchmarks for innovation and efficiency in cargo screening operations.
Key players in the Global Cargo Scanning Equipment Market include Autoclear LLC, OSI Systems, Smiths Detection Group Ltd., Astrophysics, Inc., Gilardoni S.p.A., LINEV Systems, TODD Research, Leidos Holdings, Inc., CEIA, Braun & Co. Limited, Nuctech Company Limited, and Westminster Group Plc. Companies in the cargo scanning equipment market are pursuing several strategies to strengthen their market presence. Continuous innovation in imaging technologies, such as 3D and CT scanners with AI-assisted threat detection, is a core focus. Firms are forming strategic partnerships with ports, airports, and logistics providers to expand deployment and service networks. Investment in research and development enhances system reliability, speed, and accuracy to meet evolving regulatory requirements. Manufacturers are also emphasizing modular, scalable systems to accommodate different cargo sizes and inspection environments.
Table of Contents
Chapter 1 Methodology and Scope
- 1.1 Market scope and definition
- 1.2 Research design
- 1.2.1 Research approach
- 1.2.2 Data collection methods
- 1.3 Data mining sources
- 1.3.1 Global
- 1.3.2 Regional/Country
- 1.4 Base estimates and calculations
- 1.4.1 Base year calculation
- 1.4.2 Key trends for market estimation
- 1.5 Primary research and validation
- 1.5.1 Primary sources
- 1.6 Forecast model
- 1.7 Research assumptions and limitations
Chapter 2 Executive Summary
- 2.1 Industry 360° synopsis
- 2.2 Key market trends
- 2.2.1 Equipment type trends
- 2.2.2 Cargo size trends
- 2.2.3 End-use trends
- 2.2.4 Regional trends
- 2.3 TAM Analysis, 2026 - 2035 (USD Million)
- 2.4 CXO perspectives: Strategic imperatives
- 2.4.1 Executive decision points
- 2.4.2 Critical success factors
- 2.5 Future outlook and strategic recommendations
Chapter 3 Industry Insights
- 3.1 Industry ecosystem analysis
- 3.1.1 Supplier landscape
- 3.1.2 Profit margin
- 3.1.3 Cost structure
- 3.1.4 Value addition at each stage
- 3.1.5 Factor affecting the value chain
- 3.1.6 Disruptions
- 3.2 Industry impact forces
- 3.2.1 Growth drivers
- 3.2.1.1 Rising global trade and containerized cargo volumes
- 3.2.1.2 Increasing security threats and smuggling activities
- 3.2.1.3 Stricter customs, border control, and port security regulations
- 3.2.1.4 Adoption of advanced imaging technologies (CT, 3D x-ray)
- 3.2.1.5 Integration of AI and automation in cargo inspection
- 3.2.2 Pitfalls and challenges
- 3.2.2.1 High capital and maintenance costs of scanning systems
- 3.2.2.2 Operational complexity and skilled workforce requirements
- 3.2.1 Growth drivers
- 3.3 Growth potential analysis
- 3.4 Regulatory landscape
- 3.4.1 North America
- 3.4.2 Europe
- 3.4.3 Asia Pacific
- 3.4.4 Latin America
- 3.4.5 Middle East & Africa
- 3.5 Porter's analysis
- 3.6 PESTEL analysis
- 3.7 Technology and Innovation landscape
- 3.7.1 Current technological trends
- 3.7.2 Emerging technologies
- 3.8 Emerging Business Models
- 3.9 Compliance Requirements
- 3.10 Supply Chain Resilience
- 3.11 Geopolitical Analysis
- 3.12 Workforce Analysis
- 3.13 Digital Transformation
- 3.14 Mergers, Acquisitions, and Strategic Partnerships Landscape
- 3.15 Risk Assessment and Management
- 3.16 Major Contract Awards (2022 - 2025)
Chapter 4 Competitive Landscape, 2025
- 4.1 Introduction
- 4.2 Company market share analysis
- 4.2.1 By region
- 4.2.1.1 North America
- 4.2.1.2 Europe
- 4.2.1.3 Asia Pacific
- 4.2.1.4 Latin America
- 4.2.1.5 Middle East & Africa
- 4.2.2 Market concentration analysis
- 4.2.1 By region
- 4.3 Competitive benchmarking of key players
- 4.3.1 Product portfolio comparison
- 4.3.1.1 Product range breadth
- 4.3.1.2 Technology
- 4.3.1.3 Innovation
- 4.3.2 Geographic presence comparison
- 4.3.2.1 Global footprint analysis
- 4.3.2.2 Service network coverage
- 4.3.2.3 Market penetration by region
- 4.3.3 Competitive positioning matrix
- 4.3.3.1 Leaders
- 4.3.3.2 Challengers
- 4.3.3.3 Followers
- 4.3.3.4 Niche players
- 4.3.4 Strategic outlook matrix
- 4.3.1 Product portfolio comparison
- 4.4 Key developments, 2022-2025
- 4.4.1 Mergers and acquisitions
- 4.4.2 Partnerships and collaborations
- 4.4.3 Technological advancements
- 4.4.4 Expansion and investment strategies
- 4.4.5 Sustainability initiatives
- 4.4.6 Digital transformation initiatives
- 4.5 Emerging/ startup competitors landscape
Chapter 5 Market Estimates and Forecast, By Equipment Type, 2022 - 2035 (USD Million)
- 5.1 Key trends
- 5.2 Narcotics Trace Detectors
- 5.3 Non-computed Tomography
- 5.4 X-ray Scanners
- 5.5 Explosive Trace Detectors (ETDs)
- 5.6 Radiation Detectors
- 5.7 Others
Chapter 6 Market Estimates and Forecast, By Cargo Size, 2022 - 2035 (USD Million)
- 6.1 Key trends
- 6.2 Small Parcels
- 6.3 Break Pallet Cargo
- 6.4 Oversized Cargo
Chapter 7 Market Estimates and Forecast, By End-Use, 2022 - 2035 (USD Million)
- 7.1 Key Trends
- 7.2 Airports
- 7.3 Railway Station
- 7.4 Border Control
- 7.5 Logistics and Transportation
- 7.6 Industrial and Manufacturing facilities
- 7.7 Others
Chapter 8 Market Estimates and Forecast, By Region, 2022 - 2035 (USD Million)
- 8.1 Key trends
- 8.2 North America
- 8.2.1 U.S.
- 8.2.2 Canada
- 8.3 Europe
- 8.3.1 Germany
- 8.3.2 UK
- 8.3.3 France
- 8.3.4 Spain
- 8.3.5 Italy
- 8.3.6 Netherlands
- 8.4 Asia Pacific
- 8.4.1 China
- 8.4.2 India
- 8.4.3 Japan
- 8.4.4 Australia
- 8.4.5 South Korea
- 8.5 Latin America
- 8.5.1 Brazil
- 8.5.2 Mexico
- 8.5.3 Argentina
- 8.6 Middle East and Africa
- 8.6.1 Saudi Arabia
- 8.6.2 South Africa
- 8.6.3 UAE
Chapter 9 Company Profiles
- 9.1 Global Key Players
- 9.1.1 OSI Systems
- 9.1.2 Smiths Detection Group Ltd.
- 9.1.3 Leidos Holdings, Inc.
- 9.1.4 Nuctech Company Limited
- 9.2 Regional Key Players
- 9.2.1 North America
- 9.2.1.1 Astrophysics, Inc.
- 9.2.1.2 Autoclear LLC
- 9.2.1.3 TODD Research
- 9.2.2 Europe
- 9.2.2.1 CEIA
- 9.2.2.2 Gilardoni S.p.A.
- 9.2.2.3 Braun & Co. Limited
- 9.2.3 Asia Pacific
- 9.2.3.1 LINEV Systems
- 9.2.1 North America
- 9.3 Niche / Disruptors
- 9.3.1 Westminster Group Plc
 航空貨物篩檢系統市場:組件、部署形式、技術、應用與最終用途-2026-2032年全球市場預測
 貨物掃描設備市場分析及預測(至2035年):類型、產品類型、服務、技術、組件、應用、最終用戶、設備及部署類型
 2026年全球貨物檢驗設備市場報告
 全球貨物掃描設備市場