


 |
市場調查報告書
商品編碼
1959325
微出行換乘站市場機會、成長要素、產業趨勢分析及預測(2026-2035年)Micromobility Swap Station Market Opportunity, Growth Drivers, Industry Trend Analysis, and Forecast 2026 - 2035 |
||||||
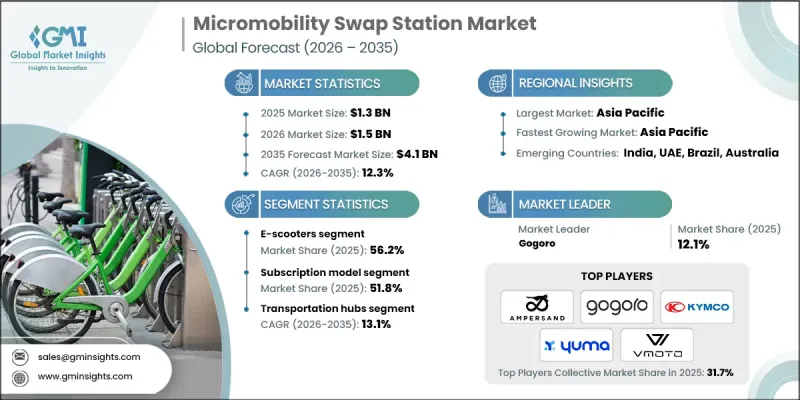
2025 年全球微出行換乘站市場價值 13 億美元,預計到 2035 年將達到 41 億美元,年複合成長率為 12.3%。
快速的都市化和智慧城市發展計畫正在推動共用電動出行解決方案(例如電動Scooter、自行車和輕型機踏車)的普及。這些服務作為內燃機汽車的高效替代方案,正日益受到關注,幫助用戶和車隊營運商降低擁有成本、減少排放氣體並改善最後一公里出行。電池更換基礎設施解決了充電時間和車輛運作等營運難題,已成為實現這項轉型的重要因素。雖然充電基礎設施的匱乏最初限制了電動車的普及,但基礎設施網路的擴展已顯著提升了其可及性和便利性。市場參與企業正透過提供車輛、標準化電池和換電站網路的整合生態系統來鞏固自身地位。與車隊營運商和配送服務供應商的合作有助於實現無縫部署,提高資產利用率,並將電池更換定位為人口密集城市環境中擴充性且商業性吸引力的解決方案。
| 市場範圍 | |
|---|---|
| 開始年份 | 2025 |
| 預測年份 | 2026-2035 |
| 起始金額 | 13億美元 |
| 預測金額 | 41億美元 |
| 複合年成長率 | 12.3% |
預計到2025年,電動Scooter市場將佔據56.2%的市場佔有率,並創造7.377億美元的收入。通勤、共享旅遊和配送服務等領域的高日均使用率持續支撐著該細分市場的主導地位。由於其高運行頻率和極低的停機時間,換電模式非常適合電動Scooter的使用模式。緊湊的電池設計、輕量化的結構和模組化架構進一步加速了換電網路的標準化和大規模部署,從而增強了商業和共用旅遊營運商的需求。
訂閱模式預計在2025年將佔據51.8%的市場佔有率,並在2035年達到23億美元。此模式透過提供可預測的成本和簡化的支付結構,非常適合通勤者和專業騎乘者頻繁使用電池的需求。單次換電通常只需花費約1美元,即可提供約50公里的續航里程。這使得訂閱模式對於頻繁使用電池的用戶來說比按需付費模式更經濟實惠。固定的月費或年費套餐降低了計量型複雜性,並為服務供應商提供了穩定的收入來源。
預計2025年,美國微型出行換電站市場規模將達2.097億美元。在全美範圍內,地方政府和相關人員都在積極支持換電站的建設,以提高共用電動出行網路的效率。電池更換可以減少充電延遲,提高車輛的運轉率,這對於希望最大化日常利用率和收入的快遞員和都市區騎乘者來說尤其重要。
目錄
第1章:調查方法
第2章執行摘要
第3章業界考察
- 生態系分析
- 供應商情況
- 利潤率
- 成本結構
- 每個階段增加的價值
- 影響價值鏈的因素
- 中斷
- 影響產業的因素
- 促進因素
- 智慧城市和城市交通計劃的發展
- 促進零排放交通的環境法規
- 共用微出行服務的擴展
- 快速便捷的電池充電需求日益成長。
- 產業潛在風險與挑戰
- 設立外匯兌換站需要較高的初始資本投入。
- 電網連接和電力管理面臨的挑戰
- 市場機遇
- 將換電站與再生能源來源結合
- 與微型出行車輛操作員和原始設備製造商建立合作關係
- 在交通樞紐和商業區安裝交換站
- 促進因素
- 成長潛力分析
- 監理情勢
- 北美洲
- 美國運輸部(USDOT)
- 美國國家公路交通安全管理局(NHTSA)
- 加州空氣資源委員會(CARB)
- 運輸部
- 歐洲
- 歐盟委員會
- 聯合國歐洲經濟委員會汽車法規協調世界論壇(WP.29)
- 德國聯邦汽車運輸管理局(KBA)
- 英國運輸部
- 法國生態系轉型部
- 亞太地區
- 中華人民共和國工業與資訊化部(工信部)
- 印度公路運輸與公路部(MoRTH)
- 新加坡陸路交通管理局(LTA)
- 澳洲國家運輸委員會(NTC)
- 拉丁美洲
- 巴西國家陸路運輸局(ANTT)
- 巴西汽車工業協會(ANFAVEA)
- 智利交通運輸部
- 中東和非洲
- 杜拜道路與交通管理局(RTA)
- 阿布達比市政和交通運輸部 (DMT)
- 沙烏地阿拉伯交通運輸與物流部
- 南非共和國運輸部
- 北美洲
- 波特的分析
- PESTEL 分析
- 科技與創新趨勢
- 當前技術趨勢
- 新興技術
- 價格趨勢
- 按地區
- 依產品
- 成本細分分析
- 永續性和環境影響
- 環境影響評估
- 社會影響和對當地社區的貢獻
- 公司管治與企業社會責任
- 永續金融和投資趨勢
- 基礎建設發展狀況與城市融合
- 城市基礎設施評估框架
- 與智慧城市合作的機會
- 與公共交通的連接
- 數位基礎設施需求
- 5G和物聯網連接準備情況
- 佈局和位置策略
- 位置標準與決策框架
- 地理資訊系統(GIS)分析
- 交通量與需求密度分佈圖
- 安全保障方面的考慮
- 加盟店與公司直營店模式的比較
- 輸配電網路及電力基礎設施分析
- 電網容量評估
- 並網要求
- 負載管理和尖峰用電調節
- 分散式能源資源的整合
- 電力品質和可靠性
- 案例研究
- 未來前景與機遇
第4章 競爭情勢
- 介紹
- 企業市佔率分析
- 北美洲
- 歐洲
- 亞太地區
- 拉丁美洲
- 中東和非洲
- 主要市場公司的競爭分析
- 競爭定位矩陣
- 戰略展望矩陣
- 主要進展
- 併購
- 夥伴關係與合作
- 新產品發布
- 業務拓展計劃及資金籌措
第5章 市場估計與預測:依解法分類,2022-2035年
- 電池更換站
- 車輛交換站
第6章 市場估價與預測:依車輛類型分類,2022-2035年
- 電動Scooter
- 電動自行車
- 電動輕型輕型機踏車
- 其他
第7章 市場估計與預測:依商業模式分類,2022-2035年
- 訂閱模式
- 薪資互換
- 其他
第8章 市場估算與預測:依發展階段分類,2022-2035年
- 公共設施
- 商業設施
- 住宅區
- 交通樞紐
第9章 市場估計與預測:依應用領域分類,2022-2035年
- 共乘
- 配送/物流
- 個人通勤
- 旅遊和休閒
- 其他
第10章 市場估價與預測:依最終用途分類,2022-2035年
- 共用微出行服務提供者
- 個人消費者
- 車隊營運商
- 政府/市政當局
第11章 市場估價與預測:按地區分類,2022-2035年
- 北美洲
- 美國
- 加拿大
- 歐洲
- 德國
- 英國
- 法國
- 義大利
- 西班牙
- 捷克共和國
- 比利時
- 荷蘭
- 亞太地區
- 中國
- 印度
- 日本
- 韓國
- 澳洲
- 新加坡
- 馬來西亞
- 印尼
- 越南
- 泰國
- 拉丁美洲
- 巴西
- 墨西哥
- 阿根廷
- 哥倫比亞
- 中東和非洲
- 南非
- 沙烏地阿拉伯
- 阿拉伯聯合大公國
第12章:公司簡介
- 世界公司
- Ampersand
- Battery Smart
- Gogoro
- KYMCO
- Silence(ACCIONA)
- Spiro
- SUN Mobility
- Swobbee
- Tycorun
- Vmoto
- Yamaha ENYRING
- Yuma
- 當地公司
- BatteryPool
- ESmito
- Oyika
- Popwheels
- RACEnergy
- Selex Motors
- Swap Energi
- VoltUp
- 新興企業
- ESWAP
- Okai
- Terra Tech
- Tiger New Energy
- Zembo
The Global Micromobility Swap Station Market was valued at USD 1.3 billion in 2025 and is estimated to grow at a CAGR of 12.3% to reach USD 4.1 billion by 2035.
Rapid urbanization and smart city development initiatives are driving the adoption of shared electric mobility solutions, including electric scooters, bicycles, and mopeds. These services are increasingly viewed as efficient alternatives to internal combustion engine vehicles, helping users and fleet operators lower ownership costs, reduce emissions, and improve last-mile connectivity. Battery swapping infrastructure has emerged as a critical enabler for this transition by addressing operational challenges linked to charging time and vehicle downtime. While limited charging availability initially constrained electric vehicle deployment, expanding infrastructure networks have significantly improved accessibility and usability. Market participants are strengthening their positions by offering integrated ecosystems that combine vehicles, standardized batteries, and swap station networks. Partnerships with fleet operators and delivery service providers support seamless adoption and improve asset utilization, positioning battery swapping as a scalable and commercially attractive solution within dense urban environments.
| Market Scope | |
|---|---|
| Start Year | 2025 |
| Forecast Year | 2026-2035 |
| Start Value | $1.3 Billion |
| Forecast Value | $4.1 Billion |
| CAGR | 12.3% |
The e-scooters segment accounted for 56.2% share and generated USD 737.7 million in 2025. Strong daily utilization rates across commuting, shared mobility, and delivery operations continue to support segment leadership. Battery swapping aligns well with e-scooter usage patterns due to minimal downtime requirements and high operational frequency. Compact battery design, lighter weight, and modular architecture further support standardization and large-scale deployment across swap networks, reinforcing demand from commercial and shared mobility operators.
The subscription-based pricing model held a 51.8% share in 2025 and is projected to reach USD 2.3 billion by 2035. This approach aligns with frequent battery usage patterns among commuters and professional riders by offering predictable costs and simplified payment structures. A single battery swap typically costs about USD 1 and provides an operating range of roughly 50 kilometers, making subscriptions more economical for high-frequency users compared to transactional pricing. Fixed monthly or annual plans reduce administrative complexity and support consistent revenue streams for service providers.
U.S. Micromobility Swap Station Market generated USD 209.7 million in 2025. Across the country, municipal authorities and private stakeholders are increasingly supporting swap station deployment to enhance the efficiency of shared electric mobility networks. Battery swapping reduces charging-related delays and improves vehicle availability, which is particularly important for delivery professionals and urban riders seeking to maximize daily usage and earnings.
Key companies active in the Global Micromobility Swap Station Market include Gogoro, SUN Mobility, Battery Smart, Swobbee, Yuma, Tycorun, Spiro, Ampersand, KYMCO, and Vmoto. Companies operating in the micromobility swap station market adopt focused strategies to strengthen market presence and competitive positioning. Many invest heavily in standardized battery platforms to ensure interoperability across multiple vehicle types and brands. Strategic collaborations with city authorities, fleet operators, and mobility service providers help accelerate network deployment and user adoption. Firms also expand station density in high-traffic urban areas to improve convenience and reduce range anxiety. Subscription-based pricing and bundled service offerings enhance customer retention and revenue stability.
Table of Contents
Chapter 1 Methodology
- 1.1 Research approach
- 1.2 Quality commitments
- 1.2.1 GMI AI policy & data integrity commitment
- 1.3 Research trail & confidence scoring
- 1.3.1 Research trail components
- 1.3.2 Scoring components
- 1.4 Data collection
- 1.4.1 Partial list of primary sources
- 1.5 Data mining sources
- 1.5.1 Paid sources
- 1.6 Base estimates and calculations
- 1.6.1 Base year calculation
- 1.7 Forecast model
- 1.8 Research transparency addendum
Chapter 2 Executive Summary
- 2.1 Industry 360° synopsis
- 2.2 Key market trends
- 2.2.1 Regional
- 2.2.2 Solution
- 2.2.3 Vehicle
- 2.2.4 Business Model
- 2.2.5 Deployment
- 2.2.6 Application
- 2.2.7 End Use
- 2.3 TAM analysis, 2026-2035
- 2.4 CXO perspectives: Strategic imperatives
- 2.4.1 Executive decision points
- 2.4.2 Critical success factors
- 2.5 Future outlook and recommendations
Chapter 3 Industry Insights
- 3.1 Industry ecosystem analysis
- 3.1.1 Supplier landscape
- 3.1.2 Profit margin
- 3.1.3 Cost structure
- 3.1.4 Value addition at each stage
- 3.1.5 Factor affecting the value chain
- 3.1.6 Disruptions
- 3.2 Industry impact forces
- 3.2.1 Growth drivers
- 3.2.1.1 Growth of smart city and urban mobility initiatives
- 3.2.1.2 Environmental regulations promoting zero-emission transport
- 3.2.1.3 Expansion of shared micromobility services
- 3.2.1.4 Rising demand for fast and convenient battery charging
- 3.2.2 Industry pitfalls and challenges
- 3.2.2.1 High initial capital investment for swap station deployment
- 3.2.2.2 Grid connectivity and power management challenges
- 3.2.3 Market opportunities
- 3.2.3.1 Integration of swap stations with renewable energy sources
- 3.2.3.2 Partnerships with micromobility fleet operators and oems
- 3.2.3.3 Deployment of swap stations at transit hubs and commercial zones
- 3.2.1 Growth drivers
- 3.3 Growth potential analysis
- 3.4 Regulatory landscape
- 3.4.1 North America
- 3.4.1.1 U.S. Department of Transportation (USDOT)
- 3.4.1.2 National Highway Traffic Safety Administration (NHTSA)
- 3.4.1.3 California Air Resources Board (CARB)
- 3.4.1.4 Transport Canada
- 3.4.2 Europe
- 3.4.2.1 European Commission
- 3.4.2.2 UNECE World Forum for Harmonization of Vehicle Regulations (WP.29)
- 3.4.2.3 German Federal Motor Transport Authority (KBA)
- 3.4.2.4 UK Department for Transport (DfT)
- 3.4.2.5 French Ministry of Ecological Transition
- 3.4.3 Asia Pacific
- 3.4.3.1 Ministry of Industry and Information Technology (MIIT), China
- 3.4.3.2 Ministry of Road Transport and Highways (MoRTH), India
- 3.4.3.3 Land Transport Authority (LTA), Singapore
- 3.4.3.4 National Transport Commission (NTC), Australia
- 3.4.4 Latin America
- 3.4.4.1 Brazilian National Land Transport Agency (ANTT)
- 3.4.4.2 Brazilian Association of Automotive Vehicle Manufacturers (ANFAVEA)
- 3.4.4.3 Chile Ministry of Transport and Telecommunications
- 3.4.5 Middle East & Africa
- 3.4.5.1 Dubai Roads and Transport Authority (RTA)
- 3.4.5.2 Abu Dhabi Department of Municipalities and Transport (DMT)
- 3.4.5.3 Saudi Ministry of Transport & Logistics
- 3.4.5.4 South African Department of Transport
- 3.4.1 North America
- 3.5 Porter’s analysis
- 3.6 PESTEL analysis
- 3.7 Technology and innovation landscape
- 3.7.1 Current technological trends
- 3.7.2 Emerging technologies
- 3.8 Price trends
- 3.8.1 By region
- 3.8.2 By product
- 3.9 Cost breakdown analysis
- 3.10 Sustainability and environmental impact
- 3.10.1 Environmental impact assessment
- 3.10.2 Social impact & community benefits
- 3.10.3 Governance & corporate responsibility
- 3.10.4 Sustainable finance & investment trends
- 3.11 Infrastructure readiness and urban integration
- 3.11.1 Urban infrastructure assessment framework
- 3.11.2 Smart city integration opportunities
- 3.11.3 Public transport connectivity
- 3.11.4 Digital infrastructure requirements
- 3.11.5 5G and IoT connectivity readiness
- 3.12 Placement and location strategy
- 3.12.1 Location selection criteria and decision framework
- 3.12.2 Geographic Information System analysis
- 3.12.3 Foot traffic and demand density mapping
- 3.12.4 Safety and security considerations
- 3.12.5 Franchise versus company-owned location models
- 3.13 Grid and power infrastructure analysis
- 3.13.1 Electrical grid capacity assessment
- 3.13.2 Grid connection requirements
- 3.13.3 Load management and peak shaving
- 3.13.4 Distributed energy resources integration
- 3.13.5 Power quality and reliability
- 3.14 Case studies
- 3.15 Future outlook & opportunities
Chapter 4 Competitive Landscape, 2025
- 4.1 Introduction
- 4.2 Company market share analysis
- 4.2.1 North America
- 4.2.2 Europe
- 4.2.3 Asia Pacific
- 4.2.4 LATAM
- 4.2.5 MEA
- 4.3 Competitive analysis of major market players
- 4.4 Competitive positioning matrix
- 4.5 Strategic outlook matrix
- 4.6 Key developments
- 4.6.1 Mergers & acquisitions
- 4.6.2 Partnerships & collaborations
- 4.6.3 New product launches
- 4.6.4 Expansion plans and funding
Chapter 5 Market Estimates & Forecast, By Solution, 2022 - 2035 ($Mn)
- 5.1 Key trends
- 5.2 Battery swap station
- 5.3 Vehicle swap station
Chapter 6 Market Estimates & Forecast, By Vehicle, 2022 - 2035 ($Mn)
- 6.1 Key trends
- 6.2 E-scooters
- 6.3 E-bikes
- 6.4 E-mopeds
- 6.5 Others
Chapter 7 Market Estimates & Forecast, By Business Model, 2022 - 2035 ($Mn)
- 7.1 Key trends
- 7.2 Subscription model
- 7.3 Pay-per-swap
- 7.4 Others
Chapter 8 Market Estimates & Forecast, By Deployment, 2022 - 2035 ($Mn)
- 8.1 Key trends
- 8.2 Public places
- 8.3 Commercial locations
- 8.4 Residential areas
- 8.5 Transportation hubs
Chapter 9 Market Estimates & Forecast, By Application, 2022 - 2035 ($Mn)
- 9.1 Key trends
- 9.2 Ride sharing
- 9.3 Delivery and logistics
- 9.4 Personal commuting
- 9.5 Tourism and recreation
- 9.6 Others
Chapter 10 Market Estimates & Forecast, By End Use, 2022 - 2035 ($Mn)
- 10.1 Key trends
- 10.2 Shared micromobility operators
- 10.3 Individual consumers
- 10.4 Fleet operators
- 10.5 Government and municipal
Chapter 11 Market Estimates & Forecast, By Region, 2022 - 2035 ($Mn)
- 11.1 Key trends
- 11.2 North America
- 11.2.1 US
- 11.2.2 Canada
- 11.3 Europe
- 11.3.1 Germany
- 11.3.2 UK
- 11.3.3 France
- 11.3.4 Italy
- 11.3.5 Spain
- 11.3.6 Czech Republic
- 11.3.7 Belgium
- 11.3.8 Netherlands
- 11.4 Asia Pacific
- 11.4.1 China
- 11.4.2 India
- 11.4.3 Japan
- 11.4.4 South Korea
- 11.4.5 Australia
- 11.4.6 Singapore
- 11.4.7 Malaysia
- 11.4.8 Indonesia
- 11.4.9 Vietnam
- 11.4.10 Thailand
- 11.5 Latin America
- 11.5.1 Brazil
- 11.5.2 Mexico
- 11.5.3 Argentina
- 11.5.4 Colombia
- 11.6 MEA
- 11.6.1 South Africa
- 11.6.2 Saudi Arabia
- 11.6.3 UAE
Chapter 12 Company Profiles
- 12.1 Global players
- 12.1.1 Ampersand
- 12.1.2 Battery Smart
- 12.1.3 Gogoro
- 12.1.4 KYMCO
- 12.1.5 Silence (ACCIONA)
- 12.1.6 Spiro
- 12.1.7 SUN Mobility
- 12.1.8 Swobbee
- 12.1.9 Tycorun
- 12.1.10 Vmoto
- 12.1.11 Yamaha ENYRING
- 12.1.12 Yuma
- 12.2 Regional players
- 12.2.1 BatteryPool
- 12.2.2 ESmito
- 12.2.3 Oyika
- 12.2.4 Popwheels
- 12.2.5 RACEnergy
- 12.2.6 Selex Motors
- 12.2.7 Swap Energi
- 12.2.8 VoltUp
- 12.3 Emerging players
- 12.3.1 ESWAP
- 12.3.2 Okai
- 12.3.3 Terra Tech
- 12.3.4 Tiger New Energy
- 12.3.5 Zembo
 汽車電池市場:2026-2032年全球市場預測(按電池類型、驅動系統、容量、電壓、電池形狀、回收生命週期、車輛類型和應用分類)
 汽車低壓電池配件及工具市場-歐洲、中東和非洲區域及國家分析:產品、應用、國家分析及預測(2025-2035)
 結構電池市場:按材料類型、應用、最終用戶、電池類型、功率容量、銷售管道和地區分類
 汽車電池市場報告:按電池類型、車輛類型和地區分類(2026-2034 年)
 2026年全球車用電池市場報告固態電池汽車電池市場:依驅動系統、容量範圍、電池材料、車輛類型和銷售管道分類-2026-2032年全球市場預測汽車電池盒市場:依設計類型、材質、車輛類型、最終用戶和銷售管道分類-2026-2032年全球預測
 汽車電池市場:按類型、驅動系統、車輛類型、國家和地區分類-全球產業分析、市場規模、市場佔有率及2026年至2033年預測圓柱形電池X光影像檢查市場:依電池類型、檢測技術、終端用戶產業、應用、通路分類,全球預測(2026-2032年)
 汽車電池:市場佔有率分析、產業趨勢與統計、成長預測(2026-2031)