


 |
市場調查報告書
商品編碼
1959322
Ultracruise 與城市自動駕駛市場機會、成長要素、產業趨勢分析及 2026 年至 2035 年預測Ultra Cruise and City-Street Autonomous Driving Market Opportunity, Growth Drivers, Industry Trend Analysis, and Forecast 2026 - 2035 |
||||||
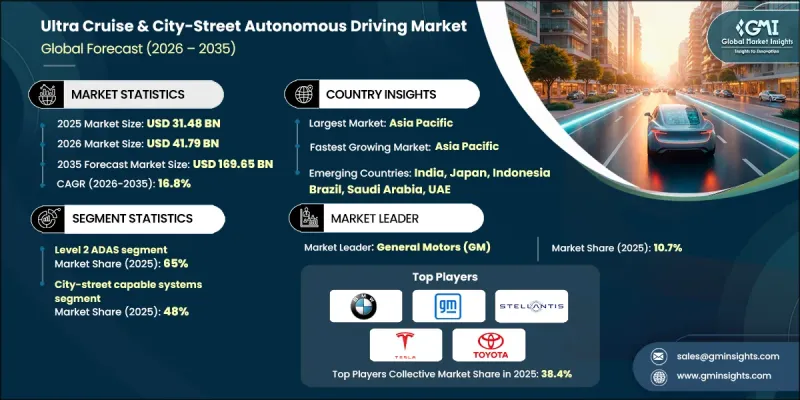
2025 年全球超巡航和城市自動駕駛市場價值為 314.8 億美元,預計到 2035 年將以 16.8% 的複合年成長率成長至 1696.5 億美元。
先進的免手駕駛和城市級自動化技術的融合正在重塑車輛設計、內建軟體框架以及下一代出行解決方案。汽車製造商正從孤立的駕駛輔助功能轉向自適應的軟體定義駕駛平台,以支援逐步升級的自動駕駛,同時保持人工監控。都市區駕駛環境,包括擁塞、難以預測的道路使用者以及不完善的基礎設施,對城市自動駕駛系統提出了更高的性能要求。這些解決方案依賴先進的感測器整合、持續的環境感知和高速運算來管理交叉路口、號誌燈、車道變換和複雜的交通流。由於車輛在特定的運行設計範圍內運行,這些技術對於將自動駕駛從封閉道路擴展到日常城市使用至關重要。汽車製造商和技術供應商正在大力投資可擴展的自動駕駛技術棧,優先考慮透過軟體更新和逐步擴展功能來保障安全性和可靠性,而不是立即部署完全自動駕駛。這種分階段的方法有助於符合監管要求、贏得消費者信任並實現快速商業化。
| 市場範圍 | |
|---|---|
| 開始年份 | 2025 |
| 預測年份 | 2026-2035 |
| 起始值 | 314.8億美元 |
| 預測金額 | 1696.5億美元 |
| 複合年成長率 | 16.8% |
預計到2025年,L2級高級駕駛輔助系統(ADAS)將佔據65%的市場佔有率,並在2035年之前以16.5%的複合年成長率成長。這個細分市場佔據主導地位,因為它在提供先進自動化功能的同時,仍保留了駕駛員的監督,這使得監管核准和市場部署在各個地區都更加現實可行。現有的安全標準、責任框架和認證流程都為監督式自動駕駛提供了強力的支持,使其部署速度比更高級別的自動駕駛更快。
預計到2025年,城市道路適用型自動駕駛系統將佔據48%的市場佔有率,並在2026年至2035年間維持17.8%的複合年成長率。這些系統逐漸成為主流,因為它們能夠滿足日常駕駛環境的需求,而這正是大多數車輛使用情境。都市區駕駛涉及頻繁的停車、十字路口、弱勢道路使用者以及複雜的交通狀況,因此,針對都市區環境的自動駕駛解決方案比僅適用於高速公路的解決方案更有價值。消費者對減輕城市通勤、停車和短程出行壓力的需求不斷成長,也持續加速這些系統的普及。
預計到2025年,美國超高速巡航和都市區自動駕駛市場將佔據85%的市場佔有率,市場規模將達到92億美元。美國市場正保持強勁成長,這得益於高級駕駛輔助系統和監督式自動駕駛解決方案的持續創新,以及領先汽車製造商的大量投資。高度發展的軟體定義車輛生態系統使製造商能夠將免手駕駛功能從受控的高速公路環境擴展到複雜的城市環境。人工智慧感知系統、高精度數位地圖和空中軟體更新為這一進展提供了支持,從而能夠持續改進功能、安全性和駕駛性能。
目錄
第1章:調查方法
第2章執行摘要
第3章業界考察
- 生態系分析
- 供應商情況
- 利潤率分析
- 成本結構
- 每個階段增加的價值
- 影響價值鏈的因素
- 中斷
- 影響產業的因素
- 促進因素
- 對免持和便捷出行方式的需求日益成長
- 人工智慧、感測器融合和車載運算領域的進展
- OEM向軟體定義汽車(SDV)轉型
- 都市化加速與交通運輸日益複雜化
- 監理支援監督式自動駕駛和ADAS演進
- 產業潛在風險與挑戰
- 高成本和硬體複雜性
- 各區域監管體系碎片化
- 市場機遇
- 拓展至中檔及大眾市場汽車領域
- 訂閱模式和按需功能模式
- 與電動車和智慧運輸系統的融合
- 亞太地區都市區自動駕駛技術的發展
- 與人工智慧、地圖繪製和雲端服務供應商建立策略夥伴關係
- 促進因素
- 成長潛力分析
- 北美洲
- 美國:NHTSA自動駕駛系統(ADS)指南和自動駕駛汽車測試舉措
- 歐洲
- 歐盟:聯合國歐洲經濟委員會第R157號條例(自動車道維持系統 - ALKS)
- 德國:自動駕駛法
- 英國:互聯自動駕駛(CAM)法規
- 法國:自動駕駛車輛測試框架
- 亞太地區
- 中國:智慧網聯汽車(ICV)模擬標準
- 日本:國土交通省自動駕駛安全指南
- 韓國:自動駕駛汽車法
- 新加坡:自動駕駛車輛安全評估框架
- 拉丁美洲
- 巴西:國家智慧交通與物聯網策略
- 墨西哥:智慧運輸和自動駕駛汽車試點法規
- 智利:智慧型運輸系統(ITS)政策
- 中東和非洲(MEA)
- 阿拉伯聯合大公國:杜拜的自動駕駛交通戰略
- 沙烏地阿拉伯:2030願景智慧運輸框架
- 南非:綠色交通與自動駕駛政策
- 北美洲
- 波特的分析
- PESTEL 分析
- 技術與創新展望
- 當前技術趨勢
- 新興技術
- 專利分析
- 永續性和環境影響分析
- 永續實踐
- 減少廢棄物策略
- 生產中的能源效率
- 具有環保意識的舉措
- 碳足跡考量
- 未來前景與機遇
- 人機互動(HMI)與駕駛員監控系統(DMS)
- 自主系統的人機介面設計原則
- 駕駛員監控系統(DMS)技術
- DMS的監管要求
- 使用者體驗 (UX) 挑戰與解決方案
- 主要人機介面/桌面管理系統技術供應商
- 數據策略與軟體堆疊經濟學
- 資料擷取與管理架構
- 軟體堆疊架構
- 軟體開發經濟學
- 數據商業化戰略
- 仿真和檢驗基礎設施
第4章 競爭情勢
- 介紹
- 企業市佔率分析
- 主要市場公司的競爭分析
- 競爭定位矩陣
- 戰略展望矩陣
- 主要進展
- 併購
- 夥伴關係與合作
- 新產品發布
- 業務拓展計劃及資金籌措
第5章 市場估價與預測:依自動駕駛等級分類,2022-2035年
- 二級高級駕駛輔助系統
- 3級ADAS
第6章 市場估計與預測:依投資設計領域分類,2022-2035年
- 限高速公路系統
- 城市和道路相關系統
- 全面/到府服務系統
第7章 市場估計與預測:依感測器技術分類,2022-2035年
- 基於攝影機的系統
- 基於雷達的系統
- 配備LiDAR的系統
- 多感測器融合系統
第8章 市場估計與預測:依應用領域分類,2022-2035年
- 僅供個人/私人使用
- 叫車和共享出行
- 商用車輛車隊
第9章 市場估價與預測:依車輛類型分類,2022-2035年
- 搭乘用車
- 轎車
- 掀背車
- SUV
- 商用車輛
- 輕型商用車(LCV)
- MCV
第10章 市場估價與預測:依地區分類,2022-2035年
- 北美洲
- 美國
- 加拿大
- 歐洲
- 德國
- 英國
- 法國
- 義大利
- 西班牙
- 俄羅斯
- 比利時
- 亞太地區
- 中國
- 印度
- 日本
- 澳洲
- 韓國
- 菲律賓
- 印尼
- 新加坡
- 拉丁美洲
- 巴西
- 墨西哥
- 阿根廷
- 中東和非洲
- 南非
- 沙烏地阿拉伯
- 阿拉伯聯合大公國
第11章:公司簡介
- 世界公司
- BMW
- Continental
- DENSO
- General Motors(GM)
- Mercedes-Benz
- Mobileye
- Nissan Motor
- NVIDIA
- Robert Bosch
- Stellantis
- Tesla
- Toyota Motor
- 按地區分類的主要企業
- Baidu
- Honda Motor
- Huawei Technologies
- Hyundai Motor
- NIO
- Renesas Electronics
- StradVision
- Valeo
- Ghost Autonomy
- 新興企業
- Ambarella
- Aptiv
- Innoviz Technologies
- Luminar Technologies
- Magna International
- NXP Semiconductors
- Qualcomm Technologies
- Sony Semiconductor Solutions
- ZF Friedrichshafen
The Global Ultra Cruise & City-Street Autonomous Driving Market was valued at USD 31.48 billion in 2025 and is estimated to grow at a CAGR of 16.8% to reach USD 169.65 billion by 2035.
The integration of advanced hands-free driving and city-level automation is reshaping vehicle design, embedded software frameworks, and next-generation mobility solutions. Automakers are moving away from isolated driver-assistance features toward adaptive, software-defined driving platforms that support progressively higher autonomy while retaining human supervision. Urban driving conditions, including congestion, unpredictable road users, and inconsistent infrastructure, are placing higher performance demands on city-street autonomous systems. These solutions rely on sophisticated sensor integration, continuous environment perception, and high-speed computing to manage intersections, traffic signals, lane changes, and complex traffic flows. Because vehicles operate within defined operational design domains, such technologies are essential for extending autonomy beyond limited-access roads into everyday urban use. Automakers and technology providers are heavily investing in scalable autonomy stacks that emphasize safety, reliability, and gradual feature expansion through software updates rather than full automation deployment. This step-by-step approach supports regulatory alignment, consumer trust, and faster commercialization.
| Market Scope | |
|---|---|
| Start Year | 2025 |
| Forecast Year | 2026-2035 |
| Start Value | $31.48 Billion |
| Forecast Value | $169.65 Billion |
| CAGR | 16.8% |
The Level 2 ADAS segment held a 65% share in 2025 and is projected to grow at a CAGR of 16.5% through 2035. This segment leads due to its ability to deliver advanced automated functionality while maintaining driver oversight, making regulatory approval and market rollout more practical across regions. Existing safety standards, liability frameworks, and certification processes strongly favor supervised autonomy, enabling faster adoption compared to higher autonomy levels.
The city-street capable systems segment held 48% share in 2025 and is expected to register a CAGR of 17.8% between 2026 and 2035. These systems dominate because they address everyday driving environments where most vehicle usage occurs. Urban operation involves frequent stops, intersections, vulnerable road users, and mixed traffic conditions, making city-focused automation more valuable than highway-only solutions. Growing consumer demand for stress reduction in urban commuting, parking, and short-distance travel continues to accelerate adoption.
United States Ultra Cruise & City-Street Autonomous Driving Market held an 85% share, generating USD 9.2 billion in 2025. Market expansion in the U.S. remains strong, driven by continuous innovation in advanced driver assistance and supervised autonomy solutions, along with substantial investment from major automakers. A well-developed software-defined vehicle ecosystem is enabling manufacturers to extend hands-free driving capabilities beyond controlled highway environments into complex urban settings. This progress is supported by artificial intelligence-based perception systems, high-precision digital mapping, and over-the-air software updates that allow ongoing improvements in functionality, safety, and driving performance.
Key participants active in the Global Ultra Cruise & City-Street Autonomous Driving Market include NVIDIA, Toyota Motor, Continental, Mobileye, General Motors, Stellantis, BMW, Nissan Motor, and Mercedes-Benz Group. Companies in the ultra cruise and city-street autonomous driving market are strengthening their foothold through sustained investment in software-centric vehicle architectures and artificial intelligence-driven perception systems. Automakers are prioritizing modular autonomy platforms that allow features to scale across vehicle models and price segments. Strategic partnerships with semiconductor firms and software developers help accelerate processing performance and algorithm refinement. Many players emphasize over-the-air update capabilities to enhance system reliability and functionality post-sale. Extensive real-world data collection is used to improve urban driving accuracy and safety validation.
Table of Contents
Chapter 1 Methodology
- 1.1 Research approach
- 1.2 Quality commitments
- 1.2.1 GMI AI policy & data integrity commitment
- 1.3 Research trail & confidence scoring
- 1.3.1 Research trail components
- 1.3.2 Scoring components
- 1.4 Data collection
- 1.4.1 Partial list of primary sources
- 1.5 Data mining sources
- 1.5.1 Paid sources
- 1.6 Base estimates and calculations
- 1.6.1 Base year calculation
- 1.7 Forecast model
- 1.8 Research transparency addendum
Chapter 2 Executive Summary
- 2.1 Industry 360° synopsis, 2022 - 2035
- 2.2 Key market trends
- 2.2.1 Regional
- 2.2.2 Autonomy Level
- 2.2.3 Operational Design Domain
- 2.2.4 Vehicle
- 2.2.5 Sensor Technology
- 2.2.6 End use
- 2.3 TAM Analysis, 2026-2035
- 2.4 CXO perspectives: Strategic imperatives
- 2.4.1 Executive decision points
- 2.4.2 Critical success factors
- 2.5 Future outlook and strategic recommendations
Chapter 3 Industry Insights
- 3.1 Industry ecosystem analysis
- 3.1.1 Supplier landscape
- 3.1.2 Profit margin analysis
- 3.1.3 Cost structure
- 3.1.4 Value addition at each stage
- 3.1.5 Factor affecting the value chain
- 3.1.6 Disruptions
- 3.2 Industry impact forces
- 3.2.1 Growth drivers
- 3.2.1.1 Rising Demand for Hands-Free & Convenience-Driven Mobility
- 3.2.1.2 Advancements in AI, Sensor Fusion & Onboard Compute
- 3.2.1.3 OEM Shift Toward Software-Defined Vehicles (SDVs)
- 3.2.1.4 Expanding Urbanization & Traffic Complexity
- 3.2.1.5 Regulatory Support for Supervised Autonomy & ADAS Evolution
- 3.2.2 Industry pitfalls and challenges
- 3.2.2.1 High System Cost & Hardware Complexity
- 3.2.2.2 Regulatory Fragmentation Across Regions
- 3.2.3 Market opportunities
- 3.2.3.1 Expansion into Mid-Range & Mass-Market Vehicles
- 3.2.3.2 Subscription-Based & Feature-on-Demand Models
- 3.2.3.3 Integration with EV & Smart Mobility Ecosystems
- 3.2.3.4 Asia-Pacific Urban Autonomy Growth
- 3.2.3.5 Strategic Partnerships with AI, Mapping & Cloud Providers
- 3.2.1 Growth drivers
- 3.3 Growth potential analysis
- 3.3.1 North America
- 3.3.1.1 United States: NHTSA Automated Driving Systems (ADS) Guidance & AV TEST Initiative
- 3.3.2 Europe
- 3.3.2.1 European Union: UNECE Regulation R157 (Automated Lane Keeping Systems - ALKS)
- 3.3.2.2 Germany: Autonomous Driving Act
- 3.3.2.3 United Kingdom: Connected and Automated Mobility (CAM) Regulations
- 3.3.2.4 France: Autonomous Vehicle Experimentation Framework
- 3.3.3 Asia Pacific
- 3.3.3.1 China: Intelligent Connected Vehicle (ICV) Simulation Standards
- 3.3.3.2 Japan: MLIT Automated Driving Safety Guidelines
- 3.3.3.3 South Korea: Autonomous Vehicle Act
- 3.3.3.4 Singapore: Autonomous Vehicle Safety Assessment Framework
- 3.3.4 Latin America
- 3.3.4.1 Brazil: National Intelligent Mobility & IoT Strategy
- 3.3.4.2 Mexico: Smart Mobility & Autonomous Vehicle Pilot Regulations
- 3.3.4.3 Chile: Intelligent Transport Systems (ITS) Policy
- 3.3.5 Middle East & Africa (MEA)
- 3.3.5.1 United Arab Emirates: Dubai Autonomous Transport Strategy
- 3.3.5.2 Saudi Arabia: Vision 2030 Smart Mobility Framework
- 3.3.5.3 South Africa: Green Transport & Automated Mobility Policy
- 3.3.1 North America
- 3.4 Porter’s analysis
- 3.5 PESTEL analysis
- 3.6 Technology and Innovation landscape
- 3.6.1 Current technological trends
- 3.6.2 Emerging technologies
- 3.7 Patent analysis
- 3.8 Sustainability and environmental impact analysis
- 3.8.1 Sustainable practices
- 3.8.2 Waste reduction strategies
- 3.8.3 Energy efficiency in production
- 3.8.4 Eco-friendly initiatives
- 3.8.5 Carbon footprint considerations
- 3.9 Future outlook & opportunities
- 3.10 Human-machine interaction (HMI) & driver monitoring systems (DMS)
- 3.10.1 HMI design principles for autonomous systems
- 3.10.2 Driver monitoring system (DMS) technologies
- 3.10.3 Regulatory requirements for dms
- 3.10.4 User experience (Ux) challenges & solutions
- 3.10.5 Leading HMI/DMS technology providers
- 3.11 Data strategy & software stack economics
- 3.11.1 Data collection & management architecture
- 3.11.2 Software stack architecture
- 3.11.3 Software development economics
- 3.11.4 Data monetization strategies
- 3.11.5 Simulation & validation infrastructure
Chapter 4 Competitive Landscape, 2025
- 4.1 Introduction
- 4.2 Company market share analysis
- 4.2.1 North America
- 4.2.2 Europe
- 4.2.3 Asia Pacific
- 4.2.4 Latin America
- 4.2.5 MEA
- 4.3 Competitive analysis of major market players
- 4.4 Competitive positioning matrix
- 4.5 Strategic outlook matrix
- 4.6 Key developments
- 4.6.1 Mergers & acquisitions
- 4.6.2 Partnerships & collaborations
- 4.6.3 New Product Launches
- 4.6.4 Expansion Plans and funding
Chapter 5 Market Estimates & Forecast, By Autonomy Level, 2022 - 2035 ($Bn, units)
- 5.1 Key trends
- 5.2 Level 2 ADAS
- 5.3 Level 3 ADAS
Chapter 6 Market Estimates & Forecast, By Operational Design Domain, 2022 - 2035 ($Bn, Units)
- 6.1 Key trends
- 6.2 Highway-Only Systems
- 6.3 City-Street Capable Systems
- 6.4 Comprehensive / Door-to-Door Systems
Chapter 7 Market Estimates & Forecast, By Sensor Technology, 2022 - 2035 ($Bn, Units)
- 7.1 Key trends
- 7.2 Camera-Based Systems
- 7.3 Radar-Based Systems
- 7.4 LiDAR-Enabled Systems
- 7.5 Multi-Sensor Fusion Systems
Chapter 8 Market Estimates & Forecast, By End-Use, 2022 - 2035 ($Bn, Units)
- 8.1 Key trends
- 8.2 Private / Personal Use
- 8.3 Ride-Hailing & Shared Mobility
- 8.4 Commercial Fleets
Chapter 9 Market Estimates & Forecast, By Vehicle, 2022 - 2035 ($Bn, Units)
- 9.1 Key trends
- 9.2 Passenger vehicle
- 9.2.1 Sedan
- 9.2.2 Hatchback
- 9.2.3 SUV
- 9.3 Commercial vehicle
- 9.3.1 LCV
- 9.3.2 MCV
Chapter 10 Market Estimates & Forecast, By Region, 2022 - 2035 ($Bn, Units)
- 10.1 Key trends
- 10.2 North America
- 10.2.1 US
- 10.2.2 Canada
- 10.3 Europe
- 10.3.1 Germany
- 10.3.2 UK
- 10.3.3 France
- 10.3.4 Italy
- 10.3.5 Spain
- 10.3.6 Russia
- 10.3.7 Belgium
- 10.4 Asia Pacific
- 10.4.1 China
- 10.4.2 India
- 10.4.3 Japan
- 10.4.4 Australia
- 10.4.5 South Korea
- 10.4.6 Philippines
- 10.4.7 Indonesia
- 10.4.8 Singapore
- 10.5 Latin America
- 10.5.1 Brazil
- 10.5.2 Mexico
- 10.5.3 Argentina
- 10.6 MEA
- 10.6.1 South Africa
- 10.6.2 Saudi Arabia
- 10.6.3 UAE
Chapter 11 Company Profiles
- 11.1 Global Players
- 11.1.1 BMW
- 11.1.2 Continental
- 11.1.3 DENSO
- 11.1.4 General Motors (GM)
- 11.1.5 Mercedes-Benz
- 11.1.6 Mobileye
- 11.1.7 Nissan Motor
- 11.1.8 NVIDIA
- 11.1.9 Robert Bosch
- 11.1.10 Stellantis
- 11.1.11 Tesla
- 11.1.12 Toyota Motor
- 11.2 Regional Players
- 11.2.1 Baidu
- 11.2.2 Honda Motor
- 11.2.3 Huawei Technologies
- 11.2.4 Hyundai Motor
- 11.2.5 NIO
- 11.2.6 Renesas Electronics
- 11.2.7 StradVision
- 11.2.8 Valeo
- 11.2.9 Ghost Autonomy
- 11.3 Emerging Players
- 11.3.1 Ambarella
- 11.3.2 Aptiv
- 11.3.3 Innoviz Technologies
- 11.3.4 Luminar Technologies
- 11.3.5 Magna International
- 11.3.6 NXP Semiconductors
- 11.3.7 Qualcomm Technologies
- 11.3.8 Sony Semiconductor Solutions
- 11.3.9 ZF Friedrichshafen
 2034年全球自動駕駛物流車輛市場預測-按車輛類型、組件、導航技術、自動駕駛等級、應用、最終用戶和地區分類的全球分析2034年自主港口營運市場預測:按自動化程度、設備類型、技術、應用、最終用戶和地區分類的全球分析
 自動駕駛汽車市場:按組件、自動駕駛等級、燃料類型、技術、應用、車輛類型和最終用戶分類-2026-2032年全球市場預測
 2026年全球機器人車輛市場報告自動駕駛汽車處理器市場:按處理器類型、車輛類型、銷售管道和應用分類-2026-2032年全球市場預測
 全球自動駕駛汽車市場規模、佔有率、趨勢和成長分析報告(2026-2034)全球自動駕駛汽車市場規模、佔有率、趨勢和成長分析報告(2026-2034)
 2026-2030年全球L4級自動駕駛汽車市場按營運模式、車輛類型、自動駕駛等級、所有權模式和應用程式分類的按需自動駕駛出行市場,全球預測,2026-2032年按自主等級、推進方式、負載容量、車輛類型、應用和最終用戶產業分類的全球自主物流車輛市場預測(2026-2032年)