


 |
市場調查報告書
商品編碼
1959273
從 2026 年到 2035 年,Advantum 和 Neotum 市場的成長機會、成長要素、產業趨勢分析和預測。Advantame and Neotame Market Opportunity, Growth Drivers, Industry Trend Analysis, and Forecast 2026 - 2035 |
||||||
2025 年全球 Advantum 和 Neotum 市值為 1.321 億美元,預計到 2035 年將達到 3.442 億美元,年複合成長率為 10.1%。
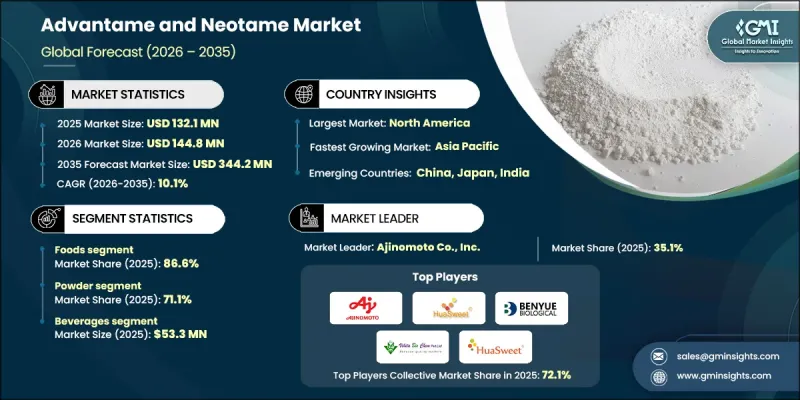
這一強勁成長反映出,隨著各國政府和衛生組織持續推動食品飲料產業減少糖攝取量,高甜度甜味劑的使用正在加速成長。Advantame和紐甜因其卓越的甜度而廣受認可,使生產商能夠在不改變產品整體成分或感官吸引力的前提下顯著降低糖含量。它們能夠在極低濃度下提供強烈的甜味,因此具有極高的成本效益且易於添加。目前,飲料領域佔據最大的市場佔有率,其次是烘焙產品、糖果甜點、乳製品和餐桌甜味劑。同時,膳食補充劑領域正成為成長最快的類別。食品飲料生產商仍然是主要的終端用戶,產品系列以滿足監管標準和消費者對低熱量產品的需求。在對風味掩蔽解決方案、功能性成分和低熱量產品開發日益成長的興趣推動下,製藥、膳食補充劑、零售和餐飲服務業也呈現穩定擴張的態勢。支持性的法規結構、可接受的每日攝取量優勢以及日益增強的全球健康意識,都促成了 Advantum 和 Neotam 在世界各地的廣泛應用。
| 市場範圍 | |
|---|---|
| 開始年份 | 2025 |
| 預測年份 | 2026-2035 |
| 起始值 | 1.321億美元 |
| 預測金額 | 3.442億美元 |
| 複合年成長率 | 10.1% |
預計到2025年,醫藥級阿達木單醣市場將以12.2%的複合年成長率成長,反映出受監管的醫療應用領域強勁的需求。此等級產品專為滿足藥品監管機構嚴格的純度和合規性標準而生產。它廣泛應用於需要精確劑量控制和有效掩味的特殊配方中。卓越的品質規格和嚴格的生產標準使得醫藥級Advantame和紐甜的價格高於傳統的食品級替代品。對先進口服製劑和膳食補充劑日益成長的需求將繼續推動該細分市場的擴張。
預計到2025年,飲料市場規模將達到5,330萬美元,到2035年將達到1.291億美元,年複合成長率(CAGR)為9.3%。市場的主導地位與全球減少糖攝取量的努力以及低卡路里飲料產品的配方改良密切相關。這些高甜度甜味劑非常適合用於開發低卡路里飲料,因為它們具有優異的穩定性和較長的保存期限,同時保持風味完整性。飲料業正受惠於消費者偏好的變化以及傳統和新興飲料品類的持續創新。同時,製造商正在調整配方以滿足消費者對「潔淨標示」的需求,這進一步推動了該市場的穩定成長。
預計到2025年,北美地區的Advantum和Neotum市場規模將達到5,050萬美元,並在整個預測期內保持顯著成長。該地區擁有成熟的食品飲料製造能力、強力的監管支持(鼓勵減糖策略)以及消費者對卡路里攝入的高度關注。完善的基礎設施和健康產品的不斷湧現,推動了多個產品類型的強勁需求。人們對預防性營養的日益重視以及低糖飲食習慣的養成,持續加速著全部區域市場的滲透。
目錄
第1章:調查方法和範圍
第2章執行摘要
第3章業界考察
- 生態系分析
- 供應商情況
- 利潤率
- 每個階段增加的價值
- 影響價值鏈的因素
- 中斷
- 影響產業的因素
- 促進因素
- 全球減糖法規
- 肥胖和糖尿病盛行率增加
- 超高甜度
- 產業潛在風險與挑戰
- 消費者負面看法
- 監管碎片化
- 市場機遇
- 醫藥級應用
- 甜味劑混合物的創新
- 促進因素
- 成長潛力分析
- 監理情勢
- 北美洲
- 歐洲
- 亞太地區
- 拉丁美洲
- 中東和非洲
- 波特的分析
- PESTEL 分析
- 價格趨勢
- 按地區
- 依產品類型
- 未來市場趨勢
- 科技與創新趨勢
- 當前技術趨勢
- 新興技術
- 專利狀態
- 貿易統計(HS編碼)
- 主要進口國
- 主要出口國
- 永續性和環境方面
- 永續計劃
- 減少廢棄物策略
- 生產中的能源效率
- 具有環保意識的舉措
- 考慮碳足跡
第4章 競爭情勢
- 介紹
- 企業市佔率分析
- 按地區
- 北美洲
- 歐洲
- 亞太地區
- 拉丁美洲
- 中東和非洲
- 按地區
- 公司矩陣分析
- 主要市場公司的競爭分析
- 競爭定位矩陣
- 主要進展
- 併購
- 夥伴關係與合作
- 新產品發布
- 業務拓展計劃
第5章 市場估算與預測:依產品類型分類,2022-2035年
- 食品級
- 醫藥級
第6章 市場估計與預測:依類型分類,2022-2035年
- 粉末
- 顆粒
第7章 市場估計與預測:依應用領域分類,2022-2035年
- 飲料
- 烘焙點心
- 糖果甜點
- 乳製品
- 餐桌甜味劑
- 營養保健品
- 其他
第8章 市場估算與預測:依最終使用者分類,2022-2035年
- 食品和飲料製造商
- 製藥公司
- 零售/餐飲服務業
- 營養補充品製造商
第9章 市場估計與預測:依地區分類,2022-2035年
- 北美洲
- 美國
- 加拿大
- 歐洲
- 德國
- 英國
- 法國
- 西班牙
- 義大利
- 其他歐洲地區
- 亞太地區
- 中國
- 印度
- 日本
- 澳洲
- 韓國
- 亞太其他地區
- 拉丁美洲
- 巴西
- 墨西哥
- 阿根廷
- 其他拉丁美洲地區
- 中東和非洲
- 沙烏地阿拉伯
- 南非
- 阿拉伯聯合大公國
- 其他中東和非洲地區
第10章:公司簡介
- Ajinomoto Co., Inc.
- HuaSweet-Neotame
- Shandong Benyue Biological Technology
- Vihita Bio Chem Pvt Ltd
- Wuhan HuaSweet Co., Ltd.
The Global Advantame and Neotame Market was valued at USD 132.1 million in 2025 and is estimated to grow at a CAGR of 10.1% to reach USD 344.2 million by 2035.
The strong growth reflects the accelerating shift toward high-intensity sweeteners as governments and health organizations continue to push for reduced sugar consumption across food and beverage categories. Advantame and neotame are widely recognized for their exceptional sweetness potency, allowing manufacturers to significantly lower sugar content without altering overall product composition or sensory appeal. Their ability to deliver intense sweetness at very low inclusion levels makes them highly cost-efficient and formulation-friendly. The beverage segment currently holds the largest share of the market, followed by bakery products, confectionery, dairy applications, and tabletop sweeteners, while nutraceutical applications are emerging as the fastest-growing category. Food and beverage manufacturers remain the primary end users as they reformulate portfolios to meet regulatory standards and consumer demand for reduced-calorie options. Meanwhile, pharmaceutical, nutraceutical, retail, and foodservice sectors are experiencing steady expansion due to rising interest in flavor-masking solutions, functional ingredients, and calorie-conscious product innovation. Supportive regulatory frameworks, favorable acceptable daily intake levels, and increasing global health awareness are collectively driving the large-scale adoption of advantame and neotame worldwide.
| Market Scope | |
|---|---|
| Start Year | 2025 |
| Forecast Year | 2026-2035 |
| Start Value | $132.1 Million |
| Forecast Value | $344.2 Million |
| CAGR | 10.1% |
The pharmaceutical-grade segment is forecast to grow at a CAGR of 12.2% by 2025, reflecting strong demand within regulated healthcare applications. This grade is specifically manufactured to meet stringent purity and compliance standards required by pharmaceutical authorities. It is widely utilized in specialized formulations where precise dosage control and effective taste masking are essential. Because of its superior quality specifications and rigorous production standards, pharmaceutical-grade advantame and neotame command premium pricing compared to conventional food-grade alternatives. Growing demand for advanced oral formulations and nutraceutical products continues to support expansion in this segment.
The beverages segment reached USD 53.3 million in 2025 and is projected to reach USD 129.1 million by 2035, growing at a CAGR of 9.3%. The segment's dominance is closely linked to global sugar-reduction initiatives and the reformulation of calorie-conscious drink products. These high-intensity sweeteners offer excellent stability and long shelf life while maintaining flavor integrity, making them highly suitable for reduced-calorie beverage development. The beverage industry continues to benefit from evolving consumer preferences and innovation in both traditional and emerging drink categories. At the same time, manufacturers are adapting formulations to align with clean label expectations, further supporting steady segment growth.
North America Advantame and Neotame Market generated USD 50.5 million in 2025 and is expected to witness substantial growth throughout the forecast period. The region is characterized by mature food and beverage manufacturing capabilities, strong regulatory backing for sugar reduction strategies, and elevated consumer awareness regarding calorie intake. Demand remains robust across multiple product categories, supported by a well-established infrastructure and a growing portfolio of health-oriented offerings. Increasing focus on preventive nutrition and reduced-sugar consumption patterns continues to accelerate market penetration across the region.
Key companies operating in the Global Advantame and Neotame Market include Ajinomoto Co., Inc., Wuhan HuaSweet Co., Ltd., Shandong Benyue Biological Technology, Vihita Bio Chem Pvt Ltd, and HuaSweet-Neotame. These industry participants are actively competing through technological advancements, product quality enhancements, and strategic market expansion initiatives. Companies in the advantame and neotame market are strengthening their competitive position through continuous investment in research and development to enhance sweetness performance, stability, and formulation compatibility. Strategic partnerships with food, beverage, and pharmaceutical manufacturers enable deeper market penetration and long-term supply agreements. Many players are expanding production capacity to meet rising global demand while ensuring compliance with international quality standards. Portfolio diversification into pharmaceutical-grade and nutraceutical applications further supports revenue growth.
Table of Contents
Chapter 1 Methodology & Scope
- 1.1 Research approach
- 1.2 Quality Commitments
- 1.2.1 GMI AI policy & data integrity commitment
- 1.2.1.1 Source consistency protocol
- 1.2.1 GMI AI policy & data integrity commitment
- 1.3 Research Trail & Confidence Scoring
- 1.3.1 Research Trail Components
- 1.3.2 Scoring Components
- 1.4 Data Collection
- 1.4.1 Partial list of primary sources
- 1.5 Data mining sources
- 1.5.1 Paid sources
- 1.5.1.1 Sources, by region
- 1.5.1 Paid sources
- 1.6 Base estimates and calculations
- 1.6.1 Base year calculation for any one approach
- 1.7 Forecast model
- 1.7.1 Quantified market impact analysis
- 1.7.1.1 Mathematical impact of growth parameters on forecast
- 1.7.1 Quantified market impact analysis
- 1.8 Research transparency addendum
- 1.8.1 Source attribution framework
- 1.8.2 Quality assurance metrics
- 1.8.3 Our commitment to trust
Chapter 2 Executive Summary
- 2.1 Industry 360° synopsis
- 2.2 Key market trends
- 2.2.1 Regional
- 2.2.2 Product Type
- 2.2.3 Form
- 2.2.4 Application
- 2.2.5 End User
- 2.3 TAM Analysis, 2025-2034
- 2.4 CXO perspectives: Strategic imperatives
- 2.4.1 Executive decision points
- 2.4.2 Critical success factors
- 2.5 Future Outlook and Strategic Recommendations
Chapter 3 Industry Insights
- 3.1 Industry ecosystem analysis
- 3.1.1 Supplier landscape
- 3.1.2 Profit margin
- 3.1.3 Value addition at each stage
- 3.1.4 Factor affecting the value chain
- 3.1.5 Disruptions
- 3.2 Industry impact forces
- 3.2.1 Growth drivers
- 3.2.1.1 Global sugar reduction regulations
- 3.2.1.2 Rising obesity and diabetes prevalence
- 3.2.1.3 Ultra-high sweetness potency
- 3.2.2 Industry pitfalls and challenges
- 3.2.2.1 Negative consumer perception
- 3.2.2.2 Regulatory fragmentation
- 3.2.3 Market opportunities
- 3.2.3.1 Pharmaceutical-grade applications
- 3.2.3.2 Sweetener blending innovations
- 3.2.1 Growth drivers
- 3.3 Growth potential analysis
- 3.4 Regulatory landscape
- 3.4.1 North America
- 3.4.2 Europe
- 3.4.3 Asia Pacific
- 3.4.4 Latin America
- 3.4.5 Middle East & Africa
- 3.5 Porter’s analysis
- 3.6 PESTEL analysis
- 3.7 Price trends
- 3.7.1 By region
- 3.7.2 By product type
- 3.8 Future market trends
- 3.9 Technology and Innovation landscape
- 3.9.1 Current technological trends
- 3.9.2 Emerging technologies
- 3.10 Patent Landscape
- 3.11 Trade statistics (HS code)
- 3.11.1 Major importing countries
- 3.11.2 Major exporting countries
- 3.12 Sustainability and environmental aspects
- 3.12.1 Sustainable practices
- 3.12.2 Waste reduction strategies
- 3.12.3 Energy efficiency in production
- 3.12.4 Eco-friendly initiatives
- 3.13 Carbon footprint consideration
Chapter 4 Competitive Landscape, 2025
- 4.1 Introduction
- 4.2 Company market share analysis
- 4.2.1 By region
- 4.2.1.1 North America
- 4.2.1.2 Europe
- 4.2.1.3 Asia Pacific
- 4.2.1.4 LATAM
- 4.2.1.5 MEA
- 4.2.1 By region
- 4.3 Company matrix analysis
- 4.4 Competitive analysis of major market players
- 4.5 Competitive positioning matrix
- 4.6 Key developments
- 4.6.1 Mergers & acquisitions
- 4.6.2 Partnerships & collaborations
- 4.6.3 New Product Launches
- 4.6.4 Expansion Plans
Chapter 5 Market Estimates and Forecast, By Product Type, 2022-2035 (USD Million) (Kilo Tons)
- 5.1 Key trends
- 5.2 Food Grade
- 5.3 Pharmaceutical Grade
Chapter 6 Market Estimates and Forecast, By Form, 2022-2035 (USD Million) (Kilo Tons)
- 6.1 Key trends
- 6.2 Powder
- 6.3 Granule
Chapter 7 Market Estimates and Forecast, By Application, 2022-2035 (USD Million) (Kilo Tons)
- 7.1 Key trends
- 7.2 Beverages
- 7.3 Baked Goods
- 7.4 Confectionery
- 7.5 Dairy Products
- 7.6 Tabletop Sweeteners
- 7.7 Nutraceuticals
- 7.8 Others
Chapter 8 Market Estimates and Forecast, By End User, 2022-2035 (USD Million) (Kilo Tons)
- 8.1 Key trends
- 8.2 Food & Beverage Manufacturers
- 8.3 Pharmaceutical Companies
- 8.4 Retail/Foodservice
- 8.5 Nutraceutical/Supplement Manufacturers
Chapter 9 Market Estimates and Forecast, By Region, 2022-2035 (USD Million) (Kilo Tons)
- 9.1 Key trends
- 9.2 North America
- 9.2.1 U.S.
- 9.2.2 Canada
- 9.3 Europe
- 9.3.1 Germany
- 9.3.2 UK
- 9.3.3 France
- 9.3.4 Spain
- 9.3.5 Italy
- 9.3.6 Rest of Europe
- 9.4 Asia Pacific
- 9.4.1 China
- 9.4.2 India
- 9.4.3 Japan
- 9.4.4 Australia
- 9.4.5 South Korea
- 9.4.6 Rest of Asia Pacific
- 9.5 Latin America
- 9.5.1 Brazil
- 9.5.2 Mexico
- 9.5.3 Argentina
- 9.5.4 Rest of Latin America
- 9.6 Middle East and Africa
- 9.6.1 Saudi Arabia
- 9.6.2 South Africa
- 9.6.3 UAE
- 9.6.4 Rest of Middle East and Africa
Chapter 10 Company Profiles
- 10.1 Ajinomoto Co., Inc.
- 10.2 HuaSweet-Neotame
- 10.3 Shandong Benyue Biological Technology
- 10.4 Vihita Bio Chem Pvt Ltd
- 10.5 Wuhan HuaSweet Co., Ltd.
