


 |
市場調查報告書
商品編碼
1959272
ADAS模擬市場機會、成長要素、產業趨勢分析及2026年至2035年預測ADAS Simulation Market Opportunity, Growth Drivers, Industry Trend Analysis, and Forecast 2026 - 2035 |
||||||
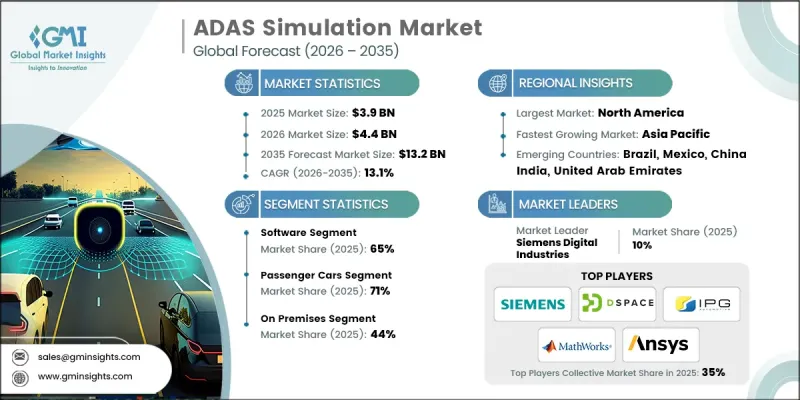
2025 年全球 ADAS 模擬市場價值 39 億美元,預計到 2035 年將達到 132 億美元,年複合成長率為 13.1%。
高階駕駛輔助系統 (ADAS) 模擬已成為現代汽車開發的重要支柱,它提供高度複雜的虛擬環境,能夠精確地再現真實世界的駕駛條件。該市場涵蓋整合軟體平台、硬體在環 (HIL) 系統以及為汽車製造商和旅遊技術公司提供的專業工程服務,用於檢驗ADAS 的性能和安全性。模擬技術已從有限的功能測試發展到先進的數位雙胞胎生態系統,能夠精確且有效率地再現數百萬英里的虛擬駕駛。這一轉變顯著降低了對物理原型的依賴,同時縮短了開發週期。隨著車輛自動化變得日益複雜,模擬平台在檢驗感知演算法、感測器融合邏輯和即時決策系統方面發揮核心作用。因此,ADAS 模擬市場被定位為一項關鍵的基礎技術,能夠推動安全且擴充性的自動駕駛技術的全球部署。
| 市場範圍 | |
|---|---|
| 開始年份 | 2025 |
| 預測年份 | 2026-2035 |
| 起始值 | 39億美元 |
| 預測金額 | 132億美元 |
| 複合年成長率 | 13.1% |
法規需求、成本最佳化需求以及技術的快速發展正在加速ADAS模擬技術的應用。隨著基於訂閱的SaaSStart-Ups模式取代傳統的資本密集型基礎設施投資,市場正經歷結構性轉變。此前,250萬美元至1500萬美元的前期成本是新興供應商和創新主導型出行新創公司進入市場的一大障礙。如今,雲端原生模擬生態系統支援付費使用制的定價模式,企業只需每月支付1.5萬美元至20萬美元(具體費用取決於運算能力和功能整合),即可利用先進的測試框架。這種轉變降低了財務門檻,同時擴大了企業級檢驗能力的取得途徑。不斷完善的車輛安全法規和日益嚴格的監控進一步提升了對持續且可擴展的調查方法的需求,從而增強了ADAS模擬市場的長期發展前景。
預計到2025年,軟體領域將佔據65%的市場佔有率,並在2026年至2035年間以13.7%的複合年成長率成長。這一主導地位得益於持續的平台增強、廣泛的功能整合以及能夠產生永續收入的可擴展許可模式。目前,全面的軟體工具鏈包括模擬引擎、場景建模系統、高階感測器模擬、車輛動力學模組和身臨其境型可視化框架,所有這些組件均已整合,可實現ADAS的全週期檢驗。授權模式多種多樣,從入門級的基於模型的測試環境(年訂閱費用約為每用戶5萬美元起)到提供即時硬體整合、雲端可擴展性和AI賦能的場景自動化(年訂閱費用超過每用戶50萬美元)的企業級平台,應有盡有。
預計到2025年,軟體在環(SIL)領域將佔據40%的市場佔有率,並在2035年之前以13.5%的複合年成長率成長。 調查方法能夠在硬體部署之前,在虛擬環境中檢驗ADAS演算法,從而顯著降低開發成本並縮短迭代周期。這些平台利用合成感測器輸入和動態車輛模型,在高效能運算系統上運行複雜的ADAS堆疊。透過無需使用實體車輛即可進行大規模場景測試,SIL模擬有助於提高ADAS(進階駕駛輔助系統)的開發效率、降低安全風險並縮短產品上市時間。
美國高級駕駛輔助系統(ADAS)模擬市場預計到2025年將達到11億美元,並在2026年至2035年間以12.4%的複合年成長率成長。美國憑藉嚴格的車輛安全法規、不斷擴展的聯網汽車計畫以及積極的法律規範,保持主導地位。美國擁有廣泛的高速公路網路和多樣化的出行環境,這促使製造商加強對先進自動化功能的檢驗。因此,需要對複雜的交通場景進行廣泛的仿真,以滿足合規標準並確保效能可靠性。眾多汽車原始設備製造商(OEM)、半導體創新公司和自動Start-Ups新創企業的強大實力,進一步鞏固了美國在ADAS模擬領域的領先地位。
目錄
第1章:調查方法
第2章執行摘要
第3章業界考察
- 生態系分析
- 供應商情況
- 利潤率分析
- 成本結構
- 每個階段增加的價值
- 影響價值鏈的因素
- 中斷
- 影響產業的因素
- 促進因素
- 政府正逐步收緊安全法規。
- 降低物理測試成本的必要性
- 加快ADAS的開發進度
- 自動駕駛汽車研發進展
- 人工智慧和感測器融合領域的技術進步
- 產業潛在風險與挑戰
- 仿真平台所需的初始投資很高。
- 平台之間缺乏標準化
- 物理上精確的感測器建模的複雜性
- 技術純熟勞工短缺
- 市場機遇
- 模擬即服務 (SaaS)經營模式
- 進入新興的自動駕駛汽車市場
- 亞太地區市場成長
- 與生成式人工智慧整合以創建場景
- V2X(車聯網)仿真
- 促進因素
- 成長潛力分析
- 監理情勢
- 北美洲
- 美國聯邦安全法規與ADAS實施指南
- 加拿大 - 連網和自動駕駛汽車安全框架 (CASF)
- 歐洲
- 德國與歐盟的智慧交通系統與國家舉措
- 英國—脫歐後ADAS系統的柔軟性
- 法國——國家ADAS測試和智慧交通系統戰略
- 義大利——智慧交通系統試點計畫和智慧基礎設施
- 亞太地區
- 中國工信部C-V2X指令與標準
- 印度—新興的ADAS和汽車互聯法規
- 日本——智慧交通系統連結性與頻率政策
- 澳洲—技術中立的智慧交通系統政策
- LATAM
- 墨西哥 - NOM 汽車安全標準
- 阿根廷 - 國家交通法 24.449
- 中東和非洲
- 南非共和國 - 道路交通法(1996 年)
- 沙烏地阿拉伯—交通運輸法律與2030願景交通運輸舉措
- 北美洲
- 波特的分析
- PESTEL 分析
- 科技與創新趨勢
- 當前技術趨勢
- 基於物理的感測器模擬技術的進展
- 人工智慧和機器學習的融合
- 用於場景創建的生成式人工智慧
- 新興技術
- 即時仿真功能
- 數位雙胞胎技術
- 雲端原生模擬平台
- 當前技術趨勢
- 專利分析
- 主要專利趨勢
- 技術創新的關鍵領域
- 主要企業提交的專利申請
- 新興智慧財產權策略
- 價格分析
- 軟體許可模式
- 訂閱式定價
- 工程服務定價結構
- 總擁有成本 (TCO) 分析
- 使用案例和成功案例
- OEM 應用案例
- 一級供應商的應用案例
- 技術開發人員的應用案例
- 永續性和環境方面
- 永續實踐
- 減少廢棄物策略
- 生產中的能源效率
- 具有環保意識的舉措
- 碳足跡考量
- OEM和第一級供應商採用成熟度指數
第4章 競爭情勢
- 介紹
- 企業市佔率分析
- 北美洲
- 歐洲
- 亞太地區
- 拉丁美洲
- 中東和非洲
- 主要市場公司的競爭分析
- 競爭定位矩陣
- 戰略展望矩陣
- 主要進展
- 併購
- 夥伴關係與合作
- 新產品發布
- 業務拓展計劃及資金籌措
第5章 市場估算與預測:依產品類型分類,2022-2035年
- 軟體
- 模擬軟體平台
- 應用軟體
- 感測器模擬軟體
- 場景生成工具
- D/基於物理的建模工具
- 服務
- 專業服務
- 託管服務
第6章 市場估價與預測:依車輛類型分類,2022-2035年
- 搭乘用車
- 掀背車車
- SUV
- 轎車
- 商用車輛
- 輕型商用車(LCV)
- 中型商用車(MCV)
- 重型商用車(HCV)
第7章 市場估價與預測:依ADAS功能分類,2022-2035年
- 主動式車距維持定速系統(ACC)
- 車道維持/偏離預警系統
- 自動停車輔助
- 防碰撞系統
- 交通壅塞輔助功能
- 高速公路自動駕駛/完全自動駕駛
- 盲點偵測系統
- 其他
第8章 市場估計與預測:模擬法,2022-2035年
- 模型在環(MIL)
- 軟體在環(SIL)
- 處理器在環(PIL)
- 硬體在環(HIL)
- 驅動在環(DIL)
第9章 市場估算與預測:依部署類型分類,2022-2035年
- 現場
- 基於雲端的
- 混合
第10章 市場估價與預測:依最終用途分類,2022-2035年
- 汽車製造商
- 一級和二級供應商
- 技術提供者和軟體開發商
- 半導體和硬體供應商
- 其他
第11章 市場估價與預測:按地區分類,2022-2035年
- 北美洲
- 美國
- 加拿大
- 歐洲
- 德國
- 英國
- 法國
- 義大利
- 西班牙
- 俄羅斯
- 荷蘭
- 瑞典
- 丹麥
- 波蘭
- 亞太地區
- 中國
- 印度
- 日本
- 澳洲
- 韓國
- 新加坡
- 泰國
- 印尼
- 越南
- 拉丁美洲
- 巴西
- 墨西哥
- 阿根廷
- 哥倫比亞
- 中東和非洲
- 南非
- 沙烏地阿拉伯
- 阿拉伯聯合大公國
- 以色列
第12章:公司簡介
- 世界玩家
- Ansys
- Applied Intuition
- AVL List
- dSPACE
- Foretellix
- IPG Automotive
- MathWorks
- MSC Software
- Siemens Digital Industries
- Vector Informatik
- 本地球員
- AIMotive
- Baidu
- CARLA
- Cognata
- ETAS
- Hexagon
- NVIDIA
- rFpro
- TASS International
- VI-grade
- 新興企業和技術基礎設施公司
- Luminar Technologies
- Metamoto
- Oxbotica
- Parallel Domain
- Wayve
The Global ADAS Simulation Market was valued at USD 3.9 billion in 2025 and is estimated to grow at a CAGR of 13.1% to reach USD 13.2 billion by 2035.
Advanced Driver Assistance Systems simulation has become a foundational pillar of modern automotive development, delivering highly sophisticated virtual environments that accurately mirror real-world driving conditions. The market encompasses integrated software platforms, hardware-in-the-loop systems, and specialized engineering services that support automakers and mobility technology firms in validating ADAS performance and safety. Over time, simulation capabilities have evolved from limited functional testing toward advanced digital twin ecosystems capable of recreating millions of virtual driving miles with high precision and efficiency. This transformation significantly reduces reliance on physical prototypes while accelerating development timelines. As vehicle automation grows increasingly complex, simulation platforms are playing a central role in verifying perception algorithms, sensor fusion logic, and real-time decision systems. The ADAS simulation market is therefore positioned as a critical enabler of safe and scalable autonomous mobility deployment worldwide.
| Market Scope | |
|---|---|
| Start Year | 2025 |
| Forecast Year | 2026-2035 |
| Start Value | $3.9 Billion |
| Forecast Value | $13.2 Billion |
| CAGR | 13.1% |
Adoption of ADAS simulation technologies is accelerated by regulatory mandates, cost optimization requirements, and rapid technological progress. The market is experiencing structural change as subscription-based SaaS deployment models replace traditional capital-intensive infrastructure investments. Historically, upfront expenditures ranging from USD 2.5 million to USD 15 million have limited accessibility for emerging suppliers and innovation-driven mobility startups. Cloud-native simulation ecosystems now support pay-per-use pricing structures, allowing organizations to leverage advanced testing frameworks through monthly subscription fees typically ranging from USD 15,000 to USD 200,000, depending on computational capacity and feature integration. This transition reduces financial barriers while expanding access to enterprise-grade validation capabilities. Evolving vehicle safety regulations and increased oversight are further reinforcing the need for continuous, scalable testing methodologies, strengthening the long-term outlook of the ADAS simulation market.
In 2025, the software segment accounted for 65% share and is forecast to grow at a CAGR of 13.7% between 2026 and 2035. This segment leads due to continuous platform enhancement, broader feature integration, and scalable licensing models that generate recurring revenue streams. Comprehensive software toolchains now include simulation engines, scenario modeling systems, advanced sensor emulation, vehicle dynamics modules, and immersive visualization frameworks that collectively enable full-cycle ADAS validation. Licensing structures vary widely, with annual subscriptions starting around USD 50,000 per seat for entry-level model-based testing environments and exceeding USD 500,000 per seat for enterprise-grade platforms offering real-time hardware integration, cloud scalability, and AI-enabled scenario automation.
The software-in-the-loop segment held a 40% share in 2025 and is expected to grow at a CAGR of 13.5% through 2035. Software-in-the-loop methodologies enable validation of ADAS algorithms within virtual environments prior to hardware deployment, significantly reducing development expenses and shortening iteration cycles. These platforms execute complex ADAS stacks on high-performance computing systems using synthetic sensor inputs and dynamic vehicle models. By enabling large-scale scenario testing without the need for physical vehicles, SIL simulation enhances development efficiency, mitigates safety risks, and accelerates time-to-market for advanced driver assistance technologies.
United States ADAS Simulation Market generated USD 1.1 billion in 2025 and is projected to grow at a CAGR of 12.4% from 2026 to 2035. The country maintains a leading global position due to stringent vehicle safety frameworks, expanding connected vehicle initiatives, and active regulatory supervision. Driving conditions are characterized by high-speed road networks and diverse mobility environments prompting manufacturers to intensify validation of advanced automation features. As a result, extensive simulation of complex traffic scenarios is required to meet compliance standards and ensure performance reliability. The strong presence of automotive OEMs, semiconductor innovators, and autonomous mobility startups further strengthens the United States' dominance in the ADAS simulation landscape.
Major companies operating in the Global ADAS Simulation Market include NVIDIA, Ansys, Siemens Digital Industries Software, dSPACE, IPG Automotive, MathWorks, Vector Informatik, Applied Intuition, Foretellix, and rFpro. Companies in the ADAS Simulation Market are reinforcing their competitive position through continuous innovation in scenario generation, AI-driven validation tools, and high-fidelity digital twin environments. Strategic partnerships with automotive OEMs and semiconductor manufacturers enable co-development of customized simulation frameworks tailored to next-generation vehicle architectures. Many vendors are expanding cloud infrastructure capabilities to support scalable, subscription-based service delivery models. Investment in real-time hardware integration and automated regression testing tools further enhances platform value. Additionally, companies prioritize interoperability with existing development toolchains, ensuring seamless integration across design, testing, and validation workflows while strengthening long-term enterprise relationships.
Table of Contents
Chapter 1 Methodology
- 1.1 Research approach
- 1.2 Quality commitments
- 1.3 Research trail and confidence scoring
- 1.3.1 Research trail components
- 1.3.2 Scoring components
- 1.4 Data collection
- 1.4.1 Partial list of primary sources
- 1.5 Data mining sources
- 1.5.1 Paid sources
- 1.6 Best estimates and calculations
- 1.6.1 Base year calculation for any one approach
- 1.7 Forecast model
- 1.8 Research transparency addendum
Chapter 2 Executive Summary
- 2.1 Industry 360° synopsis, 2022 - 2035
- 2.2 Key market trends
- 2.2.1 Regional
- 2.2.2 Offering
- 2.2.3 Vehicles
- 2.2.4 ADAS Features
- 2.2.5 Simulation
- 2.2.6 Deployment Mode
- 2.2.7 End Use
- 2.3 TAM Analysis, 2026-2035
Chapter 3 Industry Insights
- 3.1 Industry ecosystem analysis
- 3.1.1 Supplier landscape
- 3.1.2 Profit margin analysis
- 3.1.3 Cost structure
- 3.1.4 Value addition at each stage
- 3.1.5 Factor affecting the value chain
- 3.1.6 Disruptions
- 3.2 Industry impact forces
- 3.2.1 Growth drivers
- 3.2.1.1 Rising stringency in government safety regulations
- 3.2.1.2 Need to reduce physical testing costs
- 3.2.1.3 Accelerated development timelines for ADAS
- 3.2.1.4 Growth in autonomous vehicle development
- 3.2.1.5 Technological advancements in AI & sensor fusion
- 3.2.2 Industry pitfalls and challenges
- 3.2.2.1 High initial investment for simulation platforms
- 3.2.2.2 Lack of standardization across platforms
- 3.2.2.3 Physics-accurate sensor modeling complexity
- 3.2.2.4 Skilled workforce shortage
- 3.2.3 Market opportunities
- 3.2.3.1 Simulation-as-a-service (SaaS) business models
- 3.2.3.2 Expansion into emerging autonomous vehicle markets
- 3.2.3.3 Regional market growth in Asia Pacific
- 3.2.3.4 Integration with generative AI for scenario creation
- 3.2.3.5 V2X (vehicle-to-everything) simulation
- 3.2.1 Growth drivers
- 3.3 Growth potential analysis
- 3.4 Regulatory landscape
- 3.4.1 North America
- 3.4.1.1 US- Federal safety rules & ADAS deployment guidance
- 3.4.1.2 Canada - Safety framework for connected & automated vehicles (CASF)
- 3.4.2 Europe
- 3.4.2.1 Germany- EU ITS & national initiatives
- 3.4.2.2 UK- Post-Brexit ADAS flexibility
- 3.4.2.3 France- National ADAS testing & ITS strategy
- 3.4.2.4 Italy- ITS pilots & smart infrastructure
- 3.4.3 Asia Pacific
- 3.4.3.1 China- MIIT C-V2X mandates & standards
- 3.4.3.2 India- Emerging ADAS & automotive connectivity regulations
- 3.4.3.3 Japan- ITS connect & spectrum policy
- 3.4.3.4 Australia- Technology neutral ITS policies
- 3.4.4 LATAM
- 3.4.4.1 Mexico- NOM vehicle safety standards
- 3.4.4.2 Argentina- National traffic law 24.449
- 3.4.5 MEA
- 3.4.5.1 South Africa- National road traffic act (1996)
- 3.4.5.2 Saudi Arabia- Traffic law & vision 2030 transport initiatives
- 3.4.1 North America
- 3.5 Porter’s analysis
- 3.6 PESTEL analysis
- 3.7 Technology and innovation landscape
- 3.7.1 Current technological trends
- 3.7.1.1 Physics-based sensor simulation advances
- 3.7.1.2 AI & machine learning integration
- 3.7.1.3 Generative AI for scenario creation
- 3.7.2 Emerging technologies
- 3.7.2.1 Real-time simulation capabilities
- 3.7.2.2 Digital twin technologies
- 3.7.2.3 Cloud-native simulation platforms
- 3.7.1 Current technological trends
- 3.8 Patent analysis
- 3.8.1 Key patent trends
- 3.8.2 Technology innovation hotspots
- 3.8.3 Patent filing by key players
- 3.8.4 Emerging IP strategies
- 3.9 Pricing analysis
- 3.9.1 Software licensing models
- 3.9.2 Subscription-based pricing
- 3.9.3 Engineering services pricing structures
- 3.9.4 Total cost of ownership (TCO) analysis
- 3.10 Use cases & success stories
- 3.10.1 OEM use cases
- 3.10.2 Tier-1 supplier use cases
- 3.10.3 Technology developer use cases
- 3.11 Sustainability and environmental aspects
- 3.11.1 Sustainable practices
- 3.11.2 Waste reduction strategies
- 3.11.3 Energy efficiency in production
- 3.11.4 Eco-friendly Initiatives
- 3.11.5 Carbon footprint considerations
- 3.12 OEM & Tier-1 Adoption Maturity Index
Chapter 4 Competitive Landscape, 2025
- 4.1 Introduction
- 4.2 Company market share analysis
- 4.2.1 North America
- 4.2.2 Europe
- 4.2.3 Asia Pacific
- 4.2.4 LATAM
- 4.2.5 MEA
- 4.3 Competitive analysis of major market players
- 4.4 Competitive positioning matrix
- 4.5 Strategic outlook matrix
- 4.6 Key developments
- 4.6.1 Mergers & acquisitions
- 4.6.2 Partnerships & collaborations
- 4.6.3 New product launches
- 4.6.4 Expansion plans and funding
Chapter 5 Market Estimates & Forecast, By Offering, 2022 - 2035 ($Bn)
- 5.1 Key trends
- 5.2 Software
- 5.2.1 Simulation software platforms
- 5.2.2 Application software
- 5.2.3 Sensor simulation software
- 5.2.4 Scenario generation tools
- 5.2.5 D/physics-based modeling tools
- 5.3 Services
- 5.3.1 Professional services
- 5.3.2 Managed services
Chapter 6 Market Estimates & Forecast, By Vehicles, 2022 - 2035 ($Bn)
- 6.1 Key trends
- 6.2 Passenger cars
- 6.2.1 Hatchbacks
- 6.2.2 SUV
- 6.2.3 Sedan
- 6.3 Commercial vehicles
- 6.3.1 Light commercial vehicles (LCVs)
- 6.3.2 Medium commercial vehicles (MCVs)
- 6.3.3 Heavy commercial vehicles (HCVs)
Chapter 7 Market Estimates & Forecast, By ADAS Features, 2022 - 2035 ($Bn)
- 7.1 Key trends
- 7.2 Adaptive cruise control (ACC)
- 7.3 Lane keeping/departure systems
- 7.4 Automated parking assist
- 7.5 Collision avoidance systems
- 7.6 Traffic jam assistance
- 7.7 Highway pilot/full self-driving
- 7.8 Blind spot detection
- 7.9 Others
Chapter 8 Market Estimates & Forecast, By Simulation, 2022 - 2035 ($Bn)
- 8.1 Key trends
- 8.2 Model-in-the-loop (MIL)
- 8.3 Software-in-the-loop (SIL)
- 8.4 Processor-in-the-loop (PIL)
- 8.5 Hardware-in-the-loop (HIL)
- 8.6 Driver-in-the-loop (DIL)
Chapter 9 Market Estimates & Forecast, By Deployment Mode, 2022 - 2035 ($Bn)
- 9.1 Key trends
- 9.2 On premises
- 9.3 Cloud-based
- 9.4 Hybrid
Chapter 10 Market Estimates & Forecast, By End Use, 2022 - 2035 ($Bn)
- 10.1 Key trends
- 10.2 Automotive OEMs
- 10.3 Tier 1 & Tier 2 suppliers
- 10.4 Technology providers & software developers
- 10.5 Semiconductor & hardware vendors
- 10.6 Others
Chapter 11 Market Estimates & Forecast, By Region, 2022 - 2035 ($Bn)
- 11.1 Key trends
- 11.2 North America
- 11.2.1 US
- 11.2.2 Canada
- 11.3 Europe
- 11.3.1 Germany
- 11.3.2 UK
- 11.3.3 France
- 11.3.4 Italy
- 11.3.5 Spain
- 11.3.6 Russia
- 11.3.7 Netherlands
- 11.3.8 Sweden
- 11.3.9 Denmark
- 11.3.10 Poland
- 11.4 Asia Pacific
- 11.4.1 China
- 11.4.2 India
- 11.4.3 Japan
- 11.4.4 Australia
- 11.4.5 South Korea
- 11.4.6 Singapore
- 11.4.7 Thailand
- 11.4.8 Indonesia
- 11.4.9 Vietnam
- 11.5 Latin America
- 11.5.1 Brazil
- 11.5.2 Mexico
- 11.5.3 Argentina
- 11.5.4 Colombia
- 11.6 MEA
- 11.6.1 South Africa
- 11.6.2 Saudi Arabia
- 11.6.3 UAE
- 11.6.4 Israel
Chapter 12 Company Profiles
- 12.1 Global Players
- 12.1.1 Ansys
- 12.1.2 Applied Intuition
- 12.1.3 AVL List
- 12.1.4 dSPACE
- 12.1.5 Foretellix
- 12.1.6 IPG Automotive
- 12.1.7 MathWorks
- 12.1.8 MSC Software
- 12.1.9 Siemens Digital Industries
- 12.1.10 Vector Informatik
- 12.2 Regional Players
- 12.2.1 AIMotive
- 12.2.2 Baidu
- 12.2.3 CARLA
- 12.2.4 Cognata
- 12.2.5 ETAS
- 12.2.6 Hexagon
- 12.2.7 NVIDIA
- 12.2.8 rFpro
- 12.2.9 TASS International
- 12.2.10 VI-grade
- 12.3 Emerging Players & Technology Enablers
- 12.3.1 Luminar Technologies
- 12.3.2 Metamoto
- 12.3.3 Oxbotica
- 12.3.4 Parallel Domain
- 12.3.5 Wayve
 青少年駕駛員技術市場:按技術類型、連接類型、部署模式、應用和分銷管道分類-2026-2032年全球市場預測
 2026年全球高階駕駛輔助系統(ADAS)市場報告ADAS和自動駕駛感測器維護設備市場:按設備類型、感測器類型、維護類型、車輛類型、最終用戶和分銷管道分類-2026-2032年全球市場預測汽車感測器清潔系統市場:按系統類型、感測器類型、自動駕駛等級和車輛類型分類-2026-2032年全球市場預測汽車ADAS感測器市場:按車輛類型、自動駕駛等級、感測器類型和應用分類-2026-2032年全球市場預測
 即時碰撞預測系統市場預測至 2034 年:全球分析(按組件、車輛類型、部署模式、最終用戶和地區分類)
 汽車邊緣人工智慧市場:策略性洞察與預測(2026-2031年)駕駛員在環模擬器市場:按模擬器類型、車輛類型、部署模式、應用和最終用戶分類 - 全球預測,2026-2032 年汽車ADAS校準設備市場(按設備類型、校準方法、車輛類型和分銷管道分類),全球預測(2026-2032年)汽車ADAS標定工具市場(按車輛類型、部署模式、標定類型、系統類型、標定方法、最終用戶和銷售管道),全球預測,2026-2032年