

 |
市場調查報告書
商品編碼
1936673
水下連接器市場機會、成長要素、產業趨勢分析及預測(2026年至2035年)Underwater Connectors Market Opportunity, Growth Drivers, Industry Trend Analysis, and Forecast 2026 - 2035 |
||||||
全球水下連接器市場預計到 2025 年將達到 18 億美元,到 2035 年將達到 37 億美元,年複合成長率為 7.8%。
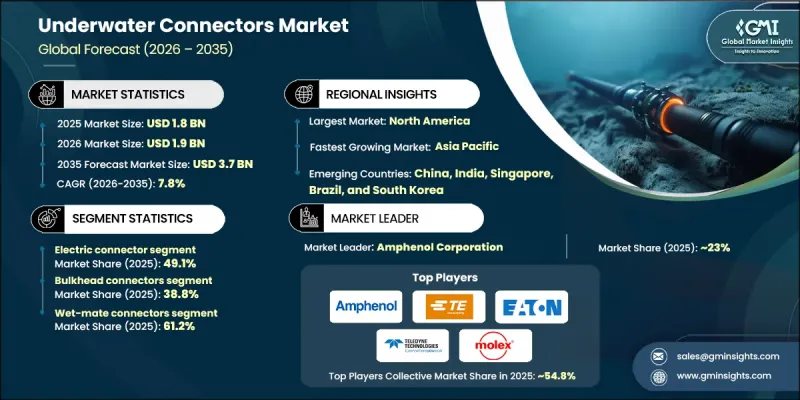
市場擴張的驅動力來自海上石油探勘的增加、海底電力和通訊網路的部署,以及遠程操作車輛(ROV) 和自主水下航行器 (AUV) 的日益普及。不斷成長的基本客群,包括能源供應商、國防專案、通訊聯盟、海洋研究機構和新興的水下資料中心營運商,推動了對滿足其獨特電壓、深度和可靠性標準的連接器的需求。海上能源計劃、海底光纖線路和高壓風電互連對乾插拔連接器的需求日益成長。支援人工智慧驅動流量、高密度光纖網路和模組化服務型海底系統的光纖基礎設施投資增加,進一步推動了需求,使水下連接器成為不斷發展的海底生態系統中的關鍵組件。
| 市場覆蓋範圍 | |
|---|---|
| 開始年份 | 2025 |
| 預測年份 | 2026-2035 |
| 起始值 | 18億美元 |
| 預測金額 | 37億美元 |
| 複合年成長率 | 7.8% |
預計到2025年,電氣連接器市佔率將達到49.1%。海底樞紐、深水油氣系統、偵測機器人和離岸風力發電電場都依賴堅固耐用且耐環境腐蝕的電氣連接器。美國蓬勃發展的海上作業正在推動對海底電力基礎設施的投資,使電氣連接器穩固地成為關鍵細分市場;同時,高壓幹插拔組件在浮動式風力發電和併網系統中也越來越受歡迎。
預計到2025年,艙壁連接器市佔率將達到38.8%。艙壁連接器對於在海底外殼和控制模組之間可靠地分配電力和數據至關重要。為了滿足不斷變化的海底應用需求,製造商正致力於研發耐腐蝕、高性能的艙壁連接器設計,以提供更佳的密封性、更高的功率密度和更高的資料傳輸速率。
預計到 2025 年,北美水下連接器市場將佔 38.6% 的佔有率。該地區的成長得益於海底電纜安裝量的增加、離岸風力發電計劃的推進以及國防和能源項目投資的增加,同時監管部門的支持和海底系統的技術創新也推動了這一成長。
目錄
第1章調查方法和範圍
第2章執行摘要
第3章業界考察
- 生態系分析
- 供應商情況
- 利潤率
- 成本結構
- 每個階段的附加價值
- 影響價值鏈的因素
- 中斷
- 生態系分析
- 產業影響因素
- 促進要素
- 深水海上油氣業務不斷成長
- 擴大海底通訊基礎設施
- 海上可再生能源併網和電網成長
- 連接器材料和密封技術的進步
- 挑戰與困難
- 高昂的研發和製造成本
- 密封件和高壓濕式連接器的複雜性
- 市場機遇
- 連接器材料和密封技術的進步
- 擴大遠程操作車輛(ROV)的應用
- 促進要素
- 成長潛力分析
- 監管環境
- 北美洲
- 歐洲
- 亞太地區
- 拉丁美洲
- 中東和非洲
- 波特五力分析
- PESTEL 分析
- 科技與創新趨勢
- 當前技術趨勢
- 新興技術
- 新興經營模式
- 合規要求
- 永續性措施
- 消費者心理分析
- 專利和智慧財產權分析
- 地緣政治和貿易趨勢
第4章 競爭情勢
- 介紹
- 公司市佔率分析
- 按地區
- 北美洲
- 歐洲
- 亞太地區
- 拉丁美洲
- 中東和非洲
- 市場集中度分析
- 按地區
- 主要企業的競爭標竿分析
- 財務績效比較
- 收入
- 利潤率
- 研究與開發
- 產品系列比較
- 產品線的廣度
- 科技
- 創新
- 地理分佈比較
- 全球擴張分析
- 服務網路覆蓋
- 按地區分類的市場滲透率
- 競爭定位矩陣
- 領導企業
- 受讓人
- 追蹤者
- 小眾玩家
- 戰略展望矩陣
- 財務績效比較
- 2021-2024 年主要發展動態
- 併購
- 夥伴關係與合作
- 技術進步
- 擴張與投資策略
- 永續發展計劃
- 數位轉型計劃
- 新興/Start-Ups競賽的趨勢
第5章 依產品類型分類的市場估算與預測,2022-2035年
- 電氣連接器
- 光纖連接器
- 混合連接器
第6章 依機械結構分類的市場估計與預測,2022-2035年
- 隔板連接器(面板安裝型)
- 在線連續連接器(電纜對電纜連接)
- 穿透連接器(耐壓殼體穿透)
- 其他
7. 依配種方式分類的市場估計與預測,2022-2035年
- 濕式連接器
- Drymate 連接器
第8章 按材質的市場估算與預測,2022-2035年
- 金屬
- 不銹鋼
- 鈦
- 複合材料
- 塑膠和聚合物
- 橡皮
第9章 依連接器類型分類的市場估算與預測,2022-2035年
- 圓形連接器
- 矩形連接器
- 其他
- 橢圓形
- D型
- 風俗
第10章 依深度分類的市場估計與預測,2022-2035年
- 淺水區(水深小於200公尺)
- 中等深度(200-1000公尺)
- 深海域(1000-3000公尺)
- 超深海(超過3000公尺/超過10000公尺)
第11章 依電壓等級分類的市場估算與預測,2022-2035年
- 低電壓(低於1000V)
- 中壓(1000V 至 10kV)
- 高壓(超過10千伏特)
第12章 按應用領域分類的市場估算與預測,2022-2035年
- 海上油氣
- 潛水艇通訊
- 國防和海軍
- 海洋調查
- 可再生能源
- 其他
- 海底採礦
- 水產養殖
- ROV
第13章 2022-2035年各地區市場估算與預測
- 北美洲
- 美國
- 加拿大
- 歐洲
- 德國
- 英國
- 法國
- 西班牙
- 義大利
- 荷蘭
- 亞太地區
- 中國
- 印度
- 日本
- 澳洲
- 韓國
- 拉丁美洲
- 巴西
- 墨西哥
- 阿根廷
- 中東和非洲
- 南非
- 沙烏地阿拉伯
- 阿拉伯聯合大公國
第14章:公司簡介
- Amphenol Corp.
- Baker Hughes(GE Company LLC)
- Eaton Corporation
- Fischer Connectors
- Glenair Inc.
- Hydro Group
- MacArtney
- Molex
- Smiths Group Plc
- TE Connectivity
- Teledyne
The Global Underwater Connectors Market was valued at USD 1.8 billion in 2025 and is estimated to grow at a CAGR of 7.8% to reach USD 3.7 billion by 2035.
Market expansion is driven by rising offshore oil and gas exploration, the deployment of subsea power and communication networks, and increased utilization of remotely operated vehicles (ROVs) and autonomous underwater vehicles (AUVs). A widening customer base, including energy operators, defense programs, telecom consortia, ocean research institutions, and emerging underwater data-center operators, is driving demand for connectors that meet unique voltage, depth, and reliability standards. Both wet-mate and dry-mate connectors are increasingly sought after for offshore energy projects, undersea fiber routes, and high-voltage wind interconnections. Rising fiber-optic infrastructure investments to support AI-driven traffic, denser optical networks, and modular serviceable subsea systems further amplify demand, positioning underwater connectors as critical components in the evolving subsea ecosystem.
| Market Scope | |
|---|---|
| Start Year | 2025 |
| Forecast Year | 2026-2035 |
| Start Value | $1.8 Billion |
| Forecast Value | $3.7 Billion |
| CAGR | 7.8% |
The electric connector segment captured 49.1% share in 2025. Subsea hubs, deepwater oil and gas systems, inspection-class robotics, and offshore wind installations rely on robust, ruggedized electrical connectors. Strong offshore activity in the U.S. is boosting investment in subsea power infrastructure, solidifying electric connectors as a leading segment while high-voltage dry-mate assemblies gain traction in floating wind and grid-tie systems.
The bulkhead connectors segment held a 38.8% share in 2025. Bulkhead connectors are essential for providing reliable power and data feedthroughs across subsea housing and control module boundaries. Manufacturers are focusing on corrosion-resistant, high-performance bulkhead designs with improved sealing, high power densities, and high data rates to meet evolving subsea requirements.
North America Underwater Connectors Market held a 38.6% share in 2025. Growth in the region is fueled by increasing submarine cable deployment, offshore wind projects, and investments in defense and energy programs, along with regulatory support and technological innovation in subsea systems.
Key players in the Global Underwater Connectors Market include TE Connectivity, Amphenol Corp., MacArtney, Fischer Connectors, Smiths Group Plc, Molex, Glenair Inc., Baker Hughes (GE Company LLC), Eaton Corporation, Hydro Group, and Teledyne. Companies in the underwater connectors market strengthen their positions through several strategic initiatives. They invest in R&D to enhance corrosion resistance, high-pressure tolerance, and multi-signal compatibility. Collaboration with energy, defense, and telecom clients ensures custom solutions for subsea projects. Firms expand manufacturing and service facilities near offshore hubs to improve delivery efficiency. Adoption of modular, serviceable designs and standardization across subsea platforms increases compatibility and reduces maintenance downtime. Strategic acquisitions and partnerships help broaden geographic reach, enhance product portfolios, and maintain competitive advantages in an increasingly complex and technologically demanding market.
Table of Contents
Chapter 1 Methodology and Scope
- 1.1 Market scope and definition
- 1.2 Research design
- 1.2.1 Research approach
- 1.2.2 Data collection methods
- 1.3 Data mining sources
- 1.3.1 Global
- 1.3.2 Regional/Country
- 1.4 Base estimates and calculations
- 1.4.1 Base year calculation
- 1.4.2 Key trends for market estimation
- 1.5 Primary research and validation
- 1.5.1 Primary sources
- 1.6 Forecast model
- 1.7 Research assumptions and limitations
Chapter 2 Executive summary
- 2.1 Industry 3600 synopsis
- 2.2 Key market trends
- 2.2.1 Product type trends
- 2.2.2 Mechanical structure trends
- 2.2.3 Mating methods trends
- 2.2.4 Material type trends
- 2.2.5 Connector shape trends
- 2.2.6 Depth rating trends
- 2.2.7 Voltage rating trends
- 2.2.8 Application trends
- 2.2.9 Regional trends
- 2.3 TAM Analysis, 2026-2035 (USD Million)
- 2.4 CXO perspectives: Strategic imperatives
- 2.4.1 Executive decision points
- 2.4.2 critical success factors
- 2.5 Future outlook and strategic recommendations
Chapter 3 Industry insights
- 3.1 Industry ecosystem analysis
- 3.1.1 Supplier landscape
- 3.1.2 Profit margin
- 3.1.3 Cost structure
- 3.1.4 Value addition at each stage
- 3.1.5 Factor affecting the value chain
- 3.1.6 Disruptions
- 3.2 Industry ecosystem analysis
- 3.3 Industry impact forces
- 3.3.1 Growth drivers
- 3.3.1.1 Rising offshore oil & gas deepwater operations
- 3.3.1.2 Expansion in subsea telecommunications infrastructure
- 3.3.1.3 Growth in offshore renewable energy integration & grid
- 3.3.1.4 Advancements in connector materials and sealing technologies
- 3.3.2 Pitfalls and challenges
- 3.3.2.1 High development and manufacturing costs
- 3.3.2.2 Complexities in sealing and high-voltage wet-mate connectors
- 3.3.3 Market opportunities
- 3.3.3.1 Advancements in connector materials and sealing technologies
- 3.3.3.2 Increasing adoption of remotely operated vehicles (ROVs)
- 3.3.1 Growth drivers
- 3.4 Growth potential analysis
- 3.5 Regulatory landscape
- 3.5.1 North America
- 3.5.2 Europe
- 3.5.3 Asia Pacific
- 3.5.4 Latin America
- 3.5.5 Middle East & Africa
- 3.6 Porter's analysis
- 3.7 PESTEL analysis
- 3.8 Technology and Innovation landscape
- 3.8.1 Current technological trends
- 3.8.2 Emerging technologies
- 3.9 Emerging Business Models
- 3.10 Compliance Requirements
- 3.11 Sustainability Measures
- 3.12 Consumer Sentiment Analysis
- 3.13 Patent and IP analysis
- 3.14 Geopolitical and trade dynamics
Chapter 4 Competitive landscape, 2025
- 4.1 Introduction
- 4.2 Company market share analysis
- 4.2.1 By region
- 4.2.1.1 North America
- 4.2.1.2 Europe
- 4.2.1.3 Asia Pacific
- 4.2.1.4 Latin America
- 4.2.1.5 Middle East & Africa
- 4.2.2 Market concentration analysis
- 4.2.1 By region
- 4.3 Competitive benchmarking of key players
- 4.3.1 Financial performance comparison
- 4.3.1.1 Revenue
- 4.3.1.2 Profit margin
- 4.3.1.3 R&D
- 4.3.2 Product portfolio comparison
- 4.3.2.1 Product range breadth
- 4.3.2.2 Technology
- 4.3.2.3 Innovation
- 4.3.3 Geographic presence comparison
- 4.3.3.1 Global footprint analysis
- 4.3.3.2 Service network coverage
- 4.3.3.3 Market penetration by region
- 4.3.4 Competitive positioning matrix
- 4.3.4.1 Leaders
- 4.3.4.2 Challengers
- 4.3.4.3 Followers
- 4.3.4.4 Niche players
- 4.3.5 Strategic outlook matrix
- 4.3.1 Financial performance comparison
- 4.4 Key developments, 2021-2024
- 4.4.1 Mergers and acquisitions
- 4.4.2 Partnerships and collaborations
- 4.4.3 Technological advancements
- 4.4.4 Expansion and investment strategies
- 4.4.5 Sustainability initiatives
- 4.4.6 Digital transformation initiatives
- 4.5 Emerging/ startup competitors landscape
Chapter 5 Market Estimates and Forecast, By Product Type, 2022 - 2035 (USD Million)
- 5.1 Key trends
- 5.2 Electrical Connectors
- 5.3 Optical Connectors
- 5.4 Hybrid Connectors
Chapter 6 Market Estimates and Forecast, By Mechanical Structure, 2022 - 2035 (USD Million)
- 6.1 Key trends
- 6.2 Bulkhead Connectors (Panel-Mount)
- 6.3 Inline Connectors (Cable-to-Cable)
- 6.4 Penetrator Connectors (Pressure Hull Feedthrough)
- 6.5 Others
Chapter 7 Market Estimates and Forecast, By Mating Method, 2022 - 2035 (USD Million)
- 7.1 Key trends
- 7.2 Wet-Mate Connectors
- 7.3 Dry-Mate Connectors
Chapter 8 Market Estimates and Forecast, By Material Type, 2022 - 2035 (USD Million)
- 8.1 Key trends
- 8.2 Metals
- 8.2.1 Stainless steel
- 8.2.2 Titanium
- 8.3 Composites
- 8.4 Plastics & Polymers
- 8.5 Rubber
Chapter 9 Market Estimates and Forecast, By Connector Shape, 2022 - 2035 (USD Million)
- 9.1 Key trends
- 9.2 Circular Connectors
- 9.3 Rectangular Connectors
- 9.4 Others
- 9.4.1 Oval
- 9.4.2 D-type
- 9.4.3 Custom
Chapter 10 Market Estimates and Forecast, By Depth Rating, 2022 - 2035 (USD Million)
- 10.1 Key trends
- 10.2 Shallow Water (<200m)
- 10.3 Medium Depth (200-1,000m)
- 10.4 Deep Water (1,000-3,000m)
- 10.5 Ultra-Deep Water (>3,000m / >10,000m)
Chapter 11 Market Estimates and Forecast, By Voltage Rating, 2022 - 2035 (USD Million)
- 11.1 Key trends
- 11.2 Low Voltage (<1,000V)
- 11.3 Medium Voltage (1,000V - 10kV)
- 11.4 High Voltage (>10kV)
Chapter 12 Market Estimates and Forecast, By Application, 2022 - 2035 (USD Million)
- 12.1 Key trends
- 12.2 Offshore Oil & Gas
- 12.3 Subsea Telecommunications
- 12.4 Defense & Naval
- 12.5 Oceanographic Research
- 12.6 Renewable Energy
- 12.7 Others
- 12.7.1 Subsea Mining
- 12.7.2 Aquaculture
- 12.7.3 ROVs
Chapter 13 Market Estimates and Forecast, By Region, 2022 - 2035 (USD Million)
- 13.1 Key trends
- 13.2 North America
- 13.2.1 U.S.
- 13.2.2 Canada
- 13.3 Europe
- 13.3.1 Germany
- 13.3.2 UK
- 13.3.3 France
- 13.3.4 Spain
- 13.3.5 Italy
- 13.3.6 Netherlands
- 13.4 Asia Pacific
- 13.4.1 China
- 13.4.2 India
- 13.4.3 Japan
- 13.4.4 Australia
- 13.4.5 South Korea
- 13.5 Latin America
- 13.5.1 Brazil
- 13.5.2 Mexico
- 13.5.3 Argentina
- 13.6 Middle East and Africa
- 13.6.1 South Africa
- 13.6.2 Saudi Arabia
- 13.6.3 UAE
Chapter 14 Company Profiles
- 14.1 Amphenol Corp.
- 14.2 Baker Hughes (GE Company LLC)
- 14.3 Eaton Corporation
- 14.4 Fischer Connectors
- 14.5 Glenair Inc.
- 14.6 Hydro Group
- 14.7 MacArtney
- 14.8 Molex
- 14.9 Smiths Group Plc
- 14.10 TE Connectivity
- 14.11 Teledyne


