


 |
市場調查報告書
商品編碼
1936638
倉庫模擬市場機會、成長要素、產業趨勢分析及2026年至2035年預測Warehouse Simulation Market Opportunity, Growth Drivers, Industry Trend Analysis, and Forecast 2026 - 2035 |
||||||
全球倉庫模擬市場預計到 2025 年將達到 8.067 億美元,到 2035 年將達到 29 億美元,年複合成長率為 14.3%。
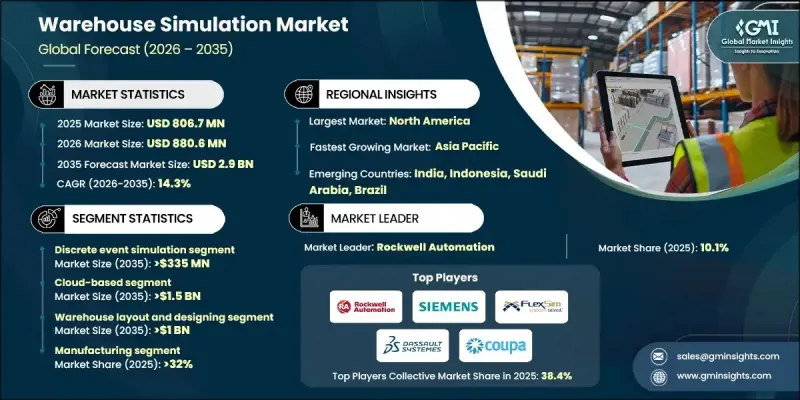
電子商務的快速發展和現代倉儲營運日益複雜化是推動市場成長的主要因素。如今,倉儲環境需要管理多樣化的訂單結構、應對波動的需求週期以及滿足全通路履約要求,所有這些都增加了營運負擔。為了因應這些挑戰,各組織正在加速採用模擬平台,以便在進行資本投資之前評估績效、提高效率並降低風險。倉儲模擬工具使操作人員能夠模擬營運場景、分析人機互動、最佳化物料流並在實施前發現效率低下的環節。對於整合多個先進系統和流程的設施而言,這種能力尤其重要,因為協調不當可能導致成本大幅超支。模擬已成為核心的規劃和檢驗工具,使企業能夠在日益動態的營運環境中證明投資的合理性、提高吞吐量並維持服務水準。
| 市場覆蓋範圍 | |
|---|---|
| 開始年份 | 2025 |
| 預測年份 | 2026-2035 |
| 起始值 | 8.067億美元 |
| 預測金額 | 29億美元 |
| 複合年成長率 | 14.3% |
基於雲端的倉庫模擬平台憑藉其擴充性、低前期成本和支援分散式協作的能力,正獲得廣泛關注。這些解決方案提供對仿真環境的靈活訪問,使各種規模的組織都能使用先進的規劃工具。將數位雙胞胎功能整合到倉庫模擬平台中,進一步變革了設施設計和營運管理。數位雙胞胎能夠創建實體倉庫的即時虛擬模型,從而實現持續的測試、最佳化和預測分析,而不會中斷實際營運。這種方法支援即時數據驅動的調整,從而提高決策準確性、流程彈性並降低營運風險。
截至2025年,離散事件模擬領域佔據了42%的市場佔有率,預計到2035年將達到3.35億美元。該領域的成長主要得益於行動模擬工具的日益普及,這些工具能夠即時獲取結果並加快決策速度。這些平台有助於改善員工安全規劃、降低營運風險,並更好地應對力不斷變化的倉庫環境。使用者友善的介面支援透過行動裝置快速進行場景評估、參數調整和效能追蹤,從而提升倉庫的整體靈活性。
預計到2025年,基於雲端的部署模式將佔據53.5%的市場佔有率,到2035年市場規模將達到15億美元。雲端託管的模擬解決方案可與企業軟體生態系統無縫整合,實現倉庫營運中的無縫資料交換和統一分析。這種部署方式簡化了連接,支援即時同步,並提升了整個物流網路的端到端視覺性。雲端平台使多個相關人員能夠遠端存取、修改和評估模擬模型,從而增強協作,支援更快、更明智的決策。
美國倉庫模擬市場預計到2025年將達到2.604億美元,並在2026年至2035年間保持強勁成長。成長的主要驅動力是配送和履約設施中自動化、進階分析和數據驅動型營運規劃的日益普及。企業正在利用模擬工具來改善高吞吐量環境下的佈局設計、勞動力利用率和物料流效率。倉庫擴建和現代化計劃中對安全性、成本控制和營運效率的日益重視,也持續加速著模擬技術在美國的普及應用。
目錄
第1章調查方法
第2章執行摘要
第3章業界考察
- 生態系分析
- 供應商情況
- 利潤率分析
- 成本結構
- 每個階段的附加價值
- 影響價值鏈的因素
- 中斷
- 產業影響因素
- 促進要素
- 電子商務的快速成長
- 將自動化和機器人技術融入倉庫運營
- 對勞動力管理日益成長的需求
- 倉儲營運中對成本最佳化的需求日益成長
- 產業潛在風險與挑戰
- 數據整合挑戰
- 技術複雜性
- 市場機遇
- 智慧自動化倉庫的擴張
- 物流網路中數位雙胞胎實施現狀
- 電子商務和全通路履約的成長
- 新興市場倉儲基礎建設發展
- 促進要素
- 成長潛力分析
- 監管環境
- 北美洲
- 美國:職業安全與健康管理局 (OSHA)、國家標準與技術研究院 (NIST) 和資料安全法規
- 加拿大:CCOHS 和數位安全合規性
- 歐洲
- 英國:UKCA 標記和數字合規標準
- 德國:TUV認證和工業4.0標準
- 法國:CE認證與歐盟數位法規
- 義大利:ISO 9001品管標準與歐盟數位安全標準
- 亞太地區
- 中國:網路安全法與產業軟體標準
- 日本:經濟產業省指南與《產業安全衛生法》
- 印度:電子資訊技術部指南和數位物流政策
- 拉丁美洲
- 巴西:LGPD 資料保護與產業合規標準
- 墨西哥:資料保護法和工業安全法規
- 阿根廷:IRAM 標準和基於 ISO 的品質框架
- 中東和非洲
- 阿拉伯聯合大公國:數位政府政策與ISO標準
- 南非:《個人資訊保護法》和《工業安全條例》
- 其他中東和非洲國家:ISO、IEC 和資料安全框架
- 北美洲
- 波特五力分析
- PESTEL 分析
- 科技與創新趨勢
- 當前技術趨勢
- 新興技術
- 成本細分分析
- 專利分析
- 永續性和環境方面
- 永續實踐
- 減少廢棄物策略
- 生產中的能源效率
- 環保舉措
- 未來市場展望與機遇
- 用例
- 經濟影響和投資收益(ROI) 評估
- 資料管治、隱私與網路安全框架
第4章 競爭情勢
- 介紹
- 公司市佔率分析
- 北美洲
- 歐洲
- 亞太地區
- 拉丁美洲
- 中東和非洲
- 主要市場公司的競爭分析
- 競爭定位矩陣
- 戰略展望矩陣
- 重大進展
- 併購
- 夥伴關係與合作
- 新產品發布
- 企業擴張計畫和資金籌措
第5章 基於模擬技術的市場估算與預測,2022-2035年
- 離散事件模擬(DES)
- 系統動力學
- 混合
- 過程模擬
第6章 按應用領域分類的市場估算與預測,2022-2035年
- 庫存和空間最佳化
- 訂單揀選和履約模擬
- 勞動力管理
- 物料流管理
- 倉庫佈局與設計
- 風險與安全分析
第7章 依實施類型分類的市場估計與預測,2022-2035年
- 本地部署
- 基於雲端的
- 混合
第8章 依最終用途分類的市場估算與預測,2022-2035年
- 零售與電子商務
- 物流/運輸
- 製造業
- 車
- 衛生保健
- 其他
第9章 2022-2035年各地區市場估算與預測
- 北美洲
- 美國
- 加拿大
- 歐洲
- 德國
- 英國
- 法國
- 義大利
- 西班牙
- 俄羅斯
- 荷蘭
- 比利時
- 波蘭
- 亞太地區
- 中國
- 印度
- 日本
- 澳洲
- 韓國
- 新加坡
- 泰國
- 印尼
- 越南
- 拉丁美洲
- 巴西
- 墨西哥
- 阿根廷
- 哥倫比亞
- 中東和非洲
- 南非
- 沙烏地阿拉伯
- 阿拉伯聯合大公國
- 土耳其
第10章:公司簡介
- 世界玩家
- AnyLogic
- Dassault Systemes
- Dematic
- FlexSim(Autodesk Company)
- Honeywell
- Oracle
- Rockwell Automation
- SAP
- Siemens
- Epicor
- PTV Group
- 區域玩家
- Mecalux
- Godrej Korber
- Production Modelling Corporation(PMC)
- Applied Materials
- Incontrol
- Emerging/Disruptor Players
- Simio
- BigBear.ai
- Coupa Software
- CreateASoft
- Lanner Group
- Visual Components
- InterDynamics
- Optricity
- Twinzo
The Global Warehouse Simulation Market was valued at USD 806.7 million in 2025 and is estimated to grow at a CAGR of 14.3% to reach USD 2.9 billion by 2035.
Market expansion is tied to the rapid evolution of e-commerce and the growing complexity of modern warehouse operations. Warehousing environments now manage diverse order structures, fluctuating demand cycles, and omnichannel fulfillment requirements, all of which increase operational pressure. To address these challenges, organizations are increasingly turning to simulation platforms to evaluate performance, improve efficiency, and reduce risk prior to capital investment. Warehouse simulation tools allow operators to model operational scenarios, analyze human-machine coordination, optimize material flow, and detect inefficiencies before deployment. This capability is particularly critical as facilities integrate multiple advanced systems and processes, where improper alignment can result in significant cost overruns. Simulation has become a core planning and validation tool, enabling companies to justify investments, improve throughput, and maintain service levels under increasingly dynamic operating conditions.
| Market Scope | |
|---|---|
| Start Year | 2025 |
| Forecast Year | 2026-2035 |
| Start Value | $806.7 Million |
| Forecast Value | $2.9 Billion |
| CAGR | 14.3% |
Cloud-based warehouse simulation platforms are gaining strong traction due to their scalability, lower upfront costs, and ability to support distributed collaboration. These solutions provide flexible access to simulation environments, making advanced planning tools accessible to organizations of all sizes. Integration of digital twin capabilities within warehouse simulation platforms is further transforming facility design and operational management. Digital twins enable the creation of live virtual representations of physical warehouses, allowing continuous testing, optimization, and predictive analysis without disrupting real-world operations. This approach enhances decision accuracy, improves process resilience, and reduces operational risk by supporting data-driven adjustments in real time.
In 2025, the discrete event simulation segment accounted for 42% share and is projected to reach USD 335 million by 2035. Growth in this segment is supported by the increasing availability of mobile-enabled simulation tools that allow real-time access to results and faster decision-making. These platforms improve workforce safety planning, reduce operational risk, and enhance responsiveness to changing warehouse conditions. User-friendly interfaces enable rapid scenario evaluation, parameter adjustment, and performance tracking through portable devices, increasing agility across warehouse operations.
The cloud-based deployment model held 53.5% share in 2025 and is expected to reach USD 1.5 billion by 2035. Cloud-hosted simulation solutions integrate smoothly with enterprise software ecosystems, enabling seamless data exchange and unified analysis across warehouse operations. This deployment approach simplifies connectivity, supports real-time synchronization, and improves end-to-end visibility across logistics networks. Cloud platforms also strengthen collaboration by allowing multiple stakeholders to access, modify, and evaluate simulation models remotely, supporting faster and more informed decision-making.
U.S. Warehouse Simulation Market was valued at USD 260.4 million in 2025 and is expected to experience strong growth between 2026 and 2035. Expansion is being driven by increasing adoption of automation, advanced analytics, and data-driven operational planning across distribution and fulfillment facilities. Companies are using simulation tools to improve layout design, labor utilization, and material flow efficiency in high-volume environments. The growing emphasis on safety, cost control, and operational excellence during warehouse expansion and modernization initiatives continues to accelerate simulation adoption across the country.
Key companies operating in the Global Warehouse Simulation Market include Siemens, SAP, Oracle, Honeywell, Rockwell Automation, Dassault, AnyLogic, FlexSim, Simio, and Coupa. Companies active in the warehouse simulation market are strengthening their competitive position through continuous innovation, platform integration, and customer-centric solution development. Leading players are investing in advanced analytics, AI-enabled modeling, and digital twin integration to improve simulation accuracy and scalability. Many firms are expanding cloud-native offerings to increase accessibility and reduce deployment complexity for customers. Strategic partnerships with logistics providers and enterprise software vendors are enhancing ecosystem compatibility.
Table of Contents
Chapter 1 Methodology
- 1.1 Research approach
- 1.2 Quality commitments
- 1.2.1 GMI AI policy & data integrity commitment
- 1.3 Research trail & confidence scoring
- 1.3.1 Research trail components
- 1.3.2 Scoring components
- 1.4 Data collection
- 1.4.1 Partial list of primary sources
- 1.5 Data mining sources
- 1.5.1 Paid sources
- 1.6 Base estimates and calculations
- 1.6.1 Base year calculation
- 1.7 Forecast
- 1.8 Research transparency addendum
Chapter 2 Executive Summary
- 2.1 Industry 360° synopsis, 2022 - 2035
- 2.2 Key market trends
- 2.2.1 Regional
- 2.2.2 Simulation Technology
- 2.2.3 Application
- 2.2.4 Deployment
- 2.2.5 End Use
- 2.3 TAM Analysis, 2026-2035
- 2.4 CXO perspectives: Strategic imperatives
- 2.4.1 Executive decision points
- 2.4.2 Critical success factors
- 2.5 Future outlook & strategic recommendations
Chapter 3 Industry Insights
- 3.1 Industry ecosystem analysis
- 3.1.1 Supplier landscape
- 3.1.2 Profit margin analysis
- 3.1.3 Cost structure
- 3.1.4 Value addition at each stage
- 3.1.5 Factor affecting the value chain
- 3.1.6 Disruptions
- 3.2 Industry impact forces
- 3.2.1 Growth drivers
- 3.2.1.1 High e-commerce growth
- 3.2.1.2 Integration of automation and robotics in warehousing
- 3.2.1.3 Growing need for labor management
- 3.2.1.4 Increasing need for cost optimization in warehouse operations
- 3.2.2 Industry pitfalls & challenges
- 3.2.2.1 Data integration challenges
- 3.2.2.2 Technical complexity
- 3.2.3 Market opportunities
- 3.2.3.1 Expansion of Smart and Automated Warehouses
- 3.2.3.2 Digital Twin Adoption Across Logistics Networks
- 3.2.3.3 Growth in E-commerce and Omnichannel Fulfillment
- 3.2.3.4 Emerging Market Warehouse Infrastructure Development
- 3.2.1 Growth drivers
- 3.3 Growth potential analysis
- 3.4 Regulatory landscape
- 3.4.1 North America
- 3.4.1.1 United States: OSHA, NIST, and Data Security Regulations
- 3.4.1.2 Canada: CCOHS and Digital Security Compliance
- 3.4.2 Europe
- 3.4.2.1 United Kingdom: UKCA Marking and Digital Compliance Standards
- 3.4.2.2 Germany: TUV Certification and Industry 4.0 Standards
- 3.4.2.3 France: CE Compliance and EU Digital Regulations
- 3.4.2.4 Italy: ISO 9001 Quality and EU Digital Safety Standards
- 3.4.3 Asia Pacific
- 3.4.3.1 China: Cybersecurity Law and Industrial Software Standards
- 3.4.3.2 Japan: METI Guidelines and Industrial Safety Regulations
- 3.4.3.3 India: MeitY Guidelines and Digital Logistics Policies
- 3.4.4 Latin America
- 3.4.4.1 Brazil: LGPD Data Protection and Industrial Compliance Standards
- 3.4.4.2 Mexico: Data Protection Law and Industrial Safety Regulations
- 3.4.4.3 Argentina: IRAM Standards and ISO-Based Quality Frameworks
- 3.4.5 Middle East & Africa
- 3.4.5.1 United Arab Emirates: Digital Government Policies and ISO Standards
- 3.4.5.2 South Africa: POPIA and Industrial Safety Regulations
- 3.4.5.3 Other MEA Countries: ISO, IEC, and Data Security Frameworks
- 3.4.1 North America
- 3.5 Porter's analysis
- 3.6 PESTEL analysis
- 3.7 Technology and innovation landscape
- 3.7.1 Current technological trends
- 3.7.2 Emerging technologies
- 3.8 Cost breakdown analysis
- 3.9 Patent analysis
- 3.10 Sustainability and environmental aspects
- 3.10.1 Sustainable practices
- 3.10.2 Waste reduction strategies
- 3.10.3 Energy efficiency in production
- 3.10.4 Eco-friendly Initiatives
- 3.11 Future market outlook & opportunities
- 3.12 Use cases
- 3.13 Economic impact & ROI assessment
- 3.14 Data governance, privacy & cybersecurity frameworks
Chapter 4 Competitive Landscape, 2025
- 4.1 Introduction
- 4.2 Company market share analysis
- 4.2.1 North America
- 4.2.2 Europe
- 4.2.3 Asia Pacific
- 4.2.4 LATAM
- 4.2.5 MEA
- 4.3 Competitive analysis of major market players
- 4.4 Competitive positioning matrix
- 4.5 Strategic outlook matrix
- 4.6 Key developments
- 4.6.1 Mergers & acquisitions
- 4.6.2 Partnerships & collaborations
- 4.6.3 New Product Launches
- 4.6.4 Expansion Plans and funding
Chapter 5 Market Estimates & Forecast, By Simulation Technology, 2022 - 2035 (USD Mn)
- 5.1 Key trends
- 5.2 Discrete Event Simulation (DES)
- 5.3 System dynamics
- 5.4 Hybrid
- 5.5 Process simulation
Chapter 6 Market Estimates & Forecast, By Application, 2022 - 2035 (USD Mn)
- 6.1 Key trends
- 6.2 Inventory & space optimization
- 6.3 Order picking & fulfillment simulation
- 6.4 Workforce management
- 6.5 Material flow management
- 6.6 Warehouse layout and design
- 6.7 Risk & safety analysis
Chapter 7 Market Estimates & Forecast, By Deployment, 2022 - 2035 (USD Mn)
- 7.1 Key trends
- 7.2 On-premises
- 7.3 Cloud-based
- 7.4 Hybrid
Chapter 8 Market Estimates & Forecast, By End Use, 2022 - 2035 (USD Mn)
- 8.1 Key trends
- 8.2 Retail & e-commerce
- 8.3 Logistics & transportation
- 8.4 Manufacturing
- 8.5 Automotive
- 8.6 Healthcare
- 8.7 Others
Chapter 9 Market Estimates & Forecast, By Region, 2022 - 2035 (USD Mn)
- 9.1 Key trends
- 9.2 North America
- 9.2.1 US
- 9.2.2 Canada
- 9.3 Europe
- 9.3.1 Germany
- 9.3.2 UK
- 9.3.3 France
- 9.3.4 Italy
- 9.3.5 Spain
- 9.3.6 Russia
- 9.3.7 Netherlands
- 9.3.8 Belgium
- 9.3.9 Poland
- 9.4 Asia Pacific
- 9.4.1 China
- 9.4.2 India
- 9.4.3 Japan
- 9.4.4 Australia
- 9.4.5 South Korea
- 9.4.6 Singapore
- 9.4.7 Thailand
- 9.4.8 Indonesia
- 9.4.9 Vietnam
- 9.5 Latin America
- 9.5.1 Brazil
- 9.5.2 Mexico
- 9.5.3 Argentina
- 9.5.4 Colombia
- 9.6 MEA
- 9.6.1 South Africa
- 9.6.2 Saudi Arabia
- 9.6.3 UAE
- 9.6.4 Turkey
Chapter 10 Company Profiles
- 10.1 Global Players
- 10.1.1 AnyLogic
- 10.1.2 Dassault Systemes
- 10.1.3 Dematic
- 10.1.4 FlexSim (Autodesk Company)
- 10.1.5 Honeywell
- 10.1.6 Oracle
- 10.1.7 Rockwell Automation
- 10.1.8 SAP
- 10.1.9 Siemens
- 10.1.10 Epicor
- 10.1.11 PTV Group
- 10.2 Regional Players
- 10.2.1 Mecalux
- 10.2.2 Godrej Korber
- 10.2.3 Production Modelling Corporation (PMC)
- 10.2.4 Applied Materials
- 10.2.5 Incontrol
- 10.3 Emerging / Disruptor Players
- 10.3.1 Simio
- 10.3.2 BigBear.ai
- 10.3.3 Coupa Software
- 10.3.4 CreateASoft
- 10.3.5 Lanner Group
- 10.3.6 Visual Components
- 10.3.7 InterDynamics
- 10.3.8 Optricity
- 10.3.9 Twinzo
 倉庫模擬市場,按類型、按部署、按行業垂直、按國家和地區 - 2025 年至 2032 年全球行業分析、市場規模、市場佔有率和預測
 全球倉庫模擬市場
 倉庫模擬市場規模、佔有率、趨勢分析報告:按類型、產業、發展、地區和細分市場預測,2024-2030