


 |
市場調查報告書
商品編碼
1936627
突波保護器市場機會、成長要素、產業趨勢分析及2026年至2035年預測Surge Protection Devices Market Opportunity, Growth Drivers, Industry Trend Analysis, and Forecast 2026 - 2035 |
||||||
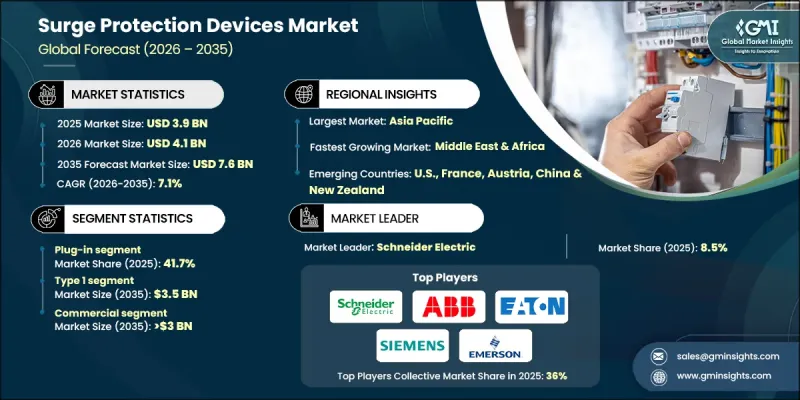
全球突波保護器市場預計到 2025 年將達到 39 億美元,到 2035 年將達到 76 億美元,年複合成長率為 7.1%。
市場擴張的驅動力來自人們對設備可靠性的日益關注、敏感電子設備使用量的增加以及智慧建築技術的日益普及。隨著各組織將營運安全和運作置於優先地位,對電能品質解決方案的需求也隨之飆升。突波保護器旨在保護電力系統免受雷擊、突波和開關操作引起的瞬態過電壓的影響,在現代配電網路中至關重要。電網現代化計畫、可再生能源併網以及不斷擴展的電動車充電基礎設施正在推動市場發展。此外,對超大規模資料中心的投資、嚴格的合規標準以及頻繁發生的極端天氣事件也在促進產業成長。太陽能光電系統、電池儲能裝置以及UL/IEC認證突波保護器市場的普及進一步支撐了全球市場的擴張。
| 市場覆蓋範圍 | |
|---|---|
| 開始年份 | 2025 |
| 預測年份 | 2026-2035 |
| 起始值 | 39億美元 |
| 預測金額 | 76億美元 |
| 複合年成長率 | 7.1% |
到2025年,插電式突波保護器市場佔有率將達到41.7%。其成長主要得益於家用電器的普及和人們對終端用電保護意識的提升。此外,市場對經濟實惠的模組化插電式浪湧保護器的需求,以及將其整合到智慧家庭解決方案、住宅和小規模辦公室的需求,也推動了市場的發展。
預計到2025年,1型突波保護器將佔據47.8%的市場佔有率,到2035年市場規模將達到35億美元。入戶線安裝量的增加、對防雷保護的日益重視以及公用事業規模計劃和公共產業設施的廣泛應用,都推動了這一成長。舊電網基礎設施的現代化改造也進一步刺激了高能量突波保護器的需求。
預計到2025年,美國突波保護器市場將佔據66.8%的市場佔有率,市場規模達5.275億美元。電力系統現代化、智慧電網計劃投資以及住宅和商業建築中敏感電子設備使用量的增加是推動市場成長的主要因素。此外,資料中心和雲端運算產業的持續擴張也進一步推動了突波保護器的應用,以確保系統可靠運作。
目錄
第1章調查方法和範圍
第2章執行摘要
第3章業界考察
- 生態系分析
- 原物料供應及採購分析
- 製造能力評估
- 供應鏈韌性與風險因素
- 配電網路分析
- 監管環境
- 產業影響因素
- 促進要素
- 產業潛在風險與挑戰
- 成長潛力分析
- 波特五力分析
- PESTEL 分析
- 突波保護裝置的成本結構分析
- 價格趨勢分析
- 依產品
- 按地區
- 新的機會與趨勢
- 數位化和物聯網整合
第4章 競爭情勢
- 介紹
- 按地區分類的公司市佔率分析
- 北美洲
- 歐洲
- 亞太地區
- 中東和非洲
- 拉丁美洲
- 戰略儀錶板
- Key partnerships &collaborations
- Major M&A activities
- Product innovations &launches
- Market expansion strategies
- 策略舉措
- 競爭標竿分析
- 創新與科技趨勢
第5章 2022-2035年依產品分類的市場規模及預測
- 硬佈線
- 外掛
- 電源線
- 電源控制設備
第6章 依技術分類的市場規模及預測(2022-2035年)
- 1型
- 類型 2
- 3型
第7章 依功率等級分類的市場規模及預測,2022-2035年
- ≤50 kA
- 超過 50kA 至 100kA
- 超過10萬至15萬
- 超過15萬
第8章 依應用領域分類的市場規模及預測(2022-2035年)
- 住宅
- 商業的
- 工業的
第9章 2022-2035年各地區市場規模及預測
- 北美洲
- 美國
- 加拿大
- 墨西哥
- 歐洲
- 德國
- 法國
- 俄羅斯
- 英國
- 義大利
- 西班牙
- 荷蘭
- 奧地利
- 亞太地區
- 中國
- 日本
- 韓國
- 印度
- 澳洲
- 紐西蘭
- 馬來西亞
- 印尼
- 中東和非洲
- 沙烏地阿拉伯
- 阿拉伯聯合大公國
- 卡達
- 埃及
- 南非
- 奈及利亞
- 拉丁美洲
- 巴西
- 阿根廷
第10章:公司簡介
- ABB
- Belkin
- Bourns
- Eaton
- Emerson Electric
- GE Vernova
- Havells India
- Hubbell
- Infineon Technologies
- JMV
- Legrand
- Leviton Manufacturing
- Littelfuse
- Maxivolt
- Mersen
- Philips
- Phoenix Contact
- Raycap
- Rockwell Automation
- Schneider Electric
- Siemens
The Global Surge Protection Devices Market was valued at USD 3.9 billion in 2025 and is estimated to grow at a CAGR of 7.1% to reach USD 7.6 billion by 2035.
The market expansion is driven by rising concerns over equipment reliability, the increasing use of sensitive electronics, and the growing integration of smart building technologies. Demand for power quality solutions is escalating as organizations prioritize operational safety and uptime. Surge protection devices, designed to safeguard electrical systems from transient overvoltages caused by lightning, power surges, or switching operations, are critical in modern power distribution networks. Grid modernization initiatives, renewable energy integration, and the expansion of electric vehicle charging infrastructure are bolstering the market. Additionally, hyperscale data center investments, stricter compliance standards, and the increasing frequency of extreme weather events are reinforcing industry growth. Adoption of solar PV systems, battery storage installations, and UL/IEC-certified Surge Protection Devices Market further supports market expansion globally.
| Market Scope | |
|---|---|
| Start Year | 2025 |
| Forecast Year | 2026-2035 |
| Start Value | $3.9 Billion |
| Forecast Value | $7.6 Billion |
| CAGR | 7.1% |
The plug-in surge protection device segment held 41.7% share in 2025. Its growth is fueled by the increasing penetration of consumer electronics and rising awareness of point-of-use protection. Residential and small office deployments, coupled with demand for cost-effective and modular plug-in designs integrated into smart home solutions, are driving market adoption.
Type 1 SPDs accounted for 47.8% share in 2025 and are projected to reach USD 3.5 billion by 2035. Increasing installations at service entrances, emphasis on lightning protection, and adoption in utility-scale projects and industrial facilities are supporting growth. Modernization of aging grid infrastructure is further driving the demand for high-energy surge-handling devices.
U.S. Surge Protection Devices Market held a 66.8% share in 2025, generating USD 527.5 million. Growth is driven by grid modernization, smart grid project investments, and the rising use of sensitive electronics in residential and commercial buildings. The expanding data center and cloud computing sectors are fueling further adoption of SPDs to ensure reliable operations.
Leading companies in the Global Surge Protection Devices Market include ABB, Belkin, Bourns, Eaton, Emerson Electric, GE Vernova, Havells India, Hubbell, Infineon Technologies, JMV, Legrand, Leviton Manufacturing, Littelfuse, Maxivolt, Mersen, Philips, Phoenix Contact, Raycap, Rockwell Automation, Schneider Electric, and Siemens. Key strategies adopted by companies in the surge protection devices market include investing in research and development to enhance product reliability, efficiency, and energy compliance. Firms are expanding globally to target emerging markets and forming strategic partnerships with utilities, data center operators, and smart building integrators. Emphasis on modular and plug-in product designs facilitates residential and commercial adoption, while achieving UL and IEC certifications strengthens trust and regulatory compliance. Companies are also focusing on retrofitting aging electrical infrastructure, offering predictive maintenance solutions, and integrating IoT-enabled SPDs to differentiate their portfolio, increase market share, and solidify long-term footholds in the competitive industry.
Table of Contents
Chapter 1 Methodology & Scope
- 1.1 Research approach
- 1.2 Quality commitments
- 1.2.1 GMI AI policy & data integrity commitment
- 1.2.1.1 Source consistency protocol
- 1.2.1 GMI AI policy & data integrity commitment
- 1.3 Research trail & confidence scoring
- 1.3.1 Research trail components
- 1.3.2 Scoring components
- 1.4 Data collection
- 1.4.1 Partial list of primary sources
- 1.5 Data mining sources
- 1.5.1 Paid sources
- 1.5.1.1 Sources, by region
- 1.5.1 Paid sources
- 1.6 Base estimates and calculations
- 1.6.1 Base year calculation for any one approach
- 1.7 Market estimates & forecasts parameters
- 1.8 Forecast model
- 1.8.1 Quantified market impact analysis
- 1.8.1.1 Mathematical impact of growth parameters on forecast
- 1.8.1 Quantified market impact analysis
- 1.9 Research transparency addendum
- 1.9.1 Source attribution framework
- 1.9.2 Quality assurance metrics
- 1.9.3 Our commitment to trust
- 1.10 Market definitions
Chapter 2 Executive Summary
- 2.1 Industry synopsis, 2022 - 2035
- 2.2 Business trends
- 2.3 Product trends
- 2.4 Technology trends
- 2.5 Power rating trends
- 2.6 Application trends
- 2.7 Regional trends
Chapter 3 Industry Insights
- 3.1 Industry ecosystem analysis
- 3.1.1 Raw material availability & sourcing analysis
- 3.1.2 Manufacturing capacity assessment
- 3.1.3 Supply chain resilience & risk factors
- 3.1.4 Distribution network analysis
- 3.2 Regulatory landscape
- 3.3 Industry impact forces
- 3.3.1 Growth drivers
- 3.3.2 Industry pitfalls & challenges
- 3.4 Growth potential analysis
- 3.5 Porter's analysis
- 3.5.1 Bargaining power of suppliers
- 3.5.2 Bargaining power of buyers
- 3.5.3 Threat of new entrants
- 3.5.4 Threat of substitutes
- 3.6 PESTEL analysis
- 3.6.1 Political factors
- 3.6.2 Economic factors
- 3.6.3 Social factors
- 3.6.4 Technological factors
- 3.6.5 Legal factors
- 3.6.6 Environmental factors
- 3.7 Cost structure analysis of surge protection devices
- 3.8 Price trend analysis
- 3.8.1 By product
- 3.8.2 By region
- 3.9 Emerging opportunities & trends
- 3.10 Digitalization and IoT integration
Chapter 4 Competitive Landscape, 2025
- 4.1 Introduction
- 4.2 Company market share analysis, by region, 2025
- 4.2.1 North America
- 4.2.2 Europe
- 4.2.3 Asia Pacific
- 4.2.4 Middle East & Africa
- 4.2.5 Latin America
- 4.3 Strategic dashboard
- 4.3.1 Key partnerships & collaborations
- 4.3.2 Major M&A activities
- 4.3.3 Product innovations & launches
- 4.3.4 Market expansion strategies
- 4.4 Strategic initiatives
- 4.5 Competitive benchmarking
- 4.6 Innovation & technology landscape
Chapter 5 Market Size and Forecast, By Product, 2022 - 2035 (USD Million & Units)
- 5.1 Key trends
- 5.2 Hard-wired
- 5.3 Plug-in
- 5.4 Line cord
- 5.5 Power control devices
Chapter 6 Market Size and Forecast, By Technology, 2022 - 2035 (USD Million & Units)
- 6.1 Key trends
- 6.2 Type 1
- 6.3 Type 2
- 6.4 Type 3
Chapter 7 Market Size and Forecast, By Power Rating, 2022 - 2035 (USD Million & Units)
- 7.1 Key trends
- 7.2 ≤ 50 kA
- 7.3 > 50 KA to 100 KA
- 7.4 > 100 KA to 150 KA
- 7.5 > 150 KA
Chapter 8 Market Size and Forecast, By Application, 2022 - 2035 (USD Million & Units)
- 8.1 Key trends
- 8.2 Residential
- 8.3 Commercial
- 8.4 Industrial
Chapter 9 Market Size and Forecast, By Region, 2022 - 2035 (USD Million & Units)
- 9.1 Key trends
- 9.2 North America
- 9.2.1 U.S.
- 9.2.2 Canada
- 9.2.3 Mexico
- 9.3 Europe
- 9.3.1 Germany
- 9.3.2 France
- 9.3.3 Russia
- 9.3.4 UK
- 9.3.5 Italy
- 9.3.6 Spain
- 9.3.7 Netherlands
- 9.3.8 Austria
- 9.4 Asia Pacific
- 9.4.1 China
- 9.4.2 Japan
- 9.4.3 South Korea
- 9.4.4 India
- 9.4.5 Australia
- 9.4.6 New Zealand
- 9.4.7 Malaysia
- 9.4.8 Indonesia
- 9.5 Middle East & Africa
- 9.5.1 Saudi Arabia
- 9.5.2 UAE
- 9.5.3 Qatar
- 9.5.4 Egypt
- 9.5.5 South Africa
- 9.5.6 Nigeria
- 9.6 Latin America
- 9.6.1 Brazil
- 9.6.2 Argentina
Chapter 10 Company Profiles
- 10.1 ABB
- 10.2 Belkin
- 10.3 Bourns
- 10.4 Eaton
- 10.5 Emerson Electric
- 10.6 GE Vernova
- 10.7 Havells India
- 10.8 Hubbell
- 10.9 Infineon Technologies
- 10.10 JMV
- 10.11 Legrand
- 10.12 Leviton Manufacturing
- 10.13 Littelfuse
- 10.14 Maxivolt
- 10.15 Mersen
- 10.16 Philips
- 10.17 Phoenix Contact
- 10.18 Raycap
- 10.19 Rockwell Automation
- 10.20 Schneider Electric
- 10.21 Siemens
 突波保護設備的全球市場(2025年):終端用戶,用途,競爭企業:分析與預測
 突波保護零組件的全球市場(2025年)- 終端用戶,用途,競爭企業
 快速充電突波保護插座市場:依產品類型、通路、最終用途和應用分類-全球預測,2026-2032年
 突波保護設備市場規模、佔有率、趨勢和預測:按產品、類型、額定功率、最終用戶和地區分類,2026-2034 年
 工業突波保護設備市場:商機、成長要素、產業趨勢分析及2026-2035年預測
 2026年全球突波保護設備市場報告
 突波保護器市場-全球產業規模、佔有率、趨勢、機會與預測:按類型、功率範圍、組件、最終用途、地區和競爭格局分類,2021-2031年臨時防護裝置市場-全球產業規模、佔有率、趨勢、機會、預測:按類型、應用、地區和競爭格局分類,2021-2031年按類型、安裝方式、相位、最終用途和分銷管道突波的浪湧抑制器市場 - 全球預測 2026-2032電池保護裝置市場按保護方式、電池類型、類型、保護類型、應用和分銷管道分類,全球預測(2026-2032)