


 |
市場調查報告書
商品編碼
1936620
汽車共享市場機會、成長要素、產業趨勢分析及2026年至2035年預測Car Sharing Market Opportunity, Growth Drivers, Industry Trend Analysis, and Forecast 2026 - 2035 |
||||||
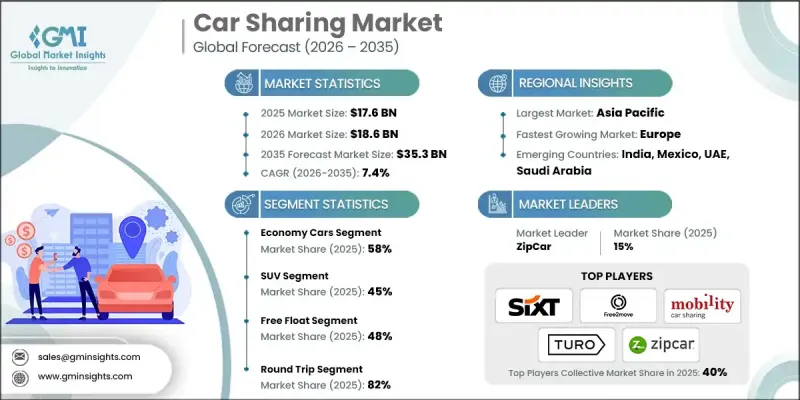
全球汽車共享市場預計到 2025 年將價值 176 億美元,到 2035 年達到 353 億美元,年複合成長率為 7.4%。
快速的都市化加劇了世界各地城市的交通堵塞、停車困難和通勤效率低下等問題,推動了對替代出行解決方案的需求。汽車共享透過提供車輛共用、最佳化利用率和最大限度減少時間浪費來應對這些挑戰。城市管理部門正在支持在道路網路和停車基礎設施有限的人口密集地區推廣共用出行,從而加速其普及。為了保持競爭力,該領域的公司正積極尋求併購、策略聯盟等內部成長策略,並開發創新服務。車輛擁有成本的不斷上漲,包括購車、維修、燃油、保險和停車費用,正在抑制人們擁有私家車的意願。汽車共享將固定的擁有成本轉化為計量型,提供了財務柔軟性。這種模式對都市區上班族、注重成本的家庭以及僅需偶爾用車的年輕消費者極具吸引力。行動應用程式、GPS追蹤、遠端資訊處理和數位支付的整合進一步提升了便利性,實現了無縫預訂、即時車輛追蹤和非接觸式取車,從而改善了整體用戶體驗和營運效率。
| 市場覆蓋範圍 | |
|---|---|
| 開始年份 | 2025 |
| 預測年份 | 2026-2035 |
| 起始值 | 176億美元 |
| 預測金額 | 353億美元 |
| 複合年成長率 | 7.4% |
預計到2025年,經濟型轎車市佔率將達到58%,並在2026年至2035年間以8%的複合年成長率成長。經濟型轎車因其租金低廉、燃油效率高、維護成本低等優點,深受注重預算的居住者的青睞。它們非常適合短途和日常出行,因此預訂量和運轉率都很高。正因如此,經濟型轎車成為全球汽車共享車隊的基礎,並持續在市場成長策略中扮演關鍵角色。
預計到2025年,SUV市佔率將達到45%,並在2026年至2035年間以7%的複合年成長率成長。 SUV在共用車隊中的受歡迎程度主要得益於其寬敞的內部空間、較高的座椅位置和更佳的舒適性。消費者更傾向於選擇SUV進行團體出遊、家庭出遊、需要更大行李空間的旅行。 SUV在多種使用情境下的多功能性推動了其更高的預訂頻率,並促進了其在共用旅遊平台中的應用。這使得SUV成為車隊營運商尋求最大化車輛利用率和收益的關鍵細分市場。
預計到2025年,中國汽車共享市場將佔據38%的市場佔有率,創造25.3億美元的收入。中央和地方政府正積極透過補貼、監管支持和智慧城市建設等政策,推動共用旅遊和電動車的發展。旨在減少私家車保有量、降低排放氣體和加速電氣化的政策,對汽車共享平台的擴張產生了正面影響。優惠牌照、專用停車位和電動車財政補貼等獎勵,刺激了電動車保有量的成長,進一步推動了電動車在全國各大都市地區的普及。
目錄
第1章調查方法和範圍
第2章執行摘要
第3章業界考察
- 生態系分析
- 供應商情況
- 利潤率分析
- 成本結構
- 每個階段的附加價值
- 影響價值鏈的因素
- 中斷
- 產業影響因素
- 促進要素
- 都市區交通壅塞日益嚴重,停車位有限
- 基於應用程式的行動平台的發展
- 汽車擁有成本不斷增加
- 擴大電動車隊
- 產業潛在風險與挑戰
- 高昂的車輛購置和維護成本
- 區域監管複雜性
- 市場機遇
- 與公共交通系統連接
- 企業汽車共享服務
- 電動車和自動駕駛汽車的發展
- 拓展至新興城市市場
- 成長潛力分析
- 監管環境
- 北美洲
- 美國國家公路交通安全管理局(NHTSA)法規
- 美國環保署(EPA)排放標準
- 加州空氣資源委員會 (CARB) 標準
- 歐洲
- 歐盟一般安全法規(EU GSR)
- 歐盟報廢車輛指令(ELV)
- 歐盟委員會乘用車安全標準
- 歐盟型式核准流程
- 亞太地區
- 中國國家車輛安全標準
- 印度標準局(BIS)
- 國土交通省(MLIT)規章
- 東協汽車安全標準
- 拉丁美洲
- 巴西國家交通運輸局(DENATRAN)標準
- 阿根廷國家道路安全局 (ANSV) 法規
- 墨西哥通訊與運輸部部 (SCT) 條例
- 南方共同市場車輛安全標準協調
- 中東和非洲
- 阿拉伯聯合大公國聯邦機動車安全法
- 沙烏地阿拉伯標準組織(SASO)車輛安全法規
- 南非標準局(SABS)機動車輛法規
- 北美洲
- 波特五力分析
- PESTEL 分析
- 科技與創新趨勢
- 當前技術趨勢
- 新興技術
- 價格趨勢
- 按地區
- 依產品
- 生產統計
- 生產基地
- 消費基礎
- 進出口
- 成本細分分析
- 專利分析
- 永續性和環境方面
- 永續實踐
- 減少廢棄物策略
- 生產中的能源效率
- 環保舉措
- 碳足跡考量
第4章 競爭情勢
- 介紹
- 公司市佔率分析
- 北美洲
- 歐洲
- 亞太地區
- 拉丁美洲
- 中東和非洲
- 主要市場公司的競爭分析
- 競爭定位矩陣
- 戰略展望矩陣
- 重大進展
- 併購
- 夥伴關係與合作
- 新產品發布
- 企業擴張計畫和資金籌措
第5章 依車輛類型分類的市場估計與預測,2022-2035年
- 輕型車輛
- 中檔車
- 行政用車
第6章 依車輛類型分類的市場估計與預測,2022-2035年
- 掀背車
- 轎車
- SUV
- 其他
第7章 依商業模式分類的市場估算與預測,2022-2035年
- 往返
- 單程
第8章 按車型分類的市場估計與預測,2022-2035年
- 漂浮
- 固定類型
- P2P
9. 依最終用途分類的市場估計與預測,2022-2035 年
- 個人
- 商業
- 政府機構
- 非營利組織
第10章 2022-2035年各地區市場估計與預測
- 城際
- 城市
第11章 依推進方式分類的市場估計與預測,2022-2035年
- 汽油
- 柴油引擎
- 電池式電動車(BEV)
- PHEV
- HEV
- 其他
第12章 2022-2035年各地區市場估算與預測
- 北美洲
- 美國
- 加拿大
- 歐洲
- 英國
- 德國
- 法國
- 義大利
- 西班牙
- 俄羅斯
- 丹麥
- 亞太地區
- 中國
- 印度
- 日本
- 韓國
- ANZ
- 新加坡
- 拉丁美洲
- 巴西
- 阿根廷
- 墨西哥
- 中東和非洲
- 阿拉伯聯合大公國
- 沙烏地阿拉伯
- 南非
第13章:公司簡介
- 世界玩家
- Communauto
- EKAR FZ
- Enterprise CarShare
- Evo Car Share
- Free2 Move
- Getaround
- GoGet
- Greenwheels
- 本地企業
- BlueSG
- Bolt
- Cambio Mobilitats Service
- Cityhop
- HiyaCar
- HOURCAR
- Mobility Carsharing
- 新興企業
- Modo Carsharing
- Sixt
- Turo
- Zipcar
- Zoomcar
The Global Car Sharing Market was valued at USD 17.6 billion in 2025 and is estimated to grow at a CAGR of 7.4% to reach USD 35.3 billion by 2035.
Rapid urbanization has intensified traffic congestion, parking challenges, and commuting inefficiencies in cities worldwide, creating demand for alternative mobility solutions. Car sharing addresses these issues by offering shared access to vehicles, optimizing utilization, and minimizing wasted time. Urban authorities are supporting the adoption of shared mobility in densely populated areas with limited road networks and parking infrastructure, which accelerates implementation. Companies in this sector are actively pursuing inorganic growth strategies such as mergers, acquisitions, strategic partnerships, and launching innovative services to remain competitive. Rising costs associated with car ownership, including purchase, maintenance, fuel, insurance, and parking, are discouraging individuals from owning personal vehicles. Car sharing allows users to convert fixed ownership costs into usage-based expenses, providing financial flexibility. This model appeals strongly to urban professionals, cost-conscious households, and younger consumers seeking occasional vehicle access. The integration of mobile applications, GPS tracking, telematics, and digital payments has enhanced convenience, enabling seamless booking, real-time vehicle tracking, and contactless access, which improves overall user experience and operational efficiency.
| Market Scope | |
|---|---|
| Start Year | 2025 |
| Forecast Year | 2026-2035 |
| Start Value | $17.6 Billion |
| Forecast Value | $35.3 Billion |
| CAGR | 7.4% |
The economy car segment held 58% share in 2025 and is projected to grow at a CAGR of 8% from 2026 to 2035. Economy vehicles are favored by budget-conscious city dwellers because of their low rental fees, fuel efficiency, and minimal maintenance costs. They are ideal for short-distance trips and everyday travel, which drives frequent bookings and high utilization rates. Consequently, economy cars form the backbone of most car sharing fleets worldwide and remain a critical component of the market's growth strategy.
The SUV segment accounted for 45% share in 2025 and is anticipated to grow at a CAGR of 7% from 2026 to 2035. The popularity of SUVs in shared fleets is driven by their spacious interiors, elevated seating, and enhanced comfort. Users often prefer SUVs for group travel, family outings, and trips requiring extra luggage capacity. Their versatility across different usage scenarios leads to higher booking frequency and increased adoption within shared mobility platforms, making them a vital segment for fleet operators seeking to maximize utilization and revenue.
China Car Sharing Market held 38% share, generating USD 2.53 billion in 2025. Government initiatives at the central and municipal levels are actively promoting shared mobility and electric vehicle adoption by providing subsidies, regulatory support, and smart city initiatives. Policies targeting a reduction in personal vehicle ownership, lower emissions, and accelerated electrification have positively impacted the expansion of car sharing platforms. Incentives such as preferential licensing, dedicated parking, and financial support for electric vehicles have strengthened fleet growth and encouraged greater adoption of EVs in major urban centers across the country.
Prominent companies in the Global Car Sharing Market include Turo, Sixt, Getaround, Zipcar, Cambio Mobilitats Service, Communauto, Free2Move, GoGet, EKAR FZ, and Mobility Carsharing. Leading firms in the Car Sharing Market are pursuing strategic initiatives to solidify their presence and expand their market share. These strategies include forming alliances and partnerships with automotive manufacturers and technology providers, integrating digital platforms for seamless booking and fleet management, and adopting innovative pricing models to attract diverse customer segments. Companies are also expanding their electric vehicle fleets, investing in smart mobility solutions, and exploring mergers and acquisitions to strengthen geographic reach.
Table of Contents
Chapter 1 Methodology & Scope
- 1.1 Research approach
- 1.2 Quality Commitments
- 1.2.1 GMI AI policy & data integrity commitment
- 1.2.1.1 Source consistency protocol
- 1.2.1 GMI AI policy & data integrity commitment
- 1.3 Research Trail & Confidence Scoring
- 1.3.1 Research Trail Components
- 1.3.2 Scoring Components
- 1.4 Data Collection
- 1.4.1 Partial list of primary sources
- 1.5 Data mining sources
- 1.5.1 Paid sources
- 1.5.1.1 Sources, by region
- 1.5.1 Paid sources
- 1.6 Base estimates and calculations
- 1.6.1 Base year calculation for any one approach
- 1.7 Forecast model
- 1.7.1 Quantified market impact analysis
- 1.7.1.1 Mathematical impact of growth parameters on forecast
- 1.7.1 Quantified market impact analysis
- 1.8 Research transparency addendum
- 1.8.1 Source attribution framework
- 1.8.2 Quality assurance metrics
- 1.8.3 Our commitment to trust
Chapter 2 Executive Summary
- 2.1 Industry 360° synopsis, 2022 - 2035
- 2.2 Key market trends
- 2.2.1 Regional
- 2.2.2 Vehicle class
- 2.2.3 Vehicle
- 2.2.4 Business model
- 2.2.5 Model
- 2.2.6 End use
- 2.2.7 Area
- 2.2.8 Propulsion
- 2.3 TAM Analysis, 2026-2035
- 2.4 CXO perspectives: Strategic imperatives
- 2.4.1 Executive decision points
- 2.4.2 Critical success factors
- 2.5 Future outlook and strategic recommendations
Chapter 3 Industry Insights
- 3.1 Industry ecosystem analysis
- 3.1.1 Supplier landscape
- 3.1.2 Profit margin analysis
- 3.1.3 Cost structure
- 3.1.4 Value addition at each stage
- 3.1.5 Factor affecting the value chain
- 3.1.6 Disruptions
- 3.2 Industry impact forces
- 3.2.1.1 Growth drivers
- 3.2.1.2 Rising urban congestion and parking constraints
- 3.2.1.3 Growth of app-based mobility platforms
- 3.2.1.4 Increasing cost of vehicle ownership
- 3.2.1.5 Expansion of electric vehicle fleets
- 3.2.2 Industry pitfalls and challenges
- 3.2.2.1 High fleet acquisition and maintenance costs
- 3.2.2.2 Regulatory complexity across regions
- 3.2.3 Market opportunities
- 3.2.3.1 Integration with public transportation systems
- 3.2.3.2 Corporate and enterprise car sharing
- 3.2.3.3 Growth of electric and autonomous vehicles
- 3.2.3.4 Expansion into emerging urban markets
- 3.3 Growth potential analysis
- 3.4 Regulatory landscape
- 3.4.1 North America
- 3.4.1.1 U.S. National Highway Traffic Safety Administration (NHTSA) Regulations
- 3.4.1.2 Environmental Protection Agency (EPA) Emission Standards
- 3.4.1.3 California Air Resources Board (CARB) Standards
- 3.4.2 Europe
- 3.4.2.1 European Union General Safety Regulation (EU GSR)
- 3.4.2.2 EU Directive on End-of-Life Vehicles (ELV)
- 3.4.2.3 European Commission Safety Standards for Passenger Vehicles
- 3.4.2.4 European Union Type Approval Process
- 3.4.3 Asia Pacific
- 3.4.3.1 China National Standards for Vehicle Safety
- 3.4.3.2 India Bureau of Indian Standards (BIS)
- 3.4.3.3 Japan Ministry of Land, Infrastructure, Transport and Tourism (MLIT) Regulations
- 3.4.3.4 ASEAN Automotive Safety Standards
- 3.4.4 Latin America
- 3.4.4.1 Brazil National Traffic Department (DENATRAN) Standards
- 3.4.4.2 Argentina National Road Safety Agency (ANSV) Regulations
- 3.4.4.3 Mexico Secretariat of Communications and Transport (SCT) Regulations
- 3.4.4.4 MERCOSUR Harmonization of Vehicle Safety Standards
- 3.4.5 Middle East & Africa
- 3.4.5.1 UAE Federal Vehicle Safety Law
- 3.4.5.2 Saudi Arabian Standards Organization (SASO) Vehicle Safety Regulations
- 3.4.5.3 South African Bureau of Standards (SABS) AUTOMOTIVE REGULATIONS
- 3.4.1 North America
- 3.5 Porter's analysis
- 3.6 PESTEL analysis
- 3.7 Technology and innovation landscape
- 3.7.1 Current technological trends
- 3.7.2 Emerging technologies
- 3.8 Price trends
- 3.8.1 By region
- 3.8.2 By product
- 3.9 Production statistics
- 3.9.1 Production hubs
- 3.9.2 Consumption hubs
- 3.9.3 Export and import
- 3.10 Cost breakdown analysis
- 3.11 Patent analysis
- 3.12 Sustainability and environmental aspects
- 3.12.1 Sustainable practices
- 3.12.2 Waste reduction strategies
- 3.12.3 Energy efficiency in production
- 3.12.4 Eco-friendly Initiatives
- 3.12.5 Carbon footprint considerations
Chapter 4 Competitive Landscape, 2025
- 4.1 Introduction
- 4.2 Company market share analysis
- 4.2.1 North America
- 4.2.2 Europe
- 4.2.3 Asia Pacific
- 4.2.4 LATAM
- 4.2.5 MEA
- 4.3 Competitive analysis of major market players
- 4.4 Competitive positioning matrix
- 4.5 Strategic outlook matrix
- 4.6 Key developments
- 4.6.1 Mergers & acquisitions
- 4.6.2 Partnerships & collaborations
- 4.6.3 New Product Launches
- 4.6.4 Expansion Plans and funding
Chapter 5 Market Estimates & Forecast, By Vehicle Class, 2022 - 2035 ($Mn, Fleet Size)
- 5.1 Key trends
- 5.2 Economy cars
- 5.3 Mid-Range cars
- 5.4 Executive cars
Chapter 6 Market Estimates & Forecast, By Vehicle, 2022 - 2035 ($Mn, Fleet Size)
- 6.1 Key trends
- 6.2 Hatchback
- 6.3 Sedan
- 6.4 SUV
- 6.5 Others
Chapter 7 Market Estimates & Forecast, By Business Model, 2022 - 2035 ($Mn, Fleet Size)
- 7.1 Key trends
- 7.2 Round trip
- 7.3 One way
Chapter 8 Market Estimates & Forecast, By Model, 2022 - 2035 ($Mn, Fleet Size)
- 8.1 Key trends
- 8.2 Free float
- 8.3 Stationary
- 8.4 Peer to Peer
Chapter 9 Market Estimates & Forecast, By End Use, 2022 - 2035 ($Mn, Fleet Size)
- 9.1 Key trends
- 9.2 Individual
- 9.3 Business
- 9.4 Government agencies
- 9.5 Non-profit organizations
Chapter 10 Market Estimates & Forecast, By Area, 2022 - 2035 ($Mn, Fleet Size)
- 10.1 Key trends
- 10.2 Intercity
- 10.3 Intracity
Chapter 11 Market Estimates & Forecast, By Propulsion, 2022 - 2035 ($Mn, Fleet Size)
- 11.1 Key trends
- 11.2 Gasoline
- 11.3 Diesel
- 11.4 BEV
- 11.5 PHEV
- 11.6 HEV
- 11.7 Others
Chapter 12 Market Estimates & Forecast, By Region, 2022 - 2035 ($Mn, Fleet Size)
- 12.1 Key trends
- 12.2 North America
- 12.2.1 US
- 12.2.2 Canada
- 12.3 Europe
- 12.3.1 UK
- 12.3.2 Germany
- 12.3.3 France
- 12.3.4 Italy
- 12.3.5 Spain
- 12.3.6 Russia
- 12.3.7 Denmark
- 12.4 Asia Pacific
- 12.4.1 China
- 12.4.2 India
- 12.4.3 Japan
- 12.4.4 South Korea
- 12.4.5 ANZ
- 12.4.6 Singapore
- 12.5 Latin America
- 12.5.1 Brazil
- 12.5.2 Argentina
- 12.5.3 Mexico
- 12.6 MEA
- 12.6.1 UAE
- 12.6.2 Saudi Arabia
- 12.6.3 South Africa
Chapter 13 Company Profiles
- 13.1 Global Players
- 13.1.1 Communauto
- 13.1.2 EKAR FZ
- 13.1.3 Enterprise CarShare
- 13.1.4 Evo Car Share
- 13.1.5. Free2 Move
- 13.1.6 Getaround
- 13.1.7 GoGet
- 13.1.8 Greenwheels
- 13.2 Regional Players
- 13.2.1 BlueSG
- 13.2.2 Bolt
- 13.2.3 Cambio Mobilitats Service
- 13.2.4 Cityhop
- 13.2.5 HiyaCar
- 13.2.6 HOURCAR
- 13.2.7 Mobility Carsharing
- 13.3 Emerging Players
- 13.3.1 Modo Carsharing
- 13.3.2 Sixt
- 13.3.3 Turo
- 13.3.4 Zipcar
- 13.3.5 Zoomcar
 汽車共享市場預測至2034年—全球經營模式、旅遊類型、車輛類型、動力類型、預訂方式、使用時間、應用領域、最終用戶和區域分析P2P汽車共享市場預測至2034年-按車輛類型、平台類型、供應商合作夥伴、最終用戶和地區分類的全球分析
 汽車共享市場規模、佔有率、趨勢和預測:按車輛類型、經營模式、應用和地區分類,2026-2034年
 2026年全球B2C旅遊共享市場報告2026年全球共享汽車市場報告
 汽車共享市場:2026-2032年全球市場預測(依服務模式、車輛類型、使用模式、定價模式、支付模式及使用者類型分類)
 共享汽車市場:按服務模式、車輛類型和地區分類
 全球汽車共享市場規模、佔有率、趨勢和成長分析報告(2026-2034年)全球汽車共享遠端資訊處理市場規模、佔有率、趨勢和成長分析報告(2026-2034年)P2P汽車租賃平台市場:全球預測(2026-2032 年),按車輛類型、租賃期間、用戶年齡層、預訂管道和保險選項分類