


 |
市場調查報告書
商品編碼
1936617
永續製造設備市場機會、成長要素、產業趨勢分析及預測(2026年至2035年)Sustainable Manufacturing Equipment Market Opportunity, Growth Drivers, Industry Trend Analysis, and Forecast 2026 - 2035 |
||||||
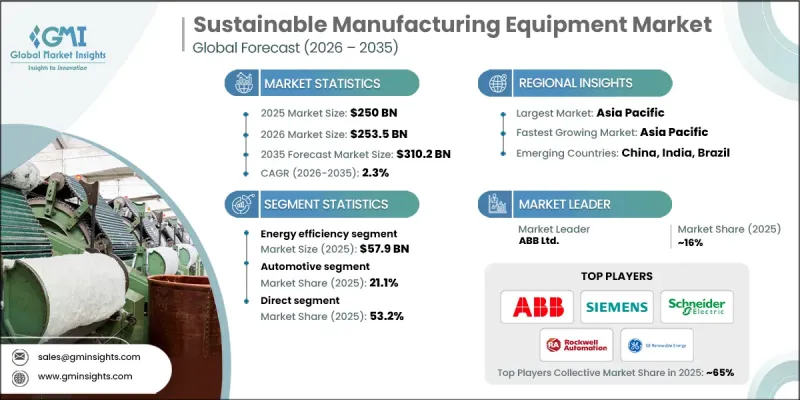
全球永續製造設備市場預計到 2025 年將達到 2,500 億美元,到 2035 年將達到 3,102 億美元,年複合成長率為 2.3%。
循環經濟原則在各工業領域的應用正在影響市場成長。製造商日益注重提高資源利用效率、減少材料廢棄物並延長產品生命週期,這直接增加了對支援這些目標的先進設備的需求。永續製造使企業能夠透過基於再利用和回收的生產模式,在提高成本效益的同時降低對原料的依賴。這種轉變不僅受環境因素驅動,也受到經濟誘因的推動,因為企業尋求從再生材料流中獲得長期收益和新的商機。同時,世界各地的公共部門法規正在加速綠色製造實踐的採用。各國政府透過支持性政策框架和金融機制鼓勵這項轉型,進而減輕綠色技術相關的投資負擔。這些措施正促使製造商對其生產基礎設施進行現代化改造,並將永續性作為核心營運目標。隨著環境合規性、效率和盈利之間的關聯日益密切,永續製造作為一項策略性投資,在全球各行業中持續獲得關注。
| 市場覆蓋範圍 | |
|---|---|
| 開始年份 | 2025 |
| 預測年份 | 2026-2035 |
| 起始值 | 2500億美元 |
| 預測金額 | 3102億美元 |
| 複合年成長率 | 2.3% |
預計到2025年,能源效率領域的市場規模將達到5,79億美元,並在2026年至2035年間以1.2%的複合年成長率成長。節能設備因其在多個行業的適用性、即時節省營運成本以及符合排放目標而保持較高的普及率。各公司正積極升級其機械設備,以降低能耗和營運成本,同時提升整體性能。
截至2024年,直銷通路佔了53.2%的市佔率。直銷模式使設備製造商能夠繞過仲介業者,直接與終端用戶交易,從而更清晰地傳達永續性優勢,例如減少排放、提高效率和可回收性,同時加強與客戶的長期關係。
美國永續製造設備市場預計到2025年將達到4,48億美元,到2035年將以1.6%的複合年成長率成長。強大的工業基礎、先進的創新能力以及促進綠色生產的政策舉措支撐了這一市場主導地位。美國製造商積極採用者永續設備,以使其營運符合監管要求和企業永續性目標。
目錄
第1章調查方法和範圍
第2章執行摘要
第3章業界考察
- 生態系分析
- 供應商情況
- 利潤率
- 每個階段的附加價值
- 影響價值鏈的因素
- 產業影響因素
- 促進要素
- 企業為實現淨零排放所做的努力
- 採納循環經濟原則
- 政府法規和激勵措施
- 挑戰與困難
- 高昂的初始投資成本
- 監理合規的複雜性
- 機會
- 節能低排放設備的需求日益成長
- 整合循環經濟原則
- 促進要素
- 成長潛力分析
- 未來市場趨勢
- 科技與創新趨勢
- 當前技術趨勢
- 新興技術
- 價格趨勢
- 按地區
- 依產品
- 監管環境
- 北美洲
- 美國:消費品安全委員會 (CPSC) 聯邦法規第 16 篇 (CFR) 第 1512 部分
- 加拿大:國際標準化組織(ISO)4210
- 歐洲
- 德國:德國標準化協會 (DIN) 歐洲標準 (EN) ISO 4210
- 英國:歐洲標準 (EN) ISO 4210/英國合格評定 (UKCA)
- 法國:歐洲標準 (EN) ISO 4210
- 亞太地區
- 中國:國家標誌(GB)3565
- 印度:印度標準 (IS) 10613
- 日本:日本工業標準(JIS)D 9110
- 拉丁美洲
- 巴西:巴西技術標準協會 (ABNT) 巴西標準 (NBR) ISO 4210
- 墨西哥:國際標準化組織(ISO)4210
- 中東和非洲
- 南非:南非國家標準 (SANS) 311
- 沙烏地阿拉伯:沙烏地阿拉伯標準、計量和品質組織 (SASO) 海灣標準組織 (GSO) ISO 4210
- 北美洲
- 貿易統計
- 主要進口國
- 主要出口國
- 波特五力分析
- PESTEL 分析
第4章 競爭情勢
- 介紹
- 公司市佔率分析
- 按地區
- 北美洲
- 歐洲
- 亞太地區
- 拉丁美洲
- 中東和非洲
- 按地區
- 企業矩陣分析
- 主要市場公司的競爭分析
- 競爭定位矩陣
- 重大進展
- 併購
- 夥伴關係與合作
- 新產品發布
- 擴張計劃
第5章 依設備類型分類的市場估算與預測,2022-2035年
- 節能機器
- 廢棄物管理設施
- 水和污水處理設施
- 碳排放控制系統
- 可再生能源綜合設施
- 智慧製造和監控設備
- 永續包裝設備
- 積層製造設備
- 其他(材料回收系統等)
第6章 依最終用戶產業分類的市場估算與預測,2022-2035年
- 車
- 電子和半導體
- 食品/飲料
- 化學製造業
- 製藥
- 金屬和採礦
- 消費品
- 其他(紡織製造業等)
7. 依最終用途分類的市場估計與預測,2022-2035 年
- 主要企業
- 中小企業
- 政府和研究機構
- 永續製造Start-Ups
第8章 按分銷管道分類的市場估算與預測,2022-2035年
- 直銷
- 間接
第9章 2022-2035年各地區市場估算與預測
- 北美洲
- 美國
- 加拿大
- 歐洲
- 德國
- 英國
- 法國
- 義大利
- 西班牙
- 亞太地區
- 中國
- 印度
- 日本
- 韓國
- 澳洲
- 拉丁美洲
- 巴西
- 墨西哥
- 阿根廷
- 中東和非洲
- 沙烏地阿拉伯
- 阿拉伯聯合大公國
- 南非
第10章:公司簡介
- 3D Systems Corporation
- ABB Ltd.
- Atlas Copco AB
- Bosch Rexroth AG
- Emerson Electric Co.
- FANUC Corporation
- General Electric(GE)Company
- Honeywell International Inc.
- Mitsubishi Electric Corporation
- Rockwell Automation, Inc.
- Schneider Electric SE
- Siemens AG
- Tetra Pak International SA
- Veolia Environment SA
- Yaskawa Electric Corporation
The Global Sustainable Manufacturing Equipment Market was valued at USD 250 billion in 2025 and is estimated to grow at a CAGR of 2.3% to reach USD 310.2 billion by 2035.
The rising adoption of circular economy principles across industrial sectors influences market growth. Manufacturers are increasingly focused on improving resource efficiency, reducing material waste, and extending product life cycles, which directly increases demand for advanced equipment designed to support these goals. Sustainable manufacturing equipment enables companies to lower raw material dependency while improving cost efficiency through reuse and recycling-driven production models. This shift is not only environmentally driven but also financially motivated, as organizations seek long-term savings and new revenue opportunities from secondary material streams. At the same time, public-sector regulations worldwide are accelerating the adoption of environmentally responsible manufacturing practices. Governments are encouraging the transition through supportive policy frameworks and financial mechanisms that ease the investment burden associated with greener technologies. These measures are pushing manufacturers to modernize production infrastructure and prioritize sustainability as a core operational objective. As environmental compliance, efficiency, and profitability become increasingly interconnected, sustainable manufacturing equipment continues to gain traction as a strategic investment across global industries.
| Market Scope | |
|---|---|
| Start Year | 2025 |
| Forecast Year | 2026-2035 |
| Start Value | $250 Billion |
| Forecast Value | $310.2 Billion |
| CAGR | 2.3% |
The energy efficiency segment generated USD 57.9 billion in 2025 and is expected to grow at a CAGR of 1.2% from 2026 to 2035. Energy-efficient equipment maintains strong adoption due to its applicability across multiple industries, immediate operational savings, and alignment with emissions reduction targets. Companies are actively upgrading machinery to reduce energy consumption and operating expenses while improving overall performance.
The direct segment held 53.2% share in 2024. Direct sales models allow equipment manufacturers to engage end users without intermediaries, enabling clearer communication of sustainability benefits such as lower emissions, improved efficiency, and recyclability while strengthening long-term customer relationships.
U.S. Sustainable Manufacturing Equipment Market reached USD 44.8 billion in 2025 and is projected to grow at a CAGR of 1.6% through 2035. Market leadership is supported by a strong industrial foundation, advanced innovation capabilities, and policy-driven encouragement of environmentally responsible production. U.S.-based manufacturers are early adopters of sustainable equipment as they align operations with regulatory expectations and corporate sustainability objectives.
Major companies operating in the Global Sustainable Manufacturing Equipment Market include Siemens AG, Schneider Electric SE, ABB Ltd., Rockwell Automation, Inc., Mitsubishi Electric Corporation, Honeywell International Inc., Emerson Electric Co., Atlas Copco AB, FANUC Corporation, Bosch Rexroth AG, Yaskawa Electric Corporation, General Electric Company, Tetra Pak International S.A., Veolia Environment S.A., and 3D Systems Corporation. Companies in the Sustainable Manufacturing Equipment Market are reinforcing their competitive position through continuous technology innovation and sustainability-focused product development. Many players are investing in automation, digital monitoring, and energy-optimized system designs to improve efficiency and reduce lifecycle costs. Strategic partnerships with industrial clients help tailor equipment to sector-specific sustainability goals. Firms are expanding global manufacturing and service networks to support faster deployment and localized compliance requirements.
Table of Contents
Chapter 1 Methodology & Scope
- 1.1 Market scope & definitions
- 1.2 Research design
- 1.2.1 Research approach
- 1.2.2 Data collection methods
- 1.3 Base estimates and calculations
- 1.3.1 Base year calculation
- 1.3.2 Market estimates & forecasts parameters
- 1.4 Forecast Model
- 1.4.1 Key trends for market estimates
- 1.4.2 Quantified market impact analysis
- 1.4.2.1 Mathematical impact of growth parameters on forecast
- 1.4.3 Scenario analysis framework
- 1.5 Primary research and validation
- 1.5.1 Some of the primary sources (but not limited to)
- 1.6 Data mining sources
- 1.6.1 Paid Sources
- 1.7 Primary research and validation
- 1.7.1 Primary sources
- 1.8 Research Trail & confidence scoring
- 1.8.1 Research trail components
- 1.8.2 Scoring components
- 1.9 Research transparency addendum
- 1.9.1 Source attribution framework
- 1.9.2 Quality assurance metrics
- 1.9.3 Our commitment to trust
- 1.10 Market Definitions
Chapter 2 Executive Summary
- 2.1 Industry 360° synopsis
- 2.2 Key market trends
- 2.2.1 Regional
- 2.2.2 Product Type
- 2.2.3 Automation
- 2.2.4 Application
- 2.2.5 Distribution channel
- 2.3 CXO perspectives: Strategic imperatives
- 2.3.1 Key decision points for industry executives
- 2.3.2 Critical success factors for market players
- 2.4 Future outlook and strategic recommendations
Chapter 3 Industry Insights
- 3.1 Industry ecosystem analysis
- 3.1.1 Supplier landscape
- 3.1.2 Profit margin
- 3.1.3 Value addition at each stage
- 3.1.4 Factor affecting the value chain
- 3.2 Industry impact forces
- 3.2.1 Growth drivers
- 3.2.1.1 Corporate commitments to net-zero emissions
- 3.2.1.2 Adoption of circular economy principles
- 3.2.1.3 Government regulations and incentives
- 3.2.2 Pitfalls & Challenges
- 3.2.2.1 High initial investment costs
- 3.2.2.2 Complexity of regulatory compliance
- 3.2.3 Opportunities
- 3.2.3.1 Growing demand for energy-efficient and low-emission equipment
- 3.2.3.2 Integration of circular economy principles
- 3.2.1 Growth drivers
- 3.3 Growth potential analysis
- 3.4 Future market trends
- 3.5 Technology and innovation landscape
- 3.5.1 Current technological trends
- 3.5.2 Emerging technologies
- 3.6 Price trends
- 3.6.1 By region
- 3.6.2 By product
- 3.7 Regulatory landscape
- 3.7.1 North America
- 3.7.1.1 US: Consumer Product Safety Commission (CPSC) 16 Code of Federal Regulations (CFR) part 1512
- 3.7.1.2 Canada: International Organization for Standardization (ISO) 4210
- 3.7.2 Europe
- 3.7.2.1 Germany: Deutsches Institut fur Normung (DIN) European Norm (EN) ISO 4210
- 3.7.2.2 UK: European Norm (EN) ISO 4210 / United Kingdom Conformity Assessed (UKCA)
- 3.7.2.3 France: European Norm (EN) ISO 4210
- 3.7.3 Asia Pacific
- 3.7.3.1 China: Guobiao (GB) 3565
- 3.7.3.2 India: Indian Standard (IS) 10613
- 3.7.3.3 Japan: Japanese Industrial Standard (JIS) D 9110
- 3.7.4 Latin America
- 3.7.4.1 Brazil: Associacao Brasileira de Normas Tecnicas (ABNT) Norma Brasileira (NBR) ISO 4210
- 3.7.4.2 Mexico: International Organization for Standardization (ISO) 4210
- 3.7.5 Middle East & Africa
- 3.7.5.1 South Africa: South African National Standard (SANS) 311
- 3.7.5.2 Saudi Arabia: Saudi Standards, Metrology and Quality Organization (SASO) Gulf Standardization Organization (GSO) ISO 4210
- 3.7.1 North America
- 3.8 Trade statistics
- 3.8.1 Major importing countries
- 3.8.2 Major exporting countries
- 3.9 Porter's analysis
- 3.10 PESTEL analysis
Chapter 4 Competitive Landscape, 2025
- 4.1 Introduction
- 4.2 Company market share analysis
- 4.2.1 By Region
- 4.2.1.1 North America
- 4.2.1.2 Europe
- 4.2.1.3 Asia Pacific
- 4.2.1.4 Latin America
- 4.2.1.5 Middle East & Africa
- 4.2.1 By Region
- 4.3 Company matrix analysis
- 4.4 Competitive analysis of major market players
- 4.5 Competitive positioning matrix
- 4.6 Key developments
- 4.6.1 Mergers & acquisitions
- 4.6.2 Partnerships & collaborations
- 4.6.3 New product launches
- 4.6.4 Expansion plans
Chapter 5 Market Estimates & Forecast, By Equipment Type, 2022 - 2035, (USD Billion) (Thousand Units)
- 5.1 Key trends
- 5.2 Energy-efficient machinery
- 5.3 Waste management equipment
- 5.4 Water & wastewater treatment equipment
- 5.5 Carbon emission control systems
- 5.6 Renewable energy integration equipment
- 5.7 Smart manufacturing & monitoring equipment
- 5.8 Sustainable packaging equipment
- 5.9 Additive manufacturing equipment
- 5.10 Others (material recovery systems, etc.)
Chapter 6 Market Estimates & Forecast, By End User Industry, 2022 - 2035, (USD Billion) (Thousand Units)
- 6.1 Key trends
- 6.2 Automotive
- 6.3 Electronics and semiconductors
- 6.4 Food and beverages
- 6.5 Chemical manufacturing
- 6.6 Pharmaceuticals
- 6.7 Metals and mining
- 6.8 Consumer goods
- 6.9 Others (textile manufacturing, etc.)
Chapter 7 Market Estimates & Forecast, By End Use, 2022 - 2035, (USD Billion) (Thousand Units)
- 7.1 Key trends
- 7.2 Large enterprises
- 7.3 Small & medium enterprises (SMEs)
- 7.4 Government & research institutes
- 7.5 Sustainable manufacturing startups
Chapter 8 Market Estimates & Forecast, By Distribution Channel, 2022 - 2035, (USD Billion) (Thousand Units)
- 8.1 Key trends
- 8.2 Direct
- 8.3 Indirect
Chapter 9 Market Estimates & Forecast, By Region, 2022 - 2035, (USD Billion) (Thousand Units)
- 9.1 Key trends
- 9.2 North America
- 9.2.1 U.S.
- 9.2.2 Canada
- 9.3 Europe
- 9.3.1 Germany
- 9.3.2 UK
- 9.3.3 France
- 9.3.4 Italy
- 9.3.5 Spain
- 9.4 Asia Pacific
- 9.4.1 China
- 9.4.2 India
- 9.4.3 Japan
- 9.4.4 South Korea
- 9.4.5 Australia
- 9.5 Latin America
- 9.5.1 Brazil
- 9.5.2 Mexico
- 9.5.3 Argentina
- 9.6 MEA
- 9.6.1 Saudi Arabia
- 9.6.2 UAE
- 9.6.3 South Africa
Chapter 10 Company Profiles
- 10.1 3D Systems Corporation
- 10.2 ABB Ltd.
- 10.3 Atlas Copco AB
- 10.4 Bosch Rexroth AG
- 10.5 Emerson Electric Co.
- 10.6 FANUC Corporation
- 10.7 General Electric (GE) Company
- 10.8 Honeywell International Inc.
- 10.9 Mitsubishi Electric Corporation
- 10.10 Rockwell Automation, Inc.
- 10.11 Schneider Electric SE
- 10.12 Siemens AG
- 10.13 Tetra Pak International S.A.
- 10.14 Veolia Environment S.A.
- 10.15 Yaskawa Electric Corporation
 製造業客戶體驗成長機會:2025-2026 年
 光伏電池雷射加工設備市場規模、佔有率和成長分析:按雷射技術、機器配置、晶圓類型、應用、自動化程度、最終用戶產業和地區分類-2026-2033年產業預測
 製造業調查回顧:2025 年
 全球製造業市場:按產業、技術和地區分類
 金屬精密車削產品製造:市場佔有率分析、產業趨勢與統計、成長預測(2026-2031)
 混凝土管材和砌塊製造市場:2026-2032年全球市場預測(按產品類型、應用、最終用戶、製造流程和尺寸分類)
 製造業資訊通訊技術市場-全球產業規模、佔有率、趨勢、機會和預測:按組件、應用、部署類型、地區和競爭對手分類,2021-2031年
 「工業製造業預測」市場數據概況(2025 年第四季)工業與製造業市場預測工業與製造業調查:機器人技術(2024財年下半年/2025財年上半年)