

 |
市場調查報告書
商品編碼
1936597
電子貨架標籤市場機會、成長要素、產業趨勢分析及2026年至2035年預測Electronic Shelf Label Market Opportunity, Growth Drivers, Industry Trend Analysis, and Forecast 2026 - 2035 |
||||||
全球電子貨架標籤市場預計到 2025 年將達到 22 億美元,到 2035 年將達到 74 億美元,年複合成長率為 12.7%。
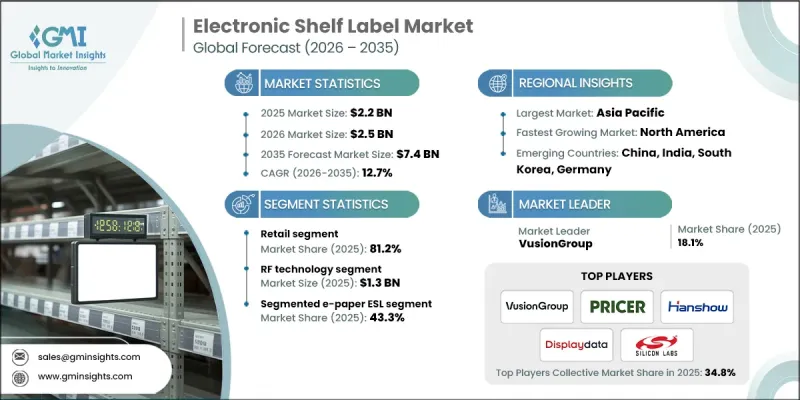
市場成長的關鍵促進因素包括零售自動化需求的不斷成長、受電商競爭推動的動態定價策略的日益普及,以及消費者對精準透明定價的期望不斷提高。物聯網賦能的電子定價系統(ESL)使零售商能夠將定價與門市營運、庫存管理系統和供應鏈無縫整合,提供即時更新、自動提醒並提升營運視覺。零售商正擴大將ESL與分析平台整合,以最佳化其定價策略。基於人工智慧的解決方案透過分析銷售速度、消費行為模式和需求趨勢來提高定價準確性,從而幫助零售商做出明智的決策,並在多個管道中實現盈利最大化。
| 市場覆蓋範圍 | |
|---|---|
| 開始年份 | 2025 |
| 預測年份 | 2026-2035 |
| 起始值 | 22億美元 |
| 預測金額 | 74億美元 |
| 複合年成長率 | 12.7% |
受零售商對卓越視覺化功能的需求驅動,全圖形電子紙廣告看板市場預計到2035年將以16.5%的複合年成長率成長。與傳統廣告看板不同,全圖形電子紙顯示器支援圖像、版面、字體以及除簡單價格顯示之外的豐富內容。零售商可以展示產品圖片、營養資訊、過敏原警告、詳細資訊圖片、QR碼等,進而提升購物體驗和客戶參與。這使得全圖形電子紙廣告看板在超級市場、專賣店和高階零售環境中特別具有吸引力,因為在這些場所,視覺商品行銷和品牌訊息至關重要。
由於其技術優勢,射頻技術領域預計2025年市場規模將達13億美元。射頻訊號覆蓋範圍廣,支援集中式基地台的部署,即使在複雜的零售環境中也能確保穩定運作。射頻技術因其即使在金屬貨架、庫存或繁忙客流等干擾下也能保持可靠運行,而備受大型零售企業的青睞。其穩健性和適應性使其在電子標籤(ESL)應用市場,尤其是在高客流量零售連鎖店和大賣場中,鞏固了主導地位。
預計到2025年,北美電子貨架標籤市佔率將達到31%。該地區的成長主要得益於零售自動化、動態定價解決方案以及提升消費者互動體驗的強勁需求。零售商正在超級市場、大賣場和專賣店等場所推廣電子貨架標籤系統,以降低人事費用、提高定價準確性並簡化庫存管理。政府和私人企業正在投資物聯網連接、雲端管理的電子貨架標籤平台,這些平台能夠實現即時價格更新、確保跨門市價格一致性並利用數據驅動的洞察。美國仍然是核心市場,憑藉其先進的零售技術基礎設施和鼓勵數位化定價系統的法規環境,保持較高的採用率。
目錄
第1章調查方法和範圍
第2章執行摘要
第3章業界考察
- 生態系分析
- 供應商情況
- 利潤率
- 成本結構
- 每個階段的附加價值
- 影響價值鏈的因素
- 中斷
- 產業影響因素
- 促進要素
- 隨著零售自動化技術的進步,即時價格更新的速度正在加快。
- 電子商務領域的競爭正在推動動態定價的普及。
- 增強 ESL 系統與物聯網連接的整合
- 節能型顯示器可顯著降低營運成本。
- 消費者對準確定價的偏好推動了產品的採用。
- 產業潛在風險與挑戰
- 高昂的初始成本限制了其廣泛應用。
- 與現有商店系統整合方面存在問題
- 市場機遇
- 人工智慧定價助力零售業實現智慧決策
- 新興市場為英語作為第二語言教學法的快速普及提供了潛力。
- 促進要素
- 成長潛力分析
- 監管環境
- 北美洲
- 歐洲
- 亞太地區
- 拉丁美洲
- 中東和非洲
- 波特五力分析
- PESTEL 分析
- 科技與創新趨勢
- 當前技術趨勢
- 新興技術
- 價格趨勢
- 按地區
- 依產品
- 定價策略
- 新興經營模式
- 合規要求
- 專利和智慧財產權分析
- 地緣政治和貿易趨勢
第4章 競爭情勢
- 介紹
- 公司市佔率分析
- 按地區
- 北美洲
- 歐洲
- 亞太地區
- 拉丁美洲
- 中東和非洲
- 市場集中度分析
- 按地區
- 主要企業的競爭標竿分析
- 財務績效比較
- 收入
- 利潤率
- 研究與開發
- 產品系列比較
- 產品線的廣度
- 科技
- 創新
- 地理分佈比較
- 全球擴張分析
- 服務網路覆蓋
- 按地區分類的市場滲透率
- 競爭定位矩陣
- 領導企業
- 受讓人
- 追蹤者
- 小眾玩家
- 戰略展望矩陣
- 財務績效比較
- 重大進展
- 併購
- 夥伴關係與合作
- 技術進步
- 擴張與投資策略
- 數位轉型計劃
- 新興/Start-Ups競賽的趨勢
第5章 依產品類型分類的市場估算與預測,2022-2035年
- LCD ESL
- 段式電子紙顯示設備
- 全圖形電子紙電子貨架標籤
第6章 依顯示器尺寸分類的市場估算與預測,2022-2035年
- 小號(≤2吋)
- 中等大小(2-5吋)
- 大號(超過 5 英吋)
第7章 按技術分類的市場估計與預測,2022-2035年
- 射頻(RF)
- 紅外線 (IR)
- 近距離場通訊(NFC)
- Bluetooth
- 其他
第8章 按應用領域分類的市場估算與預測,2022-2035年
- 零售
- 超級市場/大賣場
- 便利商店/零售連鎖店
- 電子產品量販店
- 藥局
- 其他
- 工業的
- 工業設施
- 倉庫
- 配銷中心
- 其他
- 其他
第9章 2022-2035年各地區市場估算與預測
- 北美洲
- 美國
- 加拿大
- 歐洲
- 德國
- 英國
- 法國
- 西班牙
- 義大利
- 亞太地區
- 中國
- 印度
- 日本
- 澳洲
- 韓國
- 拉丁美洲
- 巴西
- 墨西哥
- 阿根廷
- 中東和非洲
- 南非
- 沙烏地阿拉伯
- 阿拉伯聯合大公國
第10章:公司簡介
- 主要企業
- Delfi Technologies A/S
- Panasonic Connect Co., Ltd.
- Pricer
- Silicon Laboratories
- 按地區分類的主要企業
- 北美洲
- ComQi
- Infotek Software &Systems(P)Ltd.
- VusionGroup
- 亞太地區
- Hangzhou Zkong Networks Co., Ltd.
- Shanghai SUNMI Technology Co., Ltd.
- SOLUM
- Minewtag
- 歐洲
- Displaydata Ltd
- Hanshow Technology
- Teraoka(Pty)Ltd
- 北美洲
- 小眾玩家/顛覆者
- M2COMM
- Opticon
- Sen Security Solutions
- Ynvisible Interactive Inc.
The Global Electronic Shelf Label Market was valued at USD 2.2 billion in 2025 and is estimated to grow at a CAGR of 12.7% to reach USD 7.4 billion by 2035.
Market expansion is driven by the growing demand for retail automation, the rising adoption of dynamic pricing strategies fueled by e-commerce competition, and consumers' increasing expectations for accurate, transparent pricing. IoT-enabled ESLs allow retailers to seamlessly integrate pricing with store operations, inventory systems, and supply chains, enabling real-time updates, automated alerts, and improved operational visibility. Retailers are increasingly combining ESLs with analytics platforms to enhance pricing strategies. AI-based solutions improve price accuracy by analyzing sales velocity, consumer behavior patterns, and demand trends, empowering retailers to make informed decisions and optimize profitability across multiple channels.
| Market Scope | |
|---|---|
| Start Year | 2025 |
| Forecast Year | 2026-2035 |
| Start Value | $2.2 Billion |
| Forecast Value | $7.4 Billion |
| CAGR | 12.7% |
The full-graphic e-paper ESL segment is forecasted to grow at a CAGR of 16.5% through 2035, driven by retailers' desire for superior visualization capabilities. Unlike conventional ESLs, full-graphic e-paper displays support images, layouts, fonts, and rich content beyond simple price tags. Retailers can now showcase product images, nutritional information, allergen warnings, promotional graphics, and QR codes for additional details, enhancing the overall shopping experience and customer engagement. This feature makes full-graphic ESLs particularly appealing for supermarkets, specialty stores, and high-end retail environments, where visual merchandising and brand messaging are critical.
The RF technology segment reached USD 1.3 billion in 2025, due to its technical advantages. RF signals provide extensive coverage and allow the deployment of centralized base stations, ensuring consistent operation even in challenging retail environments. RF technology performs reliably despite interference from metal shelving, inventory, or heavy customer traffic, making it the preferred choice for large-scale retail operations. Its robustness and adaptability have reinforced its market leadership in ESL applications, particularly in high-volume retail chains and hypermarkets.
North America Electronic Shelf Label Market held 31% share in 2025. Growth in this region is fueled by strong demand for retail automation, dynamic pricing solutions, and improved consumer engagement. Retailers are increasingly deploying ESL systems to reduce labor costs, enhance pricing accuracy, and simplify inventory management across supermarkets, hypermarkets, and specialty outlets. Governments and private enterprises are investing in IoT-connected, cloud-managed ESL platforms to enable real-time price updates, ensure consistent pricing across multiple locations, and leverage data-driven insights. The U.S. remains the core market, with high adoption rates driven by advanced retail technology infrastructure and regulatory encouragement of digital pricing systems.
Key players active in the Global Electronic Shelf Label Market include Delfi Technologies A/S, Displaydata Ltd, Hangzhou Zkong Networks Co., Ltd., Hanshow Technology, Infotek Software & Systems (P) Ltd., M2COMM, Minewtag, Opticon, Panasonic Connect Co., Ltd., Pricer, Sen Security Solutions, Shanghai SUNMI Technology Co., Ltd., Silicon Laboratories, SOLUM, Teraoka (Pty) Ltd, VusionGroup, Ynvisible Interactive Inc., and ComQi. Companies in the Electronic Shelf Label Market are implementing a combination of strategic approaches to strengthen their market presence and expand their foothold. These include investing heavily in R&D to improve display technology, battery life, and IoT connectivity, as well as developing AI-integrated software for dynamic pricing and real-time analytics. Firms are forging strategic partnerships with retail chains, distributors, and technology providers to broaden distribution and integration capabilities. Expanding into emerging markets and customizing products for local regulatory and consumer requirements allows companies to capture untapped growth opportunities.
Table of Contents
Chapter 1 Methodology and Scope
- 1.1 Market scope and definition
- 1.2 Research design
- 1.2.1 Research approach
- 1.2.2 Data collection methods
- 1.3 Data mining sources
- 1.3.1 Global
- 1.3.2 Regional/Country
- 1.4 Base estimates and calculations
- 1.4.1 Base year calculation
- 1.4.2 Key trends for market estimation
- 1.5 Primary research and validation
- 1.5.1 Primary sources
- 1.6 Forecast model
- 1.7 Research assumptions and limitations
Chapter 2 Executive Summary
- 2.1 Industry 3600 synopsis, 2022 - 2035
- 2.2 Key market trends
- 2.2.1 Product type trends
- 2.2.2 Display size trends
- 2.2.3 Technology trends
- 2.2.4 Application trends
- 2.2.5 Regional trends
- 2.3 TAM Analysis, 2026-2035
- 2.4 CXO perspectives: Strategic imperatives
- 2.4.1 Executive decision points
- 2.4.2 critical success factors
- 2.5 Future outlook and strategic recommendations
Chapter 3 Industry Insights
- 3.1 Industry ecosystem analysis
- 3.1.1 Supplier Landscape
- 3.1.2 Profit Margin
- 3.1.3 Cost structure
- 3.1.4 Value addition at each stage
- 3.1.5 Factor affecting the value chain
- 3.1.6 Disruptions
- 3.2 Industry impact forces
- 3.2.1 Growth drivers
- 3.2.1.1 Rising retail automation increases real-time pricing updates
- 3.2.1.2 E-commerce competition drives dynamic pricing adoption
- 3.2.1.3 IoT connectivity enhances ESL system integration
- 3.2.1.4 Energy-efficient displays reduce operational costs significantly
- 3.2.1.5 Consumer preference for accurate pricing encourages adoption
- 3.2.2 Industry pitfalls and challenges
- 3.2.2.1 High initial deployment costs limit adoption
- 3.2.2.2 Integration issues with legacy store systems
- 3.2.3 Market opportunities
- 3.2.3.1 AI-driven pricing enables intelligent retail decision-making
- 3.2.3.2 Emerging markets offer rapid ESL adoption potential
- 3.2.1 Growth drivers
- 3.3 Growth potential analysis
- 3.4 Regulatory landscape
- 3.4.1 North America
- 3.4.2 Europe
- 3.4.3 Asia Pacific
- 3.4.4 Latin America
- 3.4.5 Middle East & Africa
- 3.5 Porter's analysis
- 3.6 PESTEL analysis
- 3.7 Technology and Innovation landscape
- 3.7.1 Current technological trends
- 3.7.2 Emerging technologies
- 3.8 Price trends
- 3.8.1 By region
- 3.8.2 By product
- 3.9 Pricing Strategies
- 3.10 Emerging Business Models
- 3.11 Compliance Requirements
- 3.12 Patent and IP analysis
- 3.13 Geopolitical and trade dynamics
Chapter 4 Competitive Landscape, 2025
- 4.1 Introduction
- 4.2 Company market share analysis
- 4.2.1 By region
- 4.2.1.1 North America
- 4.2.1.2 Europe
- 4.2.1.3 Asia Pacific
- 4.2.1.4 Latin America
- 4.2.1.5 Middle East & Africa
- 4.2.2 Market concentration analysis
- 4.2.1 By region
- 4.3 Competitive benchmarking of key players
- 4.3.1 Financial performance comparison
- 4.3.1.1 Revenue
- 4.3.1.2 Profit margin
- 4.3.1.3 R&D
- 4.3.2 Product portfolio comparison
- 4.3.2.1 Product range breadth
- 4.3.2.2 Technology
- 4.3.2.3 Innovation
- 4.3.3 Geographic presence comparison
- 4.3.3.1 Global footprint analysis
- 4.3.3.2 Service network coverage
- 4.3.3.3 Market penetration by region
- 4.3.4 Competitive positioning matrix
- 4.3.4.1 Leaders
- 4.3.4.2 Challengers
- 4.3.4.3 Followers
- 4.3.4.4 Niche players
- 4.3.5 Strategic outlook matrix
- 4.3.1 Financial performance comparison
- 4.4 Key developments
- 4.4.1 Mergers and acquisitions
- 4.4.2 Partnerships and collaborations
- 4.4.3 Technological advancements
- 4.4.4 Expansion and investment strategies
- 4.4.5 Digital transformation initiatives
- 4.5 Emerging/ startup competitors landscape
Chapter 5 Market Estimates and Forecast, By Product Type, 2022 - 2035 (USD Million & Units)
- 5.1 Key trends
- 5.2 LCD ESL
- 5.3 Segmented E-paper ESL
- 5.4 Full-graphic E-paper ESL
Chapter 6 Market Estimates and Forecast, By Display Size, 2022 - 2035 (USD Million & Units)
- 6.1 Key trends
- 6.2 Small (≤2 inches)
- 6.3 Medium (2-5 inches)
- 6.4 Large (>5 inches)
Chapter 7 Market Estimates and Forecast, By Technology, 2022 - 2035 (USD Million & Units)
- 7.1 Key trends
- 7.2 Radio frequency (RF)
- 7.3 Infrared (IR)
- 7.4 Near field communication (NFC)
- 7.5 Bluetooth
- 7.6 Others
Chapter 8 Market Estimates and Forecast, By Application, 2022 - 2035 (USD Million & Units)
- 8.1 Key trends
- 8.2 Retail
- 8.2.1 Supermarkets / hypermarkets
- 8.2.2 Convenience stores / retail chains
- 8.2.3 Electronics & appliance stores
- 8.2.4 Pharmacies
- 8.2.5 Others
- 8.3 Industrial
- 8.3.1 Industrial facilities
- 8.3.2 Warehouses
- 8.3.3 Distribution centers
- 8.3.4 Others
- 8.4 Others
Chapter 9 Market Estimates and Forecast, By Region, 2022 - 2035 (USD Million & Units)
- 9.1 Key trends
- 9.2 North America
- 9.2.1 U.S.
- 9.2.2 Canada
- 9.3 Europe
- 9.3.1 Germany
- 9.3.2 UK
- 9.3.3 France
- 9.3.4 Spain
- 9.3.5 Italy
- 9.4 Asia Pacific
- 9.4.1 China
- 9.4.2 India
- 9.4.3 Japan
- 9.4.4 Australia
- 9.4.5 South Korea
- 9.5 Latin America
- 9.5.1 Brazil
- 9.5.2 Mexico
- 9.5.3 Argentina
- 9.6 Middle East and Africa
- 9.6.1 South Africa
- 9.6.2 Saudi Arabia
- 9.6.3 UAE
Chapter 10 Company Profiles
- 10.1 Global Key Players
- 10.1.1 Delfi Technologies A/S
- 10.1.2 Panasonic Connect Co., Ltd.
- 10.1.3 Pricer
- 10.1.4 Silicon Laboratories
- 10.2 Regional key players
- 10.2.1 North America
- 10.2.1.1 ComQi
- 10.2.1.2 Infotek Software & Systems (P) Ltd.
- 10.2.1.3 VusionGroup
- 10.2.2 Asia Pacific
- 10.2.2.1 Hangzhou Zkong Networks Co., Ltd.
- 10.2.2.2 Shanghai SUNMI Technology Co., Ltd.
- 10.2.2.3 SOLUM
- 10.2.2.4 Minewtag
- 10.2.3 Europe
- 10.2.3.1 Displaydata Ltd
- 10.2.3.2 Hanshow Technology
- 10.2.3.3 Teraoka (Pty) Ltd
- 10.2.1 North America
- 10.3 Niche Players/Disruptors
- 10.3.1 M2COMM
- 10.3.2 Opticon
- 10.3.3 Sen Security Solutions
- 10.3.4 Ynvisible Interactive Inc.
 2026-2030年全球電子貨架標籤(ESL)市場
 電子貨架標籤市場報告:按類型、組件、技術、應用和地區分類(2026-2034 年)
 智慧貨架:市場佔有率分析、產業趨勢與統計、成長預測(2026-2031)
 電子貨架標籤市場:2026-2032年全球市場預測(按產品類型、組件、通訊技術、顯示尺寸、應用和分銷管道分類)
 電子貨架標籤市場:按技術、產品類型、應用和地區分類
 全球電子貨架標籤市場規模、佔有率、趨勢和成長分析報告(2026-2034)
 2026年全球電子貨架標籤市場報告
 電子貨架標籤市場分析及預測(至2035年):依類型、產品、服務、技術、組件、應用、形式、材料類型、部署方式及最終用戶分類
 電子貨架標籤市場 - 全球產業規模、佔有率、趨勢、機會及預測(按產品類型、通訊方式、最終用戶、地區和競爭格局分類,2021-2031年)
 電子貨架標籤(ESL)市場規模、佔有率和成長分析(按組件、類型、通訊技術、尺寸、應用和地區分類)-2026-2033年產業預測