


 |
市場調查報告書
商品編碼
1936595
軍事微電網市場機會、成長要素、產業趨勢分析及2026年至2035年預測Military Microgrid Market Opportunity, Growth Drivers, Industry Trend Analysis, and Forecast 2026 - 2035 |
||||||
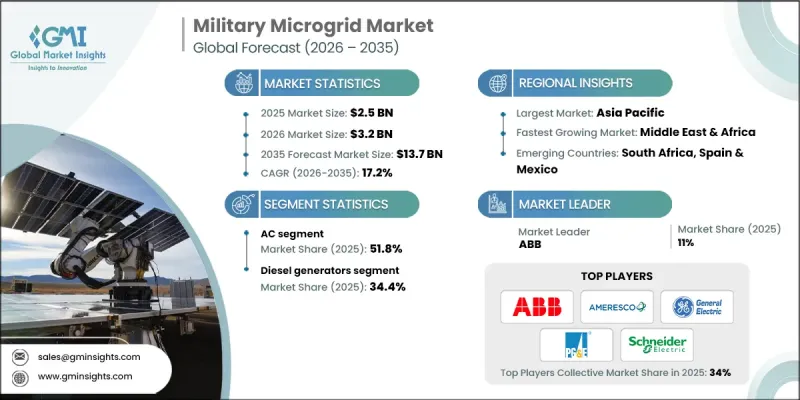
全球軍用微電網市場預計到 2025 年將達到 25 億美元,到 2035 年將達到 137 億美元,年複合成長率為 17.2%。
這種成長源於對不間斷、安全電力供應日益成長的需求,以支持在電網不穩定、網路風險和物理威脅等環境下進行的關鍵國防行動。傳統燃料物流的高成本和不確定性,尤其是在偏遠和高風險地區,促使軍事設施需要運作能源系統。微電網透過提供在地化、高彈性的電力,同時降低對集中式電網的依賴,從而應對這些挑戰。微電網能夠整合多種能源來源,並在極端條件下維持運作連續性,使其成為現代國防基礎設施的核心組成部分。軍用微電網作為自給自足的能源網路,可以獨立運作,也可以與主電網協同運作。結合可再生能源、儲能和傳統發電方式,可以增強能源安全,降低燃料消耗,並提高戰備水準。先進控制平台、即時能源管理和人工智慧驅動的最佳化工具的日益普及,進一步提升了微電網的可擴展性、性能和效率,加速了其在全球市場的滲透。
| 市場覆蓋範圍 | |
|---|---|
| 開始年份 | 2025 |
| 預測年份 | 2026-2035 |
| 起始值 | 25億美元 |
| 預測金額 | 137億美元 |
| 複合年成長率 | 17.2% |
直流電源市場預計到2035年將以17%的複合年成長率成長,這主要得益於其高效率以及與部署在軍事設施中的可再生能源發電和能源儲存系統的兼容性。直流電源架構能夠降低能量轉換損耗,並為敏感的國防設備提供穩定的電源。它們能夠減少對燃料發電的依賴,同時支持永續性目標,因此特別適用於在偏遠或受衝突影響地區運行的設施。
受天然氣良好的排放特性、成本優勢和可靠的燃料供應等因素的推動,預計到2035年,天然氣產業將以16.5%的複合年成長率成長。天然氣發電能夠保障不間斷供電,並可與再生能源來源有效整合,使國防設施能夠在不影響運作可靠性的前提下降低碳排放強度。這項轉型符合更廣泛的永續性目標,同時提高了軍事設施的能源效率。
預計到2025年,美國軍用微電網市場將佔據81.6%的市場佔有率,到2035年將成長至6.7億美元。市場擴張的主要驅動力是「能源韌性」的提升,旨在保護國防行動免受電網故障、網路攻擊和自然災害等造成的干擾。持續的機構支持和長期的基礎設施投資正在推動微電網的普及,軍事設施優先部署獨立於外部電網的自主能源系統,以確保任務的連續性和基礎設施的安全。
目錄
第1章調查方法和範圍
第2章執行摘要
第3章業界考察
- 產業生態系統
- 原物料供應及採購分析
- 製造能力評估
- 供應鏈韌性與風險因素
- 配電網路分析
- 監管環境
- 產業影響因素
- 促進要素
- 產業潛在風險與挑戰
- 成長潛力分析
- 成本結構分析
- 價格趨勢分析(美元/兆瓦)
- 按網格類型
- 按地區
- 波特五力分析
- PESTEL 分析
- 新的機會與趨勢
- 數位化和物聯網整合
- 拓展新興市場
- 投資分析及未來展望
第4章 競爭情勢
- 介紹
- 按地區分類的公司市佔率分析
- 北美洲
- 歐洲
- 亞太地區
- 中東和非洲
- 戰略儀錶板
- 策略舉措
- 企業標竿管理
- 創新與科技趨勢
第5章 依電網類型分類的市場規模及預測(2022-2035年)
- 交流微電網
- 直流微電網
- 混合
第6章 依連結方式分類的市場規模及預測(2022-2035年)
- 並網型
- 離網
第7章 依電源類型分類的市場規模及預測(2022-2035年)
- 柴油發電機
- 天然氣
- 太陽能發電
- CHP
- 其他
第8章 2022-2035年按儲能設備分類的市場規模及預測
- 鋰離子
- 鉛酸電池
- 液流電池
- 飛輪
- 其他
第9章 2022-2035年各地區市場規模及預測
- 北美洲
- 美國
- 加拿大
- 墨西哥
- 歐洲
- 德國
- 法國
- 英國
- 俄羅斯
- 西班牙
- 義大利
- 丹麥
- 亞太地區
- 中國
- 日本
- 韓國
- 印度
- 澳洲
- 中東和非洲
- 沙烏地阿拉伯
- 阿拉伯聯合大公國
- 南非
第10章:公司簡介
- ABB
- AES Corporation
- Ameresco
- Black &Veatch
- Burns &McDonnell
- Critical Loop
- Eaton Corporation
- General Electric
- Lockheed Martin
- PG&E
- PowerSecure
- S&C Electric Company
- Schneider Electric
- Siemens
The Global Military Microgrid Market was valued at USD 2.5 billion in 2025 and is estimated to grow at a CAGR of 17.2% to reach USD 13.7 billion by 2035.
Growth is driven by the increasing need for uninterrupted and secure power to support mission-critical defense operations in environments exposed to grid instability, cyber risks, and physical threats. Military installations increasingly require energy systems that can operate independently, particularly in remote or high-risk locations where traditional fuel logistics are costly and unreliable. Microgrids address these challenges by delivering localized, resilient power while reducing dependence on centralized grids. Their ability to integrate diverse energy sources and maintain operational continuity under extreme conditions has made them a core component of modern defense infrastructure. A military microgrid functions as a self-sufficient energy network capable of operating autonomously or in coordination with the main grid. By combining renewable energy, energy storage, and conventional generation, these systems enhance energy security, reduce fuel consumption, and improve readiness. Rising adoption of advanced control platforms, real-time energy management, and AI-driven optimization tools is further improving scalability, performance, and efficiency, accelerating global market penetration.
| Market Scope | |
|---|---|
| Start Year | 2025 |
| Forecast Year | 2026-2035 |
| Start Value | $2.5 Billion |
| Forecast Value | $13.7 Billion |
| CAGR | 17.2% |
The direct current segment is expected to grow at a CAGR of 17% through 2035, supported by its high efficiency and strong compatibility with renewable generation and energy storage systems deployed at military facilities. DC-based architectures reduce energy conversion losses and provide stable power delivery for sensitive defense equipment. Their ability to support sustainability objectives while lowering reliance on fuel-based generation makes them particularly suitable for installations operating in remote or contested environments.
The natural gas segment is forecast to grow at a CAGR of 16.5% by 2035, driven by favorable emissions profiles, cost advantages, and reliable fuel availability. Natural gas-based generation supports continuous power delivery while integrating effectively with renewable energy sources, enabling defense facilities to lower carbon intensity without compromising operational reliability. This transition aligns with broader sustainability goals while enhancing energy efficiency across military installations.
United States Military Microgrid Market held 81.6% share in 2025 and is projected to generate USD 670 million by 2035. Market expansion is fueled by a strong focus on energy resilience to protect defense operations from disruptions caused by grid failures, cyber incidents, or environmental events. Continued institutional backing and long-term infrastructure investment are reinforcing adoption, as military facilities prioritize autonomous energy systems that ensure mission continuity and infrastructure security without reliance on external grids.
Key companies operating in the Global Military Microgrid Market include Siemens, Schneider Electric, ABB, General Electric, Eaton Corporation, Ameresco, Lockheed Martin, Black & Veatch, Burns & McDonnell, PowerSecure, S&C Electric Company, AES Corporation, PG&E, and Critical Loop. Companies active in the military microgrid market are strengthening their market position through technology integration, long-term contracting, and solution customization. Leading players are investing in advanced control systems, AI-enabled energy management platforms, and modular microgrid architectures to improve flexibility and reliability. Strategic collaboration with defense agencies and infrastructure developers enables tailored system design aligned with mission requirements. Firms are also expanding service capabilities across installation, maintenance, and lifecycle management to secure recurring revenue. Emphasis on cybersecurity, system redundancy, and resilience engineering is enhancing value propositions.
Table of Contents
Chapter 1 Methodology & Scope
- 1.1 Research design
- 1.1.1 Research approach
- 1.1.2 Data collection methods
- 1.2 Base estimates and calculations
- 1.2.1 Base year calculation
- 1.2.2 Market estimates & forecast parameters
- 1.3 Forecast
- 1.3.1 Key trends for market estimates
- 1.3.1.1 Quantified market impact analysis
- 1.3.2 Mathematical impact of growth parameters on forecast
- 1.3.3 Scenario analysis framework
- 1.3.1 Key trends for market estimates
- 1.4 Primary research and validation
- 1.4.1 Some of the primary sources (but not limited to)
- 1.5 Data mining sources
- 1.5.1 Paid Sources
- 1.5.2 Sources, by region
- 1.6 Research trail & scoring components
- 1.6.1 Research trail components
- 1.6.2 Scoring components
- 1.7 Research transparency addendum
- 1.7.1 Source attribution framework
- 1.7.2 Quality assurance metrics
- 1.7.3 Our commitment to trust
- 1.8 Market definitions
Chapter 2 Executive Summary
- 2.1 Industry synopsis, 2022 - 2035
- 2.2 Business trends
- 2.3 Connectivity trends
- 2.4 Grid type trends
- 2.5 Power source trends
- 2.6 Storage device trends
- 2.7 Regional trends
Chapter 3 Industry Insights
- 3.1 Industry ecosystem
- 3.1.1 Raw material availability & sourcing analysis
- 3.1.2 Manufacturing capacity assessment
- 3.1.3 Supply chain resilience & risk factors
- 3.1.4 Distribution network analysis
- 3.2 Regulatory landscape
- 3.3 Industry impact forces
- 3.3.1 Growth drivers
- 3.3.2 Industry pitfalls & challenges
- 3.4 Growth potential analysis
- 3.5 Cost structure analysis
- 3.6 Price trend analysis (USD/MW)
- 3.6.1 By grid type
- 3.6.2 By region
- 3.7 Porter's analysis
- 3.7.1 Bargaining power of suppliers
- 3.7.2 Bargaining power of buyers
- 3.7.3 Threat of new entrants
- 3.7.4 Threat of substitutes
- 3.8 PESTEL analysis
- 3.8.1 Political factors
- 3.8.2 Economic factors
- 3.8.3 Social factors
- 3.8.4 Technological factors
- 3.8.5 Legal factors
- 3.8.6 Environmental factors
- 3.9 Emerging opportunities & trends
- 3.9.1 Digitalization & IoT integration
- 3.9.2 Emerging market penetration
- 3.10 Investment analysis and future outlook
Chapter 4 Competitive landscape, 2025
- 4.1 Introduction
- 4.2 Company market share analysis, by region, 2025
- 4.2.1 North America
- 4.2.2 Europe
- 4.2.3 Asia Pacific
- 4.2.4 Middle East & Africa
- 4.3 Strategic dashboard
- 4.4 Strategic initiatives
- 4.5 Company benchmarking
- 4.6 Innovation & technology landscape
Chapter 5 Market Size and Forecast, By Grid Type, 2022 - 2035 (USD Billion & MW)
- 5.1 Key trends
- 5.2 AC microgrid
- 5.3 DC microgrid
- 5.4 Hybrid
Chapter 6 Market Size and Forecast, By Connectivity, 2022 - 2035 (USD Billion & MW)
- 6.1 Key trends
- 6.2 Grid connected
- 6.3 Off grid
Chapter 7 Market Size and Forecast, By Power Source, 2022 - 2035 (USD Billion & MW)
- 7.1 Key trends
- 7.2 Diesel generators
- 7.3 Natural gas
- 7.4 Solar PV
- 7.5 CHP
- 7.6 Others
Chapter 8 Market Size and Forecast, By Storage Device, 2022 - 2035 (USD Billion & MW)
- 8.1 Key trends
- 8.2 Lithium-ion
- 8.3 Lead acid
- 8.4 Flow battery
- 8.5 Flywheels
- 8.6 Others
Chapter 9 Market Size and Forecast, By Region, 2022 - 2035 (USD Billion & MW)
- 9.1 Key trends
- 9.2 North America
- 9.2.1 U.S.
- 9.2.2 Canada
- 9.2.3 Mexico
- 9.3 Europe
- 9.3.1 Germany
- 9.3.2 France
- 9.3.3 UK
- 9.3.4 Russia
- 9.3.5 Spain
- 9.3.6 Italy
- 9.3.7 Denmark
- 9.4 Asia Pacific
- 9.4.1 China
- 9.4.2 Japan
- 9.4.3 South Korea
- 9.4.4 India
- 9.4.5 Australia
- 9.5 Middle East and Africa
- 9.5.1 Saudi Arabia
- 9.5.2 UAE
- 9.5.3 South Africa
Chapter 10 Company Profiles
- 10.1 ABB
- 10.2 AES Corporation
- 10.3 Ameresco
- 10.4 Black & Veatch
- 10.5 Burns & McDonnell
- 10.6 Critical Loop
- 10.7 Eaton Corporation
- 10.8 General Electric
- 10.9 Lockheed Martin
- 10.10 PG&E
- 10.11 PowerSecure
- 10.12 S&C Electric Company
- 10.13 Schneider Electric
- 10.14 Siemens
 導彈發射筒市場分析及預測(至2035年):類型、產品類型、技術、組件、應用、材質、最終用戶、功能、安裝配置、解決方案
 全球防禦性點火器激勵器市場(2026-2036 年)
 2026年全球軍用雷射警報系統市場報告2026年全球雷射導引星系統市場報告全球國防液壓儲槽和蓄能器市場:2026-2036年
 全球軍用熱感成像系統市場(按技術、頻譜範圍、平台類型、移動性、應用和最終用戶分類)預測(2026-2032年)武器瞄準鏡市場按類型、應用、最終用戶、分銷管道和放大倍率分類-2026-2032年全球預測槍枝護理產品市場報告:2031 年趨勢、預測與競爭分析雷射導引炸彈測試儀市場(全球)(2025-2035)
 軍用直流微電網市場機會、成長動力、產業趨勢分析及 2025 - 2034 年預測