


 |
市場調查報告書
商品編碼
1936585
軟性交流輸電系統市場:機會、成長要素、產業趨勢分析及預測(2026-2035年)Flexible AC Transmission Systems Market Opportunity, Growth Drivers, Industry Trend Analysis, and Forecast 2026 - 2035 |
||||||
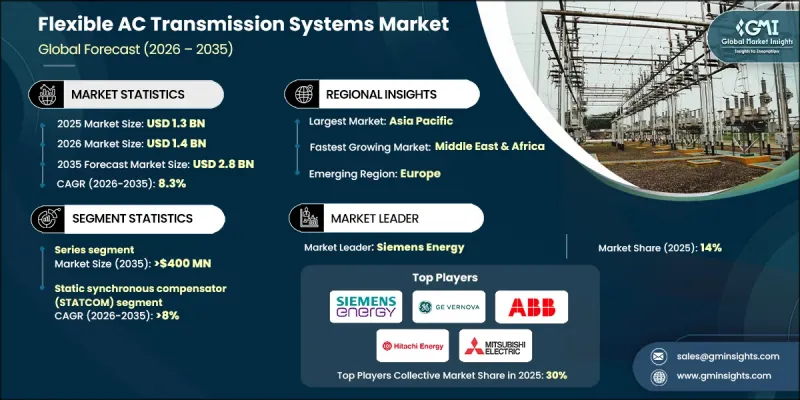
全球軟性交流輸電系統 (FACTS) 市場預計到 2025 年將達到 13 億美元,到 2035 年將達到 28 億美元,年複合成長率為 8.3%。
電力市場成長的驅動力在於電力傳輸基礎設施投資的增加,因為電力公司正在升級老化的電網,以適應不斷成長的電力流量和日益複雜的運行環境。由於可再生能源發電的快速併網,電網面臨著越來越大的壓力,這帶來了諸如波動性、電壓不穩定和間歇性等挑戰。隨著傳統電廠的逐步淘汰,現代電網越來越依賴逆變器發電,從而推動了對先進潮流控制和電壓調節解決方案的需求。已開發經濟體和新興經濟體的電網現代化努力,以及電力電子技術的不斷進步,正在加速軟性交流輸電系統(FACTS)技術的應用。先進的基於變換器的解決方案具有更快的響應速度、更強的可控性和更高的效率,使其非常適合動態電網環境。不斷成長的電力需求、輸電線路的擁塞以及最大限度地利用現有基礎設施容量的需求,使得FACTS系統成為現代電網的重要組成部分。
| 市場覆蓋範圍 | |
|---|---|
| 開始年份 | 2025 |
| 預測年份 | 2026-2035 |
| 起始金額 | 13億美元 |
| 預測金額 | 28億美元 |
| 複合年成長率 | 8.3% |
預計到2035年,串聯補償技術市場規模將達到4億美元,這反映了其在提高輸電效率和增強電網穩定性方面的重要性。串聯補償技術透過降低線路電抗來提高輸電能力,使電力公司能夠最佳化現有資產,而無需投資建造新的輸電線路。該技術能夠在提升效能的同時降低整體成本,因此持續在高負載輸電網路中廣泛應用。
受其快速無功功率輔助和精確電壓調節器能力的推動,靜態同步補償器市場預計到2035年將以8%的複合年成長率成長。這些系統在穩定高比例可再生能源電網方面發揮關鍵作用,並廣泛應用於波動負荷影響電能品質的工業環境。其柔軟性和快速動態響應使其成為公用事業規模和工業應用的首選解決方案。
預計2025年,美國軟性交流輸電系統市場規模將達2.603億美元。該國的成長得益於電網現代化進程的推進、電氣化率的提高以及可再生能源裝置容量的擴張。不斷成長的需求和不斷變化的負載曲線導致系統壓力日益增加,這持續推動對先進輸電控制技術的投資,以提高可靠性和運作效率。
目錄
第1章調查方法和範圍
第2章執行摘要
第3章業界考察
- 生態系分析
- 原料的供應情況;
- 影響價值鏈的因素
- 中斷
- 監管環境
- 產業影響因素
- 促進要素
- 產業潛在風險與挑戰
- 成長潛力分析
- 波特五力分析
- PESTEL 分析
- 新的機會與趨勢
- 投資分析及未來展望
第4章 競爭情勢
- 介紹
- 按地區分類的市場佔有率
- 北美洲
- 歐洲
- 亞太地區
- 中東和非洲
- 拉丁美洲
- 策略舉措
- 競爭標竿分析圖示
- 戰略儀錶板
- 創新與科技趨勢
第5章 依成分分類的市場規模及預測(2022-2035年)
- 系列
- 分流
- 一體化
第6章 依產品分類的市場規模及預測(2022-2035年)
- 靜無功補償器(SVC)
- 閘流體控制串聯電容器(TCSC)
- 靜止同步補償器(STATCOM)
- 統一功率流控制設備(UPFC)
- 其他
第7章 依電壓分類的市場規模及預測(2022-2035年)
- 132千伏至低於220千伏
- 220千伏至低於660千伏
- 超過660千伏
第8章 依最終用途分類的市場規模及預測(2022-2035年)
- 公共產業
- 可再生能源
- 智慧電網
- 鐵路
- 金屬和採礦
- 石油和天然氣
- 其他
第9章 2022-2035年各地區市場規模及預測
- 北美洲
- 美國
- 加拿大
- 墨西哥
- 歐洲
- 英國
- 法國
- 德國
- 義大利
- 俄羅斯
- 西班牙
- 亞太地區
- 中國
- 澳洲
- 印度
- 日本
- 韓國
- 中東和非洲
- 沙烏地阿拉伯
- 阿拉伯聯合大公國
- 土耳其
- 南非
- 埃及
- 拉丁美洲
- 巴西
- 阿根廷
第10章:公司簡介
- ABB
- BHEL
- Elkraft Solutions Limited
- Fuji SMBE Pte Ltd.
- GE Vernova
- HICO America
- Hitachi Energy
- Hyosung Heavy Industries
- Infineon
- Ingeteam
- LS Electric Co.
- Mitsubishi Electric
- NR Electric
- Quanta Technology
- Siemens Energy
The Global Flexible AC Transmission Systems Market was valued at USD 1.3 billion in 2025 and is estimated to grow at a CAGR of 8.3% to reach USD 2.8 billion by 2035.
Market growth is driven by rising investment in transmission infrastructure as utilities upgrade aging grids to manage higher electricity flows and increasing operational complexity. Power networks are under growing pressure due to rapid renewable energy integration, which introduces variability, voltage instability, and intermittency challenges. As conventional power plants are gradually retired, modern grids increasingly rely on inverter-based generation, intensifying the need for advanced power flow control and voltage regulation solutions. Grid modernization initiatives across developed and emerging economies are accelerating the adoption of FACTS technologies, supported by continuous improvements in power electronics. Advanced converter-based solutions now offer faster response times, enhanced controllability, and improved efficiency, making them well-suited for dynamic grid conditions. Increasing electricity demand, congestion across transmission corridors, and the requirement to maximize existing infrastructure capacity are positioning FACTS systems as essential components of modern power networks.
| Market Scope | |
|---|---|
| Start Year | 2025 |
| Forecast Year | 2026-2035 |
| Start Value | $1.3 Billion |
| Forecast Value | $2.8 Billion |
| CAGR | 8.3% |
The series segment is projected to reach USD 400 million by 2035, reflecting its importance in improving transmission efficiency and enhancing grid stability. Series compensation technologies increase power transfer capability by reducing line reactance, allowing utilities to optimize existing assets rather than invest in new transmission construction. Their ability to deliver performance improvements at a lower overall cost continues to support steady deployment across high-load transmission networks.
The static synchronous compensator segment is expected to grow at a CAGR of 8% through 2035, driven by its ability to provide rapid reactive power support and precise voltage control. These systems play a critical role in stabilizing grids with high renewable penetration and are widely adopted in industrial environments where fluctuating loads impact power quality. Their flexibility and fast dynamic response make them a preferred solution for both utility-scale and industrial applications.
U.S. Flexible AC Transmission Systems Market USD 260.3 million in 2025. Growth in the country is supported by ongoing grid modernization efforts, rising electrification, and expanding renewable capacity. Increasing system stress from higher demand and evolving load profiles continues to drive investment in advanced transmission control technologies that enhance reliability and operational efficiency.
Key companies active in the Global Flexible AC Transmission Systems Market include Siemens Energy, Hitachi Energy, GE Vernova, Mitsubishi Electric, ABB, Hyosung Heavy Industries, LS Electric Co., Ingeteam, Infineon, Fuji SMBE Pte Ltd., BHEL, HICO America, NR Electric, Quanta Technology, and Elkraft Solutions Limited. Companies operating in the flexible AC transmission systems market focus on strengthening their market position through continuous technological innovation and strategic partnerships with utilities and grid operators. Investment in advanced power electronics, digital control platforms, and modular solutions enables suppliers to deliver flexible and scalable systems tailored to evolving grid requirements. Firms are also expanding service offerings that include system design, commissioning, and long-term maintenance to enhance customer retention. Geographic expansion into high-growth regions and participation in grid modernization programs support revenue diversification.
Table of Contents
Chapter 1 Methodology & Scope
- 1.1 Research design
- 1.2 Market estimates & forecast parameters
- 1.3 Forecast calculation
- 1.4 Data sources
- 1.4.1 Primary
- 1.4.2 Secondary
- 1.4.2.1 Paid
- 1.4.2.2 Public
Chapter 2 Executive Summary
- 2.1 Industry synopsis, 2022 - 2035
Chapter 3 Industry Insights
- 3.1 Industry ecosystem analysis
- 3.1.1 Raw material availability landscape
- 3.1.2 Factors affecting the value chain
- 3.1.3 Disruptions
- 3.2 Regulatory landscape
- 3.3 Industry impact forces
- 3.3.1 Growth drivers
- 3.3.2 Industry pitfalls & challenges
- 3.4 Growth potential analysis
- 3.5 Porter's analysis
- 3.5.1 Bargaining power of suppliers
- 3.5.2 Bargaining power of buyers
- 3.5.3 Threat of new entrants
- 3.5.4 Threat of substitutes
- 3.6 PESTEL analysis
- 3.6.1 Political factors
- 3.6.2 Economic factors
- 3.6.3 Social factors
- 3.6.4 Technological factors
- 3.6.5 Legal factors
- 3.6.6 Environmental factors
- 3.7 Emerging opportunities & trends
- 3.8 Investment analysis & future outlook
Chapter 4 Competitive Landscape, 2025
- 4.1 Introduction
- 4.2 Company market share, by region, 2025
- 4.2.1 North America
- 4.2.2 Europe
- 4.2.3 Asia Pacific
- 4.2.4 Middle East & Africa
- 4.2.5 Latin America
- 4.3 Strategic initiatives
- 4.4 Competitive benchmarking depictions
- 4.5 Strategy dashboard
- 4.6 Innovation & technology landscape
Chapter 5 Market Size and Forecast, By Configuration, 2022 - 2035 (USD Million, MVAr)
- 5.1 Key trends
- 5.2 Series
- 5.3 Shunt
- 5.4 Combined
Chapter 6 Market Size and Forecast, By Product, 2022 - 2035 (USD Million, MVAr)
- 6.1 Key trends
- 6.2 Static Var Compensator (SVC)
- 6.3 Thyristor Controlled Series Capacitor (TCSC)
- 6.4 Static Synchronous Compensator (STATCOM)
- 6.5 Unified Power Flow Controller (UPFC)
- 6.6 Others
Chapter 7 Market Size and Forecast, By Voltage, 2022 - 2035 (USD Million, MVAr)
- 7.1 Key trends
- 7.2 > 132 kV to ≤ 220 kV
- 7.3 > 220 kV to ≤ 660 kV
- 7.4 > 660 kV
Chapter 8 Market Size and Forecast, By End Use, 2022 - 2035 (USD Million, MVAr)
- 8.1 Key trends
- 8.2 Utilities
- 8.3 Renewables
- 8.4 Smart grid
- 8.5 Railways
- 8.6 Metal & mining industries
- 8.7 Oil & gas
- 8.8 Others
Chapter 9 Market Size and Forecast, By Region, 2022 - 2035 (USD Million, MVAr)
- 9.1 Key trends
- 9.2 North America
- 9.2.1 U.S.
- 9.2.2 Canada
- 9.2.3 Mexico
- 9.3 Europe
- 9.3.1 UK
- 9.3.2 France
- 9.3.3 Germany
- 9.3.4 Italy
- 9.3.5 Russia
- 9.3.6 Spain
- 9.4 Asia Pacific
- 9.4.1 China
- 9.4.2 Australia
- 9.4.3 India
- 9.4.4 Japan
- 9.4.5 South Korea
- 9.5 Middle East & Africa
- 9.5.1 Saudi Arabia
- 9.5.2 UAE
- 9.5.3 Turkey
- 9.5.4 South Africa
- 9.5.5 Egypt
- 9.6 Latin America
- 9.6.1 Brazil
- 9.6.2 Argentina
Chapter 10 Company Profiles
- 10.1 ABB
- 10.2 BHEL
- 10.3 Elkraft Solutions Limited
- 10.4 Fuji SMBE Pte Ltd.
- 10.5 GE Vernova
- 10.6 HICO America
- 10.7 Hitachi Energy
- 10.8 Hyosung Heavy Industries
- 10.9 Infineon
- 10.10 Ingeteam
- 10.11 LS Electric Co.
- 10.12 Mitsubishi Electric
- 10.13 NR Electric
- 10.14 Quanta Technology
- 10.15 Siemens Energy
 軟性交流輸電系統市場-全球市場預測(2026-2032年)
 全球軟性交流輸電系統市場規模、佔有率、趨勢及成長分析報告(2026-2034年)
 軟性交流輸電系統市場:依補償類型、控制器、產業及地區分類,2026-2034年
 2026年全球軟性交流輸電系統(FACTS)市場報告
 美國軟性交流輸電系統市場規模、佔有率和趨勢分析報告:按技術、應用、地區和細分市場預測(2025-2033 年)
 2032年軟性交流輸電系統市場預測:按補償類型、應用、最終用戶和地區進行的全球分析
 軟性交流輸電系統市場-全球產業規模、佔有率、趨勢、機會及預測(細分、按薪酬類型、按控制器、按行業垂直、按地區、按競爭,2020-2030 年預測)
 彈性交流輸電系統市場報告:趨勢、預測與競爭分析(至2031年)
 軟性變壓器的全球市場規模、佔有率和趨勢分析:按類型、電壓等級、額定功率、技術、應用、最終用戶和地區分類的展望和預測(2024-2031)