

 |
市場調查報告書
商品編碼
1936576
車輛收費系統市場:機會、成長要素、產業趨勢分析及預測(2026-2035年)Vehicle Tolling System Market Opportunity, Growth Drivers, Industry Trend Analysis, and Forecast 2026 - 2035 |
||||||
全球車輛收費系統市場預計到 2025 年將達到 148 億美元,到 2035 年將達到 309 億美元,年複合成長率為 7.7%。
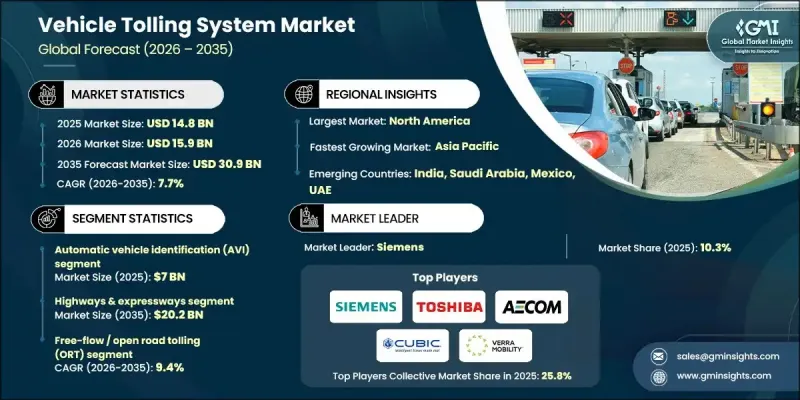
世界各國政府正透過基礎設施現代化政策和監管支持,加速採用電子化和連網收費解決方案。無現金收費日益被視為緩解交通堵塞、提高道路效率以及提升客運和商務傳輸用戶便利性的重要工具。數位化收費平台目前管理龐大的收費公路網路,實現了自動支付處理和順暢的交通流量。公共投資框架持續支持擁塞管理和智慧型運輸系統,從而增強了長期需求。交通管理部門正迅速以先進的電子收費系統取代實體收費亭,以實現車輛的連續通行。互通性要求正逐步標準化,使得單一車輛辨識設備能夠在多個區域運作。產業數據顯示,目前全球約78%的收費交易已實現電子化處理。公共和私營運營商之間的合作正在提高系統相容性,簡化用戶訪問,並降低管理複雜性。
| 市場覆蓋範圍 | |
|---|---|
| 開始年份 | 2025 |
| 預測年份 | 2026-2035 |
| 起始金額 | 148億美元 |
| 預測金額 | 309億美元 |
| 複合年成長率 | 7.7% |
預計到2025年,自動車輛識別(AVI)市場規模將達到70億美元。該市場的主導在於利用電子識別技術實現快速、準確的車輛識別。自動識別技術能夠減少人工干預,提高收費準確性,並有助於與現代收費基礎設施無縫整合。全球電子收費系統的日益普及,也持續推動該市場的強勁成長。
預計到 2025 年,高速公路和快速道路部分將佔 68.1% 的佔有率,到 2035 年將達到 202 億美元。由於這些道路網路交通密度高、產生收入穩定,並且較早採用先進的收費技術來支援長途和高速旅行,因此它們是收費投資的主流。
預計到2025年,美國車輛收費系統市場規模將達51億美元。各州正致力於透過擴建收費公路網路來提高貨運效率、增強區域連通性並緩解交通堵塞。自動收費技術正逐步取代人工收費,以提高營運效率和交通流量。
目錄
第1章調查方法
第2章執行摘要
第3章業界考察
- 生態系分析
- 供應商情況
- 利潤率
- 成本結構
- 每個階段的附加價值
- 影響價值鏈的因素
- 中斷
- 產業影響因素
- 促進要素
- 擴大電子收費系統(ETC)的引進範圍
- 擴建道路基礎設施和高速公路網路
- 日益嚴重的交通堵塞以及對高效交通管理的需求
- 無線射頻識別(RFID)、車牌自動識別(ANPR)和全球導航衛星系統(GNSS)技術的整合
- 產業潛在風險與挑戰
- 收費系統之間的互通性挑戰
- 營運和維護的複雜性
- 市場機遇
- 擴大開放車道收費和無障礙系統
- 引入基於GNSS和基於距離的收費系統
- 新興經濟體的成長機遇
- 收費公路計劃中的公私合營(PPP)
- 促進要素
- 成長潛力分析
- 監管環境
- 北美洲
- 美國聯邦公路管理局(FHWA)
- 州公路和收費公路管理局 (SRTA)
- 北德克薩斯收費公路管理局(NTTA)
- 歐洲
- 歐盟委員會
- 交通管制局 (Autoritadi Regolazione dei Trasporti, ART)
- 英格蘭的公路/路線
- 亞太地區
- 印度國家公路管理局(NHAI)
- 運輸部
- 陸路交通管理局(LTA)
- 澳洲收費機構
- 拉丁美洲
- 國家陸路運輸局(ANTT)
- 國家公路管理局(DNV)
- 中東和非洲
- 南非國家公路管理局(SANRAL)
- 道路與交通管理局(RTA)
- 沙烏地阿拉伯交通與物流服務部
- 北美洲
- 波特五力分析
- PESTEL 分析
- 科技與創新趨勢
- 當前技術趨勢
- 新興技術
- 價格趨勢
- 按地區
- 依產品
- 成本細分分析
- 永續性和環境影響
- 環境影響評估
- 社會影響力和社區服務
- 公司管治與企業社會責任
- 永續金融與投資趨勢
- 互通性和標準化現狀
- 區域互通性舉措
- 跨境收費挑戰與解決方案
- 通用費率標籤和多重通訊協定兼容性
- 協調努力和未來藍圖
- 智慧城市整合與旅遊即服務
- 收費系統與城市交通平台的整合
- 聯網汽車生態系和V2X通訊
- 無縫多式聯運支付系統
- 將智慧停車與您的收費帳戶關聯
- 案例研究
- 未來前景與機遇
第4章 競爭情勢
- 介紹
- 公司市佔率分析
- 北美洲
- 歐洲
- 亞太地區
- 拉丁美洲
- 中東和非洲
- 主要市場公司的競爭分析
- 競爭定位矩陣
- 戰略展望矩陣
- 重大進展
- 併購
- 夥伴關係與合作
- 新產品發布
- 企業擴張計畫和資金籌措
第5章 依產品類型分類的市場估算與預測,2022-2035年
- 硬體
- 道路設備(RSE)
- 車載單元(OBU)
- 中央和網路硬體
- 軟體
- 服務
第6章 2022-2035年各系統市場估算與預測
- 自動車輛辨識(AVI)
- 自動車輛分類(AVC)
- 車輛執法系統(VES)
- 其他
第7章 按技術分類的市場估計與預測,2022-2035年
- 無線射頻識別(RFID)
- 專用短程通訊(DSRC)
- GNSS/GPS
- 影像分析/CCTV系統
- 其他
第8章 依收集方法分類的市場估算與預測,2022-2035年
- 自動收費/電子收費(ETC)
- 人工收費
- 自由流/開放車道收費(ORT)
第9章 依支付方式分類的市場估計與預測,2022-2035年
- 預付
- 延期付款
- 車牌認證支付
第10章 依車輛類型分類的市場估計與預測,2022-2035年
- 搭乘用車
- 掀背車
- 轎車
- SUV
- 商用車輛
- LCV
- MCV
- HCV
第11章 按應用領域分類的市場估算與預測,2022-2035年
- 高速公路和快速路
- 城市收費公路
- 橋樑和隧道
- 停車場管理和門禁管制
第12章 依最終用途分類的市場估計與預測,2022-2035年
- 政府/公共部門
- 私部門
第13章 2022-2035年各地區市場估算與預測
- 北美洲
- 美國
- 加拿大
- 歐洲
- 德國
- 英國
- 法國
- 義大利
- 西班牙
- 俄羅斯
- 北歐國家
- 比荷盧經濟聯盟
- 亞太地區
- 中國
- 印度
- 日本
- 韓國
- ANZ
- 新加坡
- 馬來西亞
- 印尼
- 越南
- 泰國
- 拉丁美洲
- 巴西
- 墨西哥
- 阿根廷
- 哥倫比亞
- 中東和非洲
- 南非
- 沙烏地阿拉伯
- 阿拉伯聯合大公國
第14章:公司簡介
- 世界公司
- Kapsch TrafficCom
- Siemens
- Thales
- Conduent
- ST Engineering(TransCore)
- Cubic
- EFKON
- Neology
- Toshiba
- VINCI
- Q-Free
- AECOM
- Mitsubishi
- SICE
- Indra Sistemas
- 當地公司
- Mundys
- Autostrade per l'Italia
- Brisa
- (Automatic systems)TollPlus
- P Square Solutions
- Perceptics
- 新興企業
- BestPass
- AEye
- Star Systems International
- Kistler
The Global Vehicle Tolling System Market was valued at USD 14.8 billion in 2025 and is estimated to grow at a CAGR of 7.7% to reach USD 30.9 billion by 2035.
Governments worldwide are accelerating the adoption of electronic and connected tolling solutions through infrastructure modernization policies and regulatory support. Cashless tolling is increasingly viewed as essential for reducing congestion, improving road efficiency, and enhancing user convenience across passenger and commercial transport. Digital tolling platforms now manage extensive tolled road networks, enabling automated payment processing and smoother traffic movement. Public investment frameworks continue to support congestion management and intelligent transport systems, reinforcing long-term demand. Transport authorities are rapidly replacing physical toll booths with advanced electronic models that allow uninterrupted vehicle movement. Interoperability requirements are becoming standard, allowing a single vehicle identification device to function across multiple regions. Industry data indicates that nearly 78% of toll transactions worldwide are now processed electronically. Collaboration between public agencies and private operators is improving system compatibility, simplifying user access, and reducing administrative complexity.
| Market Scope | |
|---|---|
| Start Year | 2025 |
| Forecast Year | 2026-2035 |
| Start Value | $14.8 Billion |
| Forecast Value | $30.9 Billion |
| CAGR | 7.7% |
The automatic vehicle identification segment generated USD 7 billion in 2025. This segment leads due to its ability to deliver fast and accurate vehicle recognition using electronic identification technologies. Automated identification reduces manual intervention, improves toll accuracy, and supports seamless integration with modern tolling infrastructure. Rising deployment of electronic toll collection systems globally continues to support strong growth for this segment.
The highways and expressways segment accounted for 68.1% share in 2025 and is expected to reach USD 20.2 billion by 2035. These roadways dominate tolling investments due to high traffic density, consistent revenue generation, and early adoption of advanced tolling technologies that support long-distance and high-speed travel.
US Vehicle Tolling System Market reached USD 5.1 billion in 2025. State-level initiatives focus on improving freight efficiency, enhancing regional connectivity, and reducing congestion through expanded toll road networks. Automated tolling technologies are increasingly replacing manual collection to improve operational efficiency and traffic flow.
Key companies operating in the Global Vehicle Tolling System Market include Thales, Siemens, Kapsch TrafficCom, Cubic, Conduent, Toshiba, Verra Mobility, ST Engineering, AECOM, and Mundys. Companies in the vehicle tolling system market strengthen their competitive position by investing in advanced digital platforms, interoperability standards, and scalable infrastructure solutions. Providers focus on developing end-to-end tolling ecosystems that integrate hardware, software, analytics, and back-office operations. Strategic partnerships with governments and infrastructure operators support long-term contracts and large-scale deployments. Firms also prioritize data security, real-time traffic analytics, and system reliability to meet regulatory and user expectations. Expansion into emerging regions, along with modular solutions that support multi-lane free-flow environments, helps companies capture new revenue streams and reinforce their global market presence.
Table of Contents
Chapter 1 Methodology
- 1.1 Research approach
- 1.2 Quality commitments
- 1.2.1 GMI AI policy & data integrity commitment
- 1.3 Research trail & confidence scoring
- 1.3.1 Research trail components
- 1.3.2 Scoring components
- 1.4 Data collection
- 1.4.1 Partial list of primary sources
- 1.5 Data mining sources
- 1.5.1 Paid sources
- 1.6 Base estimates and calculations
- 1.6.1 Base year calculation
- 1.7 Forecast model
- 1.8 Research transparency addendum
Chapter 2 Executive Summary
- 2.1 Industry 360° synopsis
- 2.2 Key market trends
- 2.2.1 Regional
- 2.2.2 Offering
- 2.2.3 System
- 2.2.4 Technology
- 2.2.5 Tolling Method
- 2.2.6 Payment Method
- 2.2.7 Application
- 2.2.8 Vehicle
- 2.2.9 End Use
- 2.3 TAM analysis, 2026-2035
- 2.4 CXO perspectives: Strategic imperatives
- 2.4.1 Executive decision points
- 2.4.2 Critical success factors
- 2.5 Future outlook and recommendations
Chapter 3 Industry Insights
- 3.1 Industry ecosystem analysis
- 3.1.1 Supplier landscape
- 3.1.2 Profit margin
- 3.1.3 Cost structure
- 3.1.4 Value addition at each stage
- 3.1.5 Factor affecting the value chain
- 3.1.6 Disruptions
- 3.2 Industry impact forces
- 3.2.1 Growth drivers
- 3.2.1.1 Rising adoption of electronic toll collection (ETC) systems
- 3.2.1.2 Increasing road infrastructure development and highway expansion
- 3.2.1.3 Growing traffic congestion and need for efficient traffic management
- 3.2.1.4 Integration of RFID, ANPR, and GNSS technologies
- 3.2.2 Industry pitfalls and challenges
- 3.2.2.1 Interoperability challenges across tolling systems
- 3.2.2.2 Operational and maintenance complexity
- 3.2.3 Market opportunities
- 3.2.3.1 Expansion of open road tolling and barrier-free systems
- 3.2.3.2 Adoption of GNSS-based and distance-based tolling
- 3.2.3.3 Growth opportunities in emerging economies
- 3.2.3.4 Public-private partnerships (PPPs) in toll road projects
- 3.2.1 Growth drivers
- 3.3 Growth potential analysis
- 3.4 Regulatory landscape
- 3.4.1 North America
- 3.4.1.1 Federal Highway Administration (FHWA) - USA
- 3.4.1.2 State Road and Tollway Authority (SRTA)
- 3.4.1.3 North Texas Tollway Authority (NTTA)
- 3.4.2 Europe
- 3.4.2.1 European Commission
- 3.4.2.2 Autorita di Regolazione dei Trasporti (ART)
- 3.4.2.3 Highways England / National Highways
- 3.4.3 Asia Pacific
- 3.4.3.1 National Highways Authority of India (NHAI)
- 3.4.3.2 Ministry of Transport (MoT)
- 3.4.3.3 Land Transport Authority (LTA)
- 3.4.3.4 Australia’s Tolling Authorities
- 3.4.4 Latin America
- 3.4.4.1 Agencia Nacional de Transportes Terrestres (ANTT)
- 3.4.4.2 National Roads Directorate (DNV)
- 3.4.5 Middle East & Africa
- 3.4.5.1 South African National Roads Agency Limited (SANRAL)
- 3.4.5.2 Roads and Transport Authority (RTA)
- 3.4.5.3 Saudi Ministry of Transport & Logistic Services
- 3.4.1 North America
- 3.5 Porter's analysis
- 3.6 PESTEL analysis
- 3.7 Technology and innovation landscape
- 3.7.1 Current technological trends
- 3.7.2 Emerging technologies
- 3.8 Price trends
- 3.8.1 By region
- 3.8.2 By product
- 3.9 Cost breakdown analysis
- 3.10 Sustainability and environmental impact
- 3.10.1 Environmental impact assessment
- 3.10.2 Social impact & community benefits
- 3.10.3 Governance & corporate responsibility
- 3.10.4 Sustainable finance & investment trends
- 3.11 Interoperability and standardization landscape
- 3.11.1 Regional interoperability initiatives
- 3.11.2 Cross-border tolling challenges and solutions
- 3.11.3 Universal toll tag and multi-protocol compatibility
- 3.11.4 Harmonization efforts and future roadmap
- 3.12 Smart city integration and mobility-as-a-service
- 3.12.1 Tolling integration with urban mobility platforms
- 3.12.2. Connected vehicle ecosystem and V2 X communication
- 3.12.3 Seamless intermodal payment systems
- 3.12.4 Smart parking integration with toll accounts
- 3.13 Case studies
- 3.14 Future outlook & opportunities
Chapter 4 Competitive Landscape, 2025
- 4.1 Introduction
- 4.2 Company market share analysis
- 4.2.1 North America
- 4.2.2 Europe
- 4.2.3 Asia Pacific
- 4.2.4 LATAM
- 4.2.5 MEA
- 4.3 Competitive analysis of major market players
- 4.4 Competitive positioning matrix
- 4.5 Strategic outlook matrix
- 4.6 Key developments
- 4.6.1 Mergers & acquisitions
- 4.6.2 Partnerships & collaborations
- 4.6.3 New product launches
- 4.6.4 Expansion plans and funding
Chapter 5 Market Estimates & Forecast, By Offering, 2022 - 2035 ($Bn, Units)
- 5.1 Key trends
- 5.2 Hardware
- 5.2.1 Roadside Equipment (RSE)
- 5.2.2 On-Board Units (OBU)
- 5.2.3 Central & Network Hardware
- 5.3 Software
- 5.4 Services
Chapter 6 Market Estimates & Forecast, By System, 2022 - 2035 ($Bn, Units)
- 6.1 Key trends
- 6.2 Automatic Vehicle Identification (AVI)
- 6.3 Automatic Vehicle Classification (AVC)
- 6.4 Violation Enforcement System (VES)
- 6.5 Others
Chapter 7 Market Estimates & Forecast, By Technology, 2022 - 2035 ($Bn, Units)
- 7.1 Key trends
- 7.2 Radio-Frequency Identification (RFID)
- 7.3 Dedicated Short-Range Communication (DSRC)
- 7.4 Global Navigation Satellite System (GNSS)/GPS
- 7.5 Video analytics/CCTV-based systems
- 7.6 Others
Chapter 8 Market Estimates & Forecast, By Tolling Method, 2022 - 2035 ($Bn, Units)
- 8.1 Key trends
- 8.2 Automatic Tolling / Electronic Toll Collection (ETC)
- 8.3 Manual toll collection
- 8.4 Free-Flow / Open Road Tolling (ORT)
Chapter 9 Market Estimates & Forecast, By Payment Method, 2022 - 2035 ($Bn, Units)
- 9.1 Key trends
- 9.2 Prepaid
- 9.3 Postpaid
- 9.4 Pay-By-Plate
Chapter 10 Market Estimates & Forecast, By Vehicle, 2022 - 2035 ($Bn, Units)
- 10.1 Key trends
- 10.2 Passenger cars
- 10.2.1 Hatchback
- 10.2.2 Sedan
- 10.2.3 SUV
- 10.3 Commercial vehicles
- 10.3.1 LCV
- 10.3.2 MCV
- 10.3.3 HCV
Chapter 11 Market Estimates & Forecast, By Application, 2022 - 2035 ($Bn, Units)
- 11.1 Key trends
- 11.2 Highways & Expressways
- 11.3 Urban tolling
- 11.4 Bridges & Tunnels
- 11.5 Parking & Access Control
Chapter 12 Market Estimates & Forecast, By End Use, 2022 - 2035 ($Bn, Units)
- 12.1 Key trends
- 12.2 Government / Public Sector
- 12.3 Private Sector
Chapter 13 Market Estimates & Forecast, By Region, 2022 - 2035 ($Bn, Units)
- 13.1 Key trends
- 13.2 North America
- 13.2.1 US
- 13.2.2 Canada
- 13.3 Europe
- 13.3.1 Germany
- 13.3.2 UK
- 13.3.3 France
- 13.3.4 Italy
- 13.3.5 Spain
- 13.3.6 Russia
- 13.3.7 Nordics
- 13.3.8 Benelux
- 13.4 Asia Pacific
- 13.4.1 China
- 13.4.2 India
- 13.4.3 Japan
- 13.4.4 South Korea
- 13.4.5 ANZ
- 13.4.6 Singapore
- 13.4.7 Malaysia
- 13.4.8 Indonesia
- 13.4.9 Vietnam
- 13.4.10 Thailand
- 13.5 Latin America
- 13.5.1 Brazil
- 13.5.2 Mexico
- 13.5.3 Argentina
- 13.5.4 Colombia
- 13.6 MEA
- 13.6.1 South Africa
- 13.6.2 Saudi Arabia
- 13.6.3 UAE
Chapter 14 Company Profiles
- 14.1 Global companies
- 14.1.1 Kapsch TrafficCom
- 14.1.2 Siemens
- 14.1.3 Thales
- 14.1.4 Conduent
- 14.1.5 ST Engineering (TransCore)
- 14.1.6 Cubic
- 14.1.7 EFKON
- 14.1.8 Neology
- 14.1.9 Toshiba
- 14.1.10 VINCI
- 14.1.11 Q-Free
- 14.1.12 AECOM
- 14.1.13 Mitsubishi
- 14.1.14 SICE
- 14.1.15 Indra Sistemas
- 14.2 Regional companies
- 14.2.1 Mundys
- 14.2.2 Autostrade per l'Italia
- 14.2.3 Brisa
- 14.2.4. ( Automatic systems) TollPlus
- 14.2.5 P Square Solutions
- 14.2.6 Perceptics
- 14.3 Emerging companies
- 14.3.1 BestPass
- 14.3.2 AEye
- 14.3.3 Star Systems International
- 14.3.4 Kistler


