


 |
市場調查報告書
商品編碼
1936568
區域供冷市場機會、成長要素、產業趨勢分析及2026年至2035年預測District Cooling Market Opportunity, Growth Drivers, Industry Trend Analysis, and Forecast 2026 - 2035 |
||||||
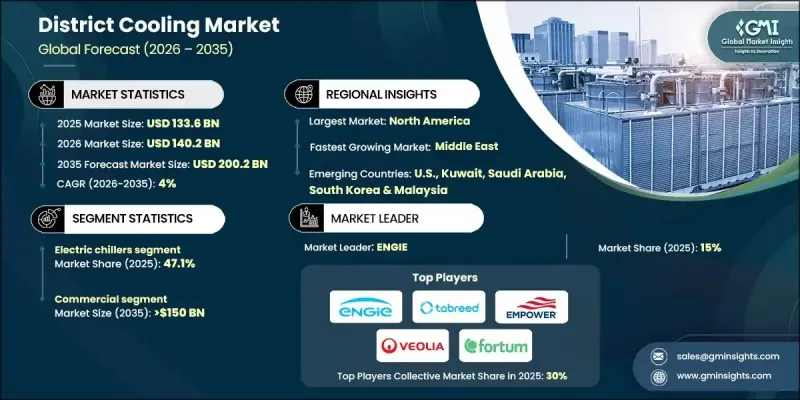
全球區域供冷市場預計到 2025 年將達到 1,336 億美元,到 2035 年將達到 2,002 億美元,年複合成長率為 4%。
城市化進程的加速以及人口密集地區對高效空間冷卻需求的不斷成長,推動了市場成長。為響應全球永續性目標,人們日益重視降低能源消耗和碳排放,這進一步增強了產業發展動能。區域供冷系統運作集中式冷凍水生產,並透過隔熱管網向多棟建築輸送冷水,是獨立式冷凍系統的高效替代方案。這些解決方案有助於降低電力需求、最佳化負載管理並減少對環境的影響。能源成本的上漲以及對最佳化熱效率日益成長的需求,促使人們傾向於選擇集中式冷凍基礎設施。替代能源和熱回收技術的整合進一步提升了系統性能和永續性。政府主導的節能項目和綠建築標準正在推動其更廣泛的應用。對系統升級、管網擴建和先進儲熱技術的持續投資,提高了運作韌性和長期成本效益,從而鞏固了全球市場的穩定成長。
| 市場覆蓋範圍 | |
|---|---|
| 開始年份 | 2025 |
| 預測年份 | 2026-2035 |
| 起始值 | 1336億美元 |
| 預測金額 | 2002億美元 |
| 複合年成長率 | 4% |
到2025年,基於電動冷卻器機組的區域供冷系統市場佔有率將達到47.1%。此細分市場的成長主要得益於大型冷凍機組的日益普及,這些機組旨在支援集中式基礎設施。冷卻器效率的提升、性能最佳化以及智慧控制技術的整合,正不斷推動其在大規模供冷網路中的應用。
預計到2025年,商業應用領域將佔市場佔有率的76.7%,到2035年將達到1,500億美元。市場需求主要源自於對可靠、節能的冷凍解決方案的需求,這些解決方案需能滿足大規模建築群的需求,並符合不斷發展的能源效率標準。自動化和系統最佳化技術的進步也持續推動著商業領域的成長。
預計到 2025 年,美國區域供冷市場將創造 1,090 億美元的收入,佔市場佔有率的 90.5%。強力的監管、節能冷卻技術的採用以及高密度城市發展將繼續支撐該市場的主導地位和長期擴張。
目錄
第1章調查方法和範圍
第2章執行摘要
第3章業界考察
- 生態系分析
- 主要供應商和技術提供商
- 物流、配送和服務
- 監管環境
- 產業影響因素
- 促進要素
- 產業潛在風險與挑戰
- 成長潛力分析
- 波特五力分析
- PESTEL 分析
- 區域供冷系統的成本結構分析
- 區域價格趨勢分析
- 新的機會與趨勢
- 數位化和物聯網整合
- 案例研究分析—斯德哥爾摩綜合區域供熱冷凍系統
- 計劃概述
- 關鍵事實和數據
- 客戶區隔
- 支持區域供熱和製冷(DHC)的政策和獎勵
第4章 競爭情勢
- 介紹
- 按地區分類的公司市佔率分析
- 北美洲
- 歐洲
- 亞太地區
- 中東
- 世界其他地區
- 戰略儀錶板
- Key partnerships &collaborations
- Major M&A activities
- Product innovations &launches
- Market expansion strategies
- 策略舉措
- 競爭標竿分析
- 創新與科技趨勢
第5章 依製造技術分類的市場規模及預測(2022-2035年)
- 自然冷卻
- 吸收式製冷機
- 熱泵
- 電動冷凍機組
- 其他
第6章 依應用領域分類的市場規模及預測(2022-2035年)
- 住宅
- 商業的
- 學院和高等教育機構
- 辦公大樓
- 政府大樓
- 其他
- 產業
第7章 2022-2035年各地區市場規模及預測
- 北美洲
- 美國
- 加拿大
- 歐洲
- 德國
- 波蘭
- 瑞典
- 義大利
- 法國
- 芬蘭
- 奧地利
- 挪威
- 亞太地區
- 中國
- 日本
- 韓國
- 新加坡
- 馬來西亞
- 中東
- 沙烏地阿拉伯
- 阿拉伯聯合大公國
- 卡達
- 阿曼
- 科威特
- 巴林
- 世界其他地區
第8章:公司簡介
- ADC Energy Systems
- AtkinsRealis
- Cetetherm
- Danfoss
- DC Pro Engineering
- Emicool
- Emirates Central Cooling Systems Corporation PJSC
- ENGIE
- Fortum
- Goteborg Energi
- Helen
- Keppel
- LOGSTOR Denmark Holding
- Marafeq Qatar
- Pal Group
- Qatar District Cooling Company
- Ramboll Group
- Shinryo Corporation
- Siemens
- SP Group
- Stellar Energy
- Tabreed
- Vattenfall
- Veolia
- Wien Energie
The Global District Cooling Market was valued at USD 133.6 billion in 2025 and is estimated to grow at a CAGR of 4% to reach USD 200.2 billion by 2035.
Market growth is supported by accelerating urban development and rising demand for efficient space cooling across densely populated environments. Increasing focus on lowering energy consumption and carbon emissions in line with global sustainability objectives continues to strengthen industry momentum. District cooling systems operate through centralized production of chilled water that is distributed to multiple buildings via insulated networks, offering a highly efficient alternative to standalone cooling systems. These solutions support reduced electricity demand, improved load management, and lower environmental impact. Rising energy costs and the need for optimized thermal efficiency are driving preference for centralized cooling infrastructure. Integration of alternative energy sources and recovery technologies further enhances system performance and sustainability. Government-backed energy efficiency programs and green construction standards are supporting broader adoption. Continued investment in system upgrades, distribution expansion, and advanced thermal storage technologies is improving operational resilience and long-term cost efficiency, reinforcing steady market expansion worldwide.
| Market Scope | |
|---|---|
| Start Year | 2025 |
| Forecast Year | 2026-2035 |
| Start Value | $133.6 Billion |
| Forecast Value | $200.2 Billion |
| CAGR | 4% |
The electric chiller-based district cooling systems segment accounted for 47.1% share in 2025. Growth in this segment is driven by the rising deployment of high-capacity cooling equipment designed to support centralized infrastructure. Advancements in chiller efficiency, performance optimization, and intelligent control integration continue to strengthen adoption across large-scale cooling networks.
The commercial applications segment held 76.7% share in 2025 and is projected to reach USD 150 billion by 2035. Demand is driven by the need for reliable, energy-efficient cooling solutions that support large building clusters and comply with evolving efficiency standards. Increased automation and system optimization continue to support growth across commercial developments.
United States District Cooling Market held 90.5% share in 2025, generating USD 109 billion. Strong regulatory enforcement, adoption of energy-efficient cooling technologies, and high-density urban development continue to support market leadership and long-term expansion.
Key companies operating in the Global District Cooling Market include ENGIE, Tabreed, Danfoss, Siemens, Veolia, Keppel, Fortum, Vattenfall, Emirates Central Cooling Systems Corporation PJSC, LOGSTOR Denmark Holding, Ramboll Group, ADC Energy Systems, Cetetherm, Marafeq Qatar, Qatar District Cooling Company, Shinryo Corporation, SP Group, Helen, Goteborg Energi, Stellar Energy, Pal Group, Wien Energie, DC Pro Engineering, and AtkinsRealis. These players maintain strong market positions through integrated service capabilities and large-scale infrastructure expertise. To strengthen their presence in pharmaceutical and healthcare applications, district cooling providers focus on delivering highly reliable and uninterrupted cooling solutions that meet stringent operational and regulatory requirements. Companies invest in redundant system design, advanced monitoring, and predictive maintenance to ensure continuous temperature control, which is critical for healthcare environments. Strategic collaborations with healthcare infrastructure developers support early system integration.
Table of Contents
Chapter 1 Methodology & Scope
- 1.1 Research approach
- 1.2 Quality commitments
- 1.2.1 GMI AI policy & data integrity commitment
- 1.2.1.1 Source consistency protocol
- 1.2.1 GMI AI policy & data integrity commitment
- 1.3 Research trail & confidence scoring
- 1.3.1 Research trail components
- 1.3.2 Scoring components
- 1.4 Data collection
- 1.4.1 Partial list of primary sources
- 1.5 Data mining sources
- 1.5.1 Paid sources
- 1.5.1.1 Sources, by region
- 1.5.1 Paid sources
- 1.6 Base estimates and calculations
- 1.6.1 Base year calculation for any one approach
- 1.7 Market estimates & forecasts parameters
- 1.8 Forecast model
- 1.8.1 Quantified market impact analysis
- 1.8.1.1 Mathematical impact of growth parameters on forecast
- 1.8.1 Quantified market impact analysis
- 1.9 Research transparency addendum
- 1.9.1 Source attribution framework
- 1.9.2 Quality assurance metrics
- 1.9.3 Our commitment to trust
- 1.10 Market definitions
Chapter 2 Executive Summary
- 2.1 Industry synopsis, 2022 - 2035
- 2.2 Business trends
- 2.3 Production technique trends
- 2.4 Application trends
- 2.5 Regional trends
Chapter 3 Industry Insights
- 3.1 Industry ecosystem analysis
- 3.1.1 Key suppliers and technology providers
- 3.1.2 Logistics, distribution, and services
- 3.2 Regulatory landscape
- 3.3 Industry impact forces
- 3.3.1 Growth drivers
- 3.3.2 Industry pitfalls & challenges
- 3.4 Growth potential analysis
- 3.5 Porter's analysis
- 3.5.1 Bargaining power of suppliers
- 3.5.2 Bargaining power of buyers
- 3.5.3 Threat of new entrants
- 3.5.4 Threat of substitutes
- 3.6 PESTEL analysis
- 3.6.1 Political factors
- 3.6.2 Economic factors
- 3.6.3 Social factors
- 3.6.4 Technological factors
- 3.6.5 Legal factors
- 3.6.6 Environmental factors
- 3.7 Cost structure analysis of district cooling system
- 3.8 Price trend analysis, by region
- 3.9 Emerging opportunities & trends
- 3.10 Digitalization and IoT integration
- 3.11 Case study analysis - Integrated DHC system in Stockholm
- 3.11.1 Project overview
- 3.11.2 Key facts & figures
- 3.11.3 Customer segmentation
- 3.11.4 Policies & incentives supporting the DHC
Chapter 4 Competitive Landscape, 2026
- 4.1 Introduction
- 4.2 Company market share analysis, by region, 2025
- 4.2.1 North America
- 4.2.2 Europe
- 4.2.3 Asia Pacific
- 4.2.4 Middle East
- 4.2.5 Rest of World
- 4.3 Strategic dashboard
- 4.3.1 Key partnerships & collaborations
- 4.3.2 Major M&A activities
- 4.3.3 Product innovations & launches
- 4.3.4 Market expansion strategies
- 4.4 Strategic initiatives
- 4.5 Competitive benchmarking
- 4.6 Innovation & technology landscape
Chapter 5 Market Size and Forecast, By Production Technique, 2022 - 2035 (USD Million & TJ)
- 5.1 Key trends
- 5.2 Free cooling
- 5.3 Absorption cooling
- 5.4 Heat pumps
- 5.5 Electric chillers
- 5.6 Others
Chapter 6 Market Size and Forecast, By Application, 2022 - 2035 (USD Million & TJ)
- 6.1 Key trends
- 6.2 Residential
- 6.3 Commercial
- 6.3.1 College/university
- 6.3.2 Office building
- 6.3.3 Government building
- 6.3.4 Others
- 6.4 Industrial
Chapter 7 Market Size and Forecast, By Region, 2022 - 2035 (USD Million & TJ)
- 7.1 Key trends
- 7.2 North America
- 7.2.1 U.S.
- 7.2.2 Canada
- 7.3 Europe
- 7.3.1 Germany
- 7.3.2 Poland
- 7.3.3 Sweden
- 7.3.4 Italy
- 7.3.5 France
- 7.3.6 Finland
- 7.3.7 Austria
- 7.3.8 Norway
- 7.4 Asia Pacific
- 7.4.1 China
- 7.4.2 Japan
- 7.4.3 South Korea
- 7.4.4 Singapore
- 7.4.5 Malaysia
- 7.5 Middle East
- 7.5.1 Saudi Arabia
- 7.5.2 UAE
- 7.5.3 Qatar
- 7.5.4 Oman
- 7.5.5 Kuwait
- 7.5.6 Bahrain
- 7.6 Rest of World
Chapter 8 Company Profiles
- 8.1 ADC Energy Systems
- 8.2 AtkinsRealis
- 8.3 Cetetherm
- 8.4 Danfoss
- 8.5 DC Pro Engineering
- 8.6 Emicool
- 8.7 Emirates Central Cooling Systems Corporation PJSC
- 8.8 ENGIE
- 8.9 Fortum
- 8.10 Goteborg Energi
- 8.11 Helen
- 8.12 Keppel
- 8.13 LOGSTOR Denmark Holding
- 8.14 Marafeq Qatar
- 8.15 Pal Group
- 8.16 Qatar District Cooling Company
- 8.17 Ramboll Group
- 8.18 Shinryo Corporation
- 8.19 Siemens
- 8.20 SP Group
- 8.21 Stellar Energy
- 8.22 Tabreed
- 8.23 Vattenfall
- 8.24 Veolia
- 8.25 Wien Energie
 2026年全球區域供冷市場報告2026年全球數位雙胞胎區域供冷市場報告
 全球區域供冷市場規模、佔有率、趨勢和成長分析報告(2026-2034年)
 區域供冷市場-全球產業規模、佔有率、趨勢、機會、預測:按類型、最終用途產業、地區和競爭格局分類,2021-2031年區域供冷市場規模、佔有率、成長、全球產業分析:依類型和應用劃分、區域洞察和預測(2026-2034年)
 區域冷凍市場規模、佔有率、趨勢分析報告:按生產技術、應用、地區、細分市場預測,2025-2030 年
 2025-2029年全球區域冷凍市場
 區域冷凍市場規模、佔有率及成長分析(按生產技術、技術、所有權、冷卻介質、應用和地區)-2025-2032 年產業預測
 全球區域製冷市場:市場規模、市場佔有率、趨勢、行業分析(依應用、技術、服務類型、動力源和地區)、未來預測(2025-2034年)
 全球區域供冷市場:按生產技術、原料、應用、地區分類 - 到 2029 年的預測