


 |
市場調查報告書
商品編碼
1936565
解酒產品市場機會、成長要素、產業趨勢分析及2026年至2035年預測Hangover Cure Products Market Opportunity, Growth Drivers, Industry Trend Analysis, and Forecast 2026 - 2035 |
||||||
全球解酒產品市場預計到 2025 年價值 26 億美元,到 2035 年達到 113 億美元,年複合成長率為 16.4%。
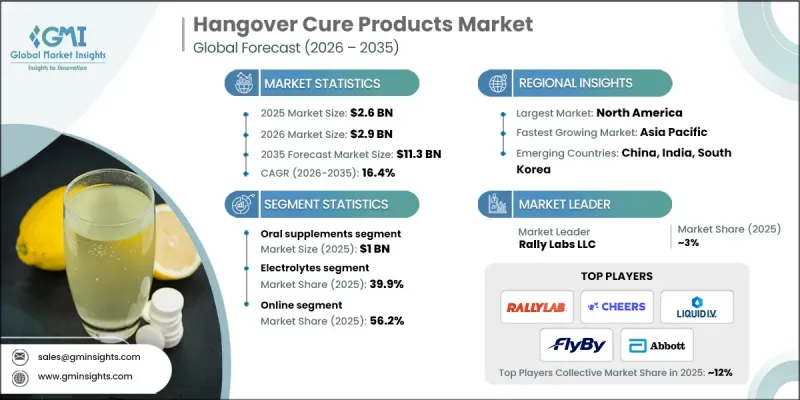
全球酒精消費量的成長,尤其是在年輕人群體中,是推動市場成長的關鍵因素。社會行為的改變、夜生活參與度的提高以及可支配收入的增加,都促使都市區和半都市區的社交飲酒頻率不斷上升。人們對酒精消費的文化態度轉變以及全球趨勢在開發中國家日益成長的影響,進一步擴大了消費群。隨著社交飲酒的日益普遍,人們對便利的解酒方案的需求也日益成長。同時,人們對個人健康和保健意識的提高,也促使他們對能夠緩解身體不適且不損害長期健康的保健產品產生興趣。消費者越來越傾向於選擇能夠預防和幫助復原的方案,以配合他們積極健康的生活方式,這將支撐解酒產品市場在預測期內的持續成長。
| 市場覆蓋範圍 | |
|---|---|
| 開始年份 | 2025 |
| 預測期 | 2026-2035 |
| 起始值 | 26億美元 |
| 預測金額 | 113億美元 |
| 複合年成長率 | 16.4% |
預計到2025年,口服保健品市場規模將達到10億美元,2026年至2035年的複合年成長率將達到17.1%。片劑和膠囊因其使用方便、劑量精準和便於攜帶等優點,繼續在該領域佔據主導地位。這些劑型因其符合忙碌的生活方式以及較長的保存期限而備受青睞,進一步鞏固了其強大的市場地位。
2025年,電解質產品市佔率達到39.9%,預計2026年至2035年將以17.3%的複合年成長率成長。電解質配方產品透過補充必需礦物質來支持體液平衡和恢復,因此被廣泛採用,成為尋求有效解酒方法的消費者的首選。
美國解酒產品市場預計到2025年將達到5億美元,2026年至2035年複合年成長率將達到15.8%。高酒精消費量、強烈的健康意識、完善的零售基礎設施以及功能性保健品的廣泛應用,持續支撐著該市場的領先地位。此外,美國發達的數位商業環境和高級產品定位也進一步推動了市場滲透。
目錄
第1章調查方法和範圍
第2章執行摘要
第3章業界考察
- 生態系分析
- 供應商情況
- 利潤率
- 每個階段的附加價值
- 影響價值鏈的因素
- 產業影響因素
- 促進要素
- 全球酒精消費量不斷成長
- 健康與保健意識
- 電子商務的擴張
- 挑戰與困難
- 監管和安全問題
- 激烈的競爭和對價格的敏感性
- 機會
- 形狀和成分方面的創新
- 新興市場的成長
- 促進要素
- 成長潛力分析
- 未來市場趨勢
- 科技與創新趨勢
- 當前技術趨勢
- 新興技術
- 價格趨勢
- 按地區
- 依產品
- 監管環境
- 北美洲
- 美國:消費品安全委員會(CPSC)聯邦法規(CFR)第16篇第1512部分
- 加拿大:國際標準化組織(ISO)4210
- 歐洲
- 德國:德國標準化協會 (DIN) 歐洲標準 (EN) ISO 4210
- 英國:歐洲標準 (EN) ISO 4210 /英國合格評定 (UKCA)
- 法國:歐洲標準 (EN) ISO 4210
- 亞太地區
- 中國:國家標準(GB)3565
- 印度:印度標準 (IS) 10613
- 日本:日本工業標準(JIS)D 9110
- 拉丁美洲
- 巴西:巴西技術標準協會 (ABNT) 巴西標準 (NBR) ISO 4210
- 墨西哥:國際標準化組織(ISO)4210
- 中東和非洲
- 南非:南非國家標準 (SANS) 311
- 沙烏地阿拉伯:沙烏地阿拉伯標準、計量和品質組織 (SASO) 海灣標準組織 (GSO) ISO 4210
- 北美洲
- 貿易統計(HS編碼-21069099)
- 主要進口國
- 主要出口國
- 波特五力分析
- PESTEL 分析
第4章 競爭情勢
- 介紹
- 公司市佔率分析
- 按地區
- 北美洲
- 歐洲
- 亞太地區
- 拉丁美洲
- 中東和非洲
- 按地區
- 企業矩陣分析
- 主要市場公司的競爭分析
- 競爭定位矩陣
- 重大進展
- 併購
- 夥伴關係與合作
- 新產品發布
- 擴張計劃
第5章 依產品類型分類的市場估算與預測,2022-2035年
- 口服補充劑
- 預防宿醉的飲料
- 粉末
- 修補
- 其他
第6章 依原料分類的市場估算與預測,2022-2035年
- 電解質
- 維他命
- 胺基酸
- 抗氧化劑
- 其他
7. 按配方分類的市場估計和預測,2022-2035 年
- 草藥
- 合成
第8章 按分銷管道分類的市場估算與預測,2022-2035年
- 線上
- 電子商務
- 公司網站
- 離線
- 藥局/藥局
- 超級市場/大賣場
- 專賣店
- 其他
第9章 2022-2035年各地區市場估算與預測
- 北美洲
- 美國
- 加拿大
- 歐洲
- 德國
- 英國
- 法國
- 義大利
- 西班牙
- 亞太地區
- 中國
- 印度
- 日本
- 韓國
- 澳洲
- 拉丁美洲
- 巴西
- 墨西哥
- 阿根廷
- 中東和非洲
- 沙烏地阿拉伯
- 阿拉伯聯合大公國
- 南非
第10章:公司簡介
- Abbott
- AfterDrink Ltd.
- Bayer AG
- Cheers Health
- DOTSHOT
- Drinkwel, LLC
- Flyby
- LES Labs
- Liquid IV, Inc.
- More Labs
- No Days Wasted
- Purple Tree Labs
- Rally Labs LLC
- The Himalaya Drug Company
- Toniiq
The Global Hangover Cure Products Market was valued at USD 2.6 billion in 2025 and is estimated to grow at a CAGR of 16.4% to reach USD 11.3 billion by 2035.
Rising alcohol consumption worldwide, particularly among younger adult populations, is a major factor contributing to market expansion. Shifts in social behavior, increased participation in nightlife activities, and greater disposable income levels are encouraging more frequent social drinking across urban and semi-urban regions. Changing cultural attitudes toward alcohol consumption and the growing influence of global lifestyle trends in developing economies are further expanding the consumer base. As social drinking becomes more common, demand is increasing for convenient solutions that help manage the aftereffects of alcohol intake. At the same time, heightened awareness around personal health and wellness is driving interest in functional products that address physical discomfort without compromising long-term well-being. Consumers increasingly seek preventive and recovery-focused options that align with active, health-conscious lifestyles, supporting sustained growth of the hangover cure products market throughout the forecast period.
| Market Scope | |
|---|---|
| Start Year | 2025 |
| Forecast Year | 2026-2035 |
| Start Value | $2.6 Billion |
| Forecast Value | $11.3 Billion |
| CAGR | 16.4% |
The oral supplements segment generated USD 1 billion in 2025 and is expected to grow at a CAGR of 17.1% from 2026 to 2035. Tablets and capsules continue to lead this segment due to their ease of use, accurate dosing, and portability. These formats fit well with fast-paced lifestyles and are favored for their longer shelf life and perceived reliability, reinforcing their strong market position.
The electrolytes segment held 39.9% share in 2025 and is projected to grow at a CAGR of 17.3% during 2026-2035. Electrolyte-based formulations are widely adopted because they support hydration balance and recovery by replenishing essential minerals, making them a preferred choice among consumers seeking effective hangover relief solutions.
US Hangover Cure Products Market generated USD 0.5 billion in 2025 and is expected to grow at a CAGR of 15.8% from 2026 to 2035. High alcohol consumption levels, strong wellness awareness, advanced retail infrastructure, and widespread adoption of functional supplements continue to support market leadership. The country's well-developed digital commerce ecosystem and premium product positioning further enhance market penetration.
Key companies operating in the Global Hangover Cure Products Market include Bayer AG, Abbott, Liquid I.V., Inc., The Himalaya Drug Company, Cheers Health, More Labs, Drinkwel, LLC, Rally Labs LLC, Flyby, DOTSHOT, No Days Wasted, Toniiq, Purple Tree Labs, AfterDrinkm Ltd., LES Labs, and Liquid I.V., Inc. Companies in the hangover cure products market strengthen their foothold by investing in research-driven formulations and clean-label ingredient profiles. Many brands focus on combining functional nutrition with scientifically supported ingredients to build consumer trust. Expanding digital marketing strategies and influencer partnerships helps increase brand visibility among younger demographics. Firms also emphasize convenient formats, premium positioning, and transparent labeling to attract health-conscious buyers. Strategic expansion across e-commerce and retail channels improves accessibility, while product diversification allows companies to address varying consumer preferences and usage occasions, supporting long-term market competitiveness.
Table of Contents
Chapter 1 Methodology & Scope
- 1.1 Market scope & definitions
- 1.2 Research design
- 1.2.1 Research approach
- 1.2.2 Data collection methods
- 1.3 Base estimates and calculations
- 1.3.1 Base year calculation
- 1.3.2 Market estimates & forecasts parameters
- 1.4 Forecast Model
- 1.4.1 Key trends for market estimates
- 1.4.2 Quantified market impact analysis
- 1.4.2.1 Mathematical impact of growth parameters on forecast
- 1.4.3 Scenario analysis framework
- 1.5 Primary research and validation
- 1.5.1 Some of the primary sources (but not limited to)
- 1.6 Data mining sources
- 1.6.1 Paid Sources
- 1.7 Primary research and validation
- 1.7.1 Primary sources
- 1.8 Research Trail & confidence scoring
- 1.8.1 Research trail components
- 1.8.2 Scoring components
- 1.9 Research transparency addendum
- 1.9.1 Source attribution framework
- 1.9.2 Quality assurance metrics
- 1.9.3 Our commitment to trust
- 1.10 Market Definitions
Chapter 2 Executive Summary
- 2.1 Industry 3600 synopsis
- 2.2 Key market trends
- 2.2.1 Regional
- 2.2.2 Product Type
- 2.2.3 Price range
- 2.2.4 End use
- 2.2.5 Distribution channels
- 2.3 CXO perspectives: Strategic imperatives
- 2.3.1 Key decision points for industry executives
- 2.3.2 Critical success factors for market players
- 2.4 Future outlook and strategic recommendations
Chapter 3 Industry Insights
- 3.1 Industry ecosystem analysis
- 3.1.1 Supplier landscape
- 3.1.2 Profit margin
- 3.1.3 Value addition at each stage
- 3.1.4 Factor affecting the value chain
- 3.2 Industry impact forces
- 3.2.1 Growth drivers
- 3.2.1.1 Rising alcohol consumption globally
- 3.2.1.2 Health & wellness awareness
- 3.2.1.3 E-commerce expansion
- 3.2.2 Pitfalls & Challenges
- 3.2.2.1 Regulatory & safety concerns
- 3.2.2.2 Intense competition & price sensitivity
- 3.2.3 Opportunities
- 3.2.3.1 Innovation in formats & ingredients
- 3.2.3.2 Emerging markets growth
- 3.2.1 Growth drivers
- 3.3 Growth potential analysis
- 3.4 Future market trends
- 3.5 Technology and innovation landscape
- 3.5.1 Current technological trends
- 3.5.2 Emerging technologies
- 3.6 Price trends
- 3.6.1 By region
- 3.6.2 By product
- 3.7 Regulatory landscape
- 3.7.1 North America
- 3.7.1.1 US: Consumer Product Safety Commission (CPSC) 16 Code of Federal Regulations (CFR) part 1512
- 3.7.1.2 Canada: International Organization for Standardization (ISO) 4210
- 3.7.2 Europe
- 3.7.2.1 Germany: Deutsches Institut fur Normung (DIN) European Norm (EN) ISO 4210
- 3.7.2.2 UK: European Norm (EN) ISO 4210 / United Kingdom Conformity Assessed (UKCA)
- 3.7.2.3 France: European Norm (EN) ISO 4210
- 3.7.3 Asia Pacific
- 3.7.3.1 China: Guobiao (GB) 3565
- 3.7.3.2 India: Indian Standard (IS) 10613
- 3.7.3.3 Japan: Japanese Industrial Standard (JIS) D 9110
- 3.7.4 Latin America
- 3.7.4.1 Brazil: Associacao Brasileira de Normas Tecnicas (ABNT) Norma Brasileira (NBR) ISO 4210
- 3.7.4.2 Mexico: International Organization for Standardization (ISO) 4210
- 3.7.5 Middle East & Africa
- 3.7.5.1 South Africa: South African National Standard (SANS) 311
- 3.7.5.2 Saudi Arabia: Saudi Standards, Metrology and Quality Organization (SASO) Gulf Standardization Organization (GSO) ISO 4210
- 3.7.1 North America
- 3.8 Trade statistics (HS Code - 21069099)
- 3.8.1 Major importing countries
- 3.8.2 Major exporting countries
- 3.9 Porter's analysis
- 3.10 PESTEL analysis
Chapter 4 Competitive Landscape, 2025
- 4.1 Introduction
- 4.2 Company market share analysis
- 4.2.1 By Region
- 4.2.1.1 North America
- 4.2.1.2 Europe
- 4.2.1.3 Asia Pacific
- 4.2.1.4 Latin America
- 4.2.1.5 Middle East & Africa
- 4.2.1 By Region
- 4.3 Company matrix analysis
- 4.4 Competitive analysis of major market players
- 4.5 Competitive positioning matrix
- 4.6 Key developments
- 4.6.1 Mergers & acquisitions
- 4.6.2 Partnerships & collaborations
- 4.6.3 New product launches
- 4.6.4 Expansion plans
Chapter 5 Market Estimates & Forecast, By Product Type, 2022 - 2035, (USD Billion) (Million Units)
- 5.1 Key trends
- 5.2 Oral supplements
- 5.3 Hangover drinks
- 5.4 Powder
- 5.5 Patches
- 5.6 Others
Chapter 6 Market Estimates & Forecast, By Ingredients, 2022 - 2035, (USD Billion) (Million Units)
- 6.1 Key trends
- 6.2 Electrolytes
- 6.3 Vitamins
- 6.4 Amino acids
- 6.5 Antioxidants
- 6.6 Others
Chapter 7 Market Estimates & Forecast, By Formulation, 2022 - 2035, (USD Billion) (Million Units)
- 7.1 Key trends
- 7.2 Herbal
- 7.3 Synthetic
Chapter 8 Market Estimates & Forecast, By Distribution Channel, 2022 - 2035, (USD Billion) (Million Units)
- 8.1 Key trends
- 8.2 Online
- 8.2.1 E-commerce
- 8.2.2 Company websites
- 8.3 Offline
- 8.3.1 Pharmacies/drugstores
- 8.3.2 Supermarkets/hypermarkets
- 8.3.3 Specialty stores
- 8.3.4 Others
Chapter 9 Market Estimates & Forecast, By Region, 2022 - 2035, (USD Billion) (Million Units)
- 9.1 Key trends
- 9.2 North America
- 9.2.1 U.S.
- 9.2.2 Canada
- 9.3 Europe
- 9.3.1 Germany
- 9.3.2 UK
- 9.3.3 France
- 9.3.4 Italy
- 9.3.5 Spain
- 9.4 Asia Pacific
- 9.4.1 China
- 9.4.2 India
- 9.4.3 Japan
- 9.4.4 South Korea
- 9.4.5 Australia
- 9.5 Latin America
- 9.5.1 Brazil
- 9.5.2 Mexico
- 9.5.3 Argentina
- 9.6 MEA
- 9.6.1 Saudi Arabia
- 9.6.2 UAE
- 9.6.3 South Africa
Chapter 10 Company Profiles
- 10.1 Abbott
- 10.2 AfterDrink Ltd.
- 10.3 Bayer AG
- 10.4 Cheers Health
- 10.5 DOTSHOT
- 10.6 Drinkwel, LLC
- 10.7 Flyby
- 10.8 LES Labs
- 10.9 Liquid I.V., Inc.
- 10.10 More Labs
- 10.11 No Days Wasted
- 10.12 Purple Tree Labs
- 10.13 Rally Labs LLC
- 10.14 The Himalaya Drug Company
- 10.15 Toniiq


