


 |
市場調查報告書
商品編碼
1936559
中空玻璃微球市場機會、成長要素、產業趨勢分析及預測(2026年至2035年)Hollow Glass Microspheres Market Opportunity, Growth Drivers, Industry Trend Analysis, and Forecast 2026 - 2035 |
||||||
全球空心玻璃微球市場預計到 2025 年將達到 25 億美元,預計到 2035 年將達到 38 億美元,年複合成長率為 4.4%。
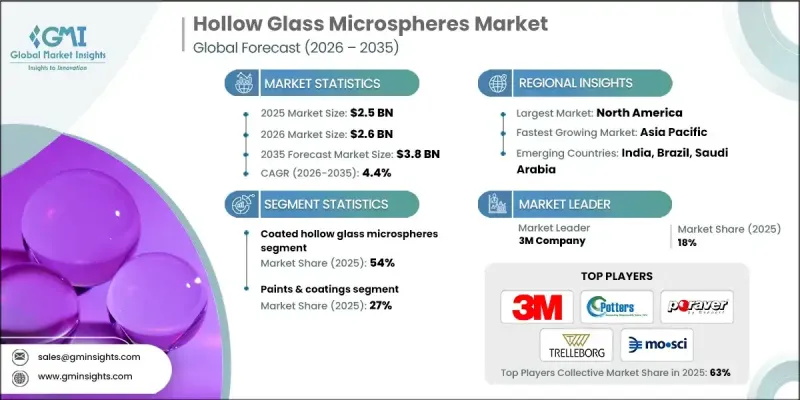
汽車和工業領域日益嚴格的燃油效率和排放氣體法規推動了市場成長。中空玻璃微球有助於減輕產品重量,從而提高車輛的燃油效率,並在其他應用中實現節能。在北美和歐洲,嚴格的二氧化碳法規和淨零排放舉措正在加速汽車製造商和材料供應商用輕質微球替代傳統礦物填充材。建築和基礎設施產業也做出了顯著貢獻,更嚴格的建築能效法規推動了微球在保溫板、塗料和密封劑中的應用,這些材料在不增加重量的情況下改善了熱管理性能。油漆、塗料和聚合物產業也擴大採用微球來降低揮發性有機化合物(VOC)含量、改善隔音效果,並實現輕質高性能產品。
| 市場覆蓋範圍 | |
|---|---|
| 開始年份 | 2025 |
| 預測年份 | 2026-2035 |
| 起始值 | 25億美元 |
| 預測金額 | 38億美元 |
| 複合年成長率 | 4.4% |
預計到2025年,塗層中空玻璃微球市場佔有率將達到54%,並在2035年之前以4.6%的複合年成長率成長。製造商正從簡單地供應預塗層微球轉向為環氧樹脂、聚氨酯、聚烯和特殊塗料等終端應用系統提供客製化解決方案。銀和鎳塗層主要用於提高導電性和電磁干擾屏蔽性能,而鋁和二氧化鈦塗層則可增強反射率和光學阻隔性能。客製化塗層使配方師能夠探索具有高技術潛力和性能要求的細分應用領域。
塗料和油漆領域佔市場佔有率的27%,預計到2035年將以4.8%的複合年成長率成長。中空玻璃微球可提高隔熱和隔音性能,同時降低產品密度,進而提高建築和運輸業的能源效率。汽車和基礎設施產業的終端用戶重視這些優勢,因為它們有助於節省燃料、提高營運效率並符合不斷變化的環境標準。
預計2034年,北美中空玻璃微球市場規模將達到11.9億美元。該地區市場成長的主要驅動力來自汽車行業的輕量化措施、節能建材以及複合材料在工業和商業領域的成熟應用。美國是核心需求中心,航太、汽車、建築塗料以及石油天然氣等產業推動了微球在合成泡沫、先進複合材料和高性能隔熱材料複合材料等領域的應用。強大的原始設備製造商(OEM)實力、不斷升級的工業基礎設施以及成熟的複合材料製造體系,鞏固了北美在該市場的主導地位。
目錄
第1章調查方法和範圍
第2章執行摘要
第3章業界考察
- 生態系分析
- 供應商情況
- 利潤率
- 每個階段的附加價值
- 影響價值鏈的因素
- 中斷
- 產業影響因素
- 促進要素
- 汽車和運輸業的減重
- 節能隔熱建築的需求
- 先進複合材料與3D列印技術的發展
- 產業潛在風險與挑戰
- 與傳統礦物填料相比,高成本
- 加工挑戰和研磨敏感性
- 市場機遇
- 電動車、航太和船舶領域的擴張
- 用於醫療、牙科和專用設備
- 促進要素
- 成長潛力分析
- 監管環境
- 北美洲
- 歐洲
- 亞太地區
- 拉丁美洲
- 中東和非洲
- 波特五力分析
- PESTEL 分析
- 價格趨勢
- 按地區
- 依產品類型
- 未來市場趨勢
- 科技與創新趨勢
- 當前技術趨勢
- 新興技術
- 專利狀態
- 貿易統計(HS編碼)(註:僅提供主要國家的貿易統計)
- 主要進口國
- 主要出口國
- 永續性和環境方面
- 永續努力
- 減少廢棄物策略
- 生產中的能源效率
- 環保舉措
- 考慮到碳足跡
第4章 競爭情勢
- 介紹
- 公司市佔率分析
- 按地區
- 北美洲
- 歐洲
- 亞太地區
- 拉丁美洲
- 中東和非洲
- 按地區
- 企業矩陣分析
- 主要市場公司的競爭分析
- 競爭定位矩陣
- 重大進展
- 併購
- 夥伴關係與合作
- 新產品發布
- 業務拓展計劃
第5章 依產品類型分類的市場估算與預測,2022-2035年
- 未包覆的中空玻璃微球
- 塗層中空玻璃微球
- 鍍銀中空玻璃微球
- 鍍鎳中空玻璃微球
- 鋁塗層中空玻璃微球
- 二氧化鈦包覆的中空玻璃微球
- 其他塗層中空玻璃微球
第6章 按應用領域分類的市場估算與預測,2022-2035年
- 油漆和塗料
- 工業塗料
- 船舶及防護塗料
- 汽車修補漆和原廠噴漆
- 建築和裝飾塗料
- 塑膠、複合材料和橡膠
- 熱塑性複合材料
- 熱固性複合材料(環氧樹脂、聚酯樹脂)
- 彈性體和橡膠製品
- 3D列印和特種塑膠
- 運輸
- 汽車(內裝、車身面板)
- 航太航太零件
- 鐵路和船舶結構
- 商用車和卡車零件
- 隔熱和浮力
- 保溫板和發泡體
- 海洋和水下浮力模組
- 管道和儲罐隔熱材料
- 低溫/LNG隔熱系統
- 衛生保健
- 醫療設備及組件
- 牙科材料和水泥
- 藥物輸送和緩釋系統
- 整形外科和義肢材料
- 其他(用途)
第7章 2022-2035年各地區市場估算與預測
- 北美洲
- 美國
- 加拿大
- 歐洲
- 德國
- 英國
- 法國
- 西班牙
- 義大利
- 其他歐洲地區
- 亞太地區
- 中國
- 印度
- 日本
- 澳洲
- 韓國
- 亞太其他地區
- 拉丁美洲
- 巴西
- 墨西哥
- 阿根廷
- 其他拉丁美洲地區
- 中東和非洲
- 沙烏地阿拉伯
- 南非
- 阿拉伯聯合大公國
- 其他中東和非洲地區
第8章:公司簡介
- Polysciences, Inc
- Sovitec
- Nova Instruments LLC
- Mo-Sci Corporation
- Geocon Products
- Kish Company Inc
- Cenostar Corporation
- Dennert Poraver Gmbh
- Ceno Technologies
- Potters Industries LLC
- Trelleborg AB
- Cospheric LLC
- 3M Company
The Global Hollow Glass Microspheres Market was valued at USD 2.5 billion in 2025 and is estimated to grow at a CAGR of 4.4% to reach USD 3.8 billion by 2035.
Market growth is driven by increasing pressure from fuel efficiency and emissions regulations across the automotive and industrial sectors. Hollow glass microspheres help reduce product weight, enhancing fuel efficiency in vehicles and promoting energy savings in other applications. In North America and Europe, stringent CO2 regulations and net-zero initiatives have motivated vehicle manufacturers and material suppliers to replace traditional mineral fillers with lightweight microspheres. The construction and infrastructure sectors have also contributed significantly, as stricter building energy efficiency regulations encourage the use of microspheres in insulation panels, coatings, and sealants to improve thermal regulation without adding weight. Paints, coatings, and polymer industries are increasingly using microspheres to reduce VOC content, improve acoustic insulation, and produce lightweight, high-performance products across applications.
| Market Scope | |
|---|---|
| Start Year | 2025 |
| Forecast Year | 2026-2035 |
| Start Value | $2.5 Billion |
| Forecast Value | $3.8 Billion |
| CAGR | 4.4% |
The coated hollow glass microspheres segment accounted for 54% share in 2025 and is expected to grow at a CAGR of 4.6% through 2035. Manufacturers are increasingly shifting from simply supplying coated microspheres to providing tailored solutions for end-use systems such as epoxy, polyurethane, polyolefin, and specialty-coated applications. Silver and nickel coatings are primarily targeted at electroconductive and EMI-shielding functions, while aluminum and titanium dioxide coatings enhance reflectivity and optical barrier properties. Custom coatings enable formulators to explore niche applications with high technological potential and performance requirements.
The paints and coatings segment held 27% share and is projected to grow at a CAGR of 4.8% by 2035. Hollow glass microspheres reduce product density while improving thermal and acoustic insulation, driving energy efficiency in construction and transport applications. End-users in automotive and infrastructure value these benefits for fuel savings, operational efficiency, and compliance with evolving environmental standards.
North America Hollow Glass Microspheres Market is estimated to reach USD 1.19 billion in 2034. Market growth in the region is fueled by lightweighting initiatives in automotive and energy-efficient building materials, as well as the established use of composites in industrial and commercial sectors. The U.S. serves as the core demand hub, with sectors including aerospace, automotive, construction coatings, and oil & gas driving microsphere adoption for syntactic foams, advanced composites, and high-performance insulation applications. Strong OEM presence, retrofitting of industrial infrastructure, and established composite manufacturing contribute to North America's leading market position.
Key players in the Global Hollow Glass Microspheres Market include Polysciences, Inc, Sovitec, Nova Instruments LLC, Mo-Sci Corporation, Geocon Products, Kish Company Inc, Cenostar Corporation, Dennert Poraver GmbH, Ceno Technologies, Potters Industries LLC, Trelleborg AB, Cospheric LLC, and 3M Company. Companies in the hollow glass microspheres market are employing several strategies to expand their footprint and strengthen market positioning. These include investing heavily in R&D to develop customized microspheres with specialized coatings for specific applications such as EMI shielding, reflectivity, and insulation. Manufacturers are forming strategic partnerships with polymer, automotive, and construction companies to integrate microspheres into advanced formulations. Market players are also expanding geographically to target emerging regions and leveraging digital marketing and technical service support to improve client engagement.
Table of Contents
Chapter 1 Methodology & Scope
- 1.1 Market scope and definition
- 1.2 Research design
- 1.2.1 Research approach
- 1.2.2 Data collection methods
- 1.3 Data mining sources
- 1.3.1 Global
- 1.3.2 Regional/Country
- 1.4 Base estimates and calculations
- 1.4.1 Base year calculation
- 1.4.2 Key trends for market estimation
- 1.5 Primary research and validation
- 1.5.1 Primary sources
- 1.6 Forecast model
- 1.7 Research assumptions and limitations
Chapter 2 Executive Summary
- 2.1 Industry 360° synopsis
- 2.2 Key market trends
- 2.2.1 Regional
- 2.2.2 Product Type
- 2.2.3 Application
- 2.3 TAM Analysis, 2026-2035
- 2.4 CXO perspectives: Strategic imperatives
- 2.4.1 Executive decision points
- 2.4.2 Critical success factors
- 2.5 Future Outlook and Strategic Recommendations
Chapter 3 Industry Insights
- 3.1 Industry ecosystem analysis
- 3.1.1 Supplier landscape
- 3.1.2 Profit margin
- 3.1.3 Value addition at each stage
- 3.1.4 Factor affecting the value chain
- 3.1.5 Disruptions
- 3.2 Industry impact forces
- 3.2.1 Growth drivers
- 3.2.1.1 Lightweighting in automotive and transportation
- 3.2.1.2 Demand for energy-efficient, insulated buildings
- 3.2.1.3 Growth of advanced composites and 3D printing
- 3.2.2 Industry pitfalls and challenges
- 3.2.2.1 Higher cost versus conventional mineral fillers
- 3.2.2.2 Processing challenges and crush sensitivity
- 3.2.3 Market opportunities
- 3.2.3.1 Expansion in EVs, aerospace and marine sectors
- 3.2.3.2 Use in medical, dental and specialty devices
- 3.2.1 Growth drivers
- 3.3 Growth potential analysis
- 3.4 Regulatory landscape
- 3.4.1 North America
- 3.4.2 Europe
- 3.4.3 Asia Pacific
- 3.4.4 Latin America
- 3.4.5 Middle East & Africa
- 3.5 Porter's analysis
- 3.6 PESTEL analysis
- 3.7 Price trends
- 3.7.1 By region
- 3.7.2 By Product type
- 3.8 Future market trends
- 3.9 Technology and Innovation landscape
- 3.9.1 Current technological trends
- 3.9.2 Emerging technologies
- 3.10 Patent Landscape
- 3.11 Trade statistics (HS code)( Note: the trade statistics will be provided for key countries only)
- 3.11.1 Major importing countries
- 3.11.2 Major exporting countries
- 3.12 Sustainability and environmental aspects
- 3.12.1 Sustainable practices
- 3.12.2 Waste reduction strategies
- 3.12.3 Energy efficiency in production
- 3.12.4 Eco-friendly initiatives
- 3.13 Carbon footprint consideration
Chapter 4 Competitive Landscape, 2025
- 4.1 Introduction
- 4.2 Company market share analysis
- 4.2.1 By region
- 4.2.1.1 North America
- 4.2.1.2 Europe
- 4.2.1.3 Asia Pacific
- 4.2.1.4 LATAM
- 4.2.1.5 MEA
- 4.2.1 By region
- 4.3 Company matrix analysis
- 4.4 Competitive analysis of major market players
- 4.5 Competitive positioning matrix
- 4.6 Key developments
- 4.6.1 Mergers & acquisitions
- 4.6.2 Partnerships & collaborations
- 4.6.3 New Product Launches
- 4.6.4 Expansion Plans
Chapter 5 Market Estimates and Forecast, By Product Type, 2022-2035 (USD Billion) (Kilo Tons)
- 5.1 Key trends
- 5.2 Uncoated hollow glass microspheres
- 5.3 Coated hollow glass microspheres
- 5.3.1 Silver-coated hollow glass microspheres
- 5.3.2 Nickel-coated hollow glass microspheres
- 5.3.3 Aluminum-coated hollow glass microspheres
- 5.3.4 Titanium dioxide-coated hollow glass microspheres
- 5.3.5 Other coated hollow glass microspheres
Chapter 6 Market Estimates and Forecast, By Application, 2022-2035 (USD Billion) (Kilo Tons)
- 6.1 Key trends
- 6.2 Paints & coatings
- 6.2.1 Industrial coatings
- 6.2.2 Marine and protective coatings
- 6.2.3 Automotive refinish and OEM coatings
- 6.2.4 Architectural and decorative paints
- 6.3 Plastics, composites & rubber
- 6.3.1 Thermoplastic composites
- 6.3.2 Thermoset composites (epoxy, polyester)
- 6.3.3 Elastomers and rubber products
- 6.3.4 3D printing and specialty plastics
- 6.4 Transportation
- 6.4.1 Automotive (interiors, body panels)
- 6.4.2 Aerospace and aviation components
- 6.4.3 Rail and marine structures
- 6.4.4 Commercial vehicle and truck parts
- 6.5 Insulation and buoyancy
- 6.5.1 Thermal insulation panels and foams
- 6.5.2 Buoyancy modules for offshore and subsea
- 6.5.3 Pipeline and tank insulation
- 6.5.4 Cryogenic and LNG insulation systems
- 6.6 Healthcare
- 6.6.1 Medical devices and components
- 6.6.2 Dental materials and cements
- 6.6.3 Drug delivery and controlled-release systems
- 6.6.4 Orthopedic and prosthetic composites
- 6.7 Others (applications)
Chapter 7 Market Estimates and Forecast, By Region, 2022-2035 (USD Billion) (Kilo Tons)
- 7.1 Key trends
- 7.2 North America
- 7.2.1 U.S.
- 7.2.2 Canada
- 7.3 Europe
- 7.3.1 Germany
- 7.3.2 UK
- 7.3.3 France
- 7.3.4 Spain
- 7.3.5 Italy
- 7.3.6 Rest of Europe
- 7.4 Asia Pacific
- 7.4.1 China
- 7.4.2 India
- 7.4.3 Japan
- 7.4.4 Australia
- 7.4.5 South Korea
- 7.4.6 Rest of Asia Pacific
- 7.5 Latin America
- 7.5.1 Brazil
- 7.5.2 Mexico
- 7.5.3 Argentina
- 7.5.4 Rest of Latin America
- 7.6 Middle East and Africa
- 7.6.1 Saudi Arabia
- 7.6.2 South Africa
- 7.6.3 UAE
- 7.6.4 Rest of Middle East and Africa
Chapter 8 Company Profiles
- 8.1 Polysciences, Inc
- 8.2 Sovitec
- 8.3 Nova Instruments LLC
- 8.4 Mo-Sci Corporation
- 8.5 Geocon Products
- 8.6 Kish Company Inc
- 8.7 Cenostar Corporation
- 8.8 Dennert Poraver Gmbh
- 8.9 Ceno Technologies
- 8.10 Potters Industries LLC
- 8.11 Trelleborg AB
- 8.12 Cospheric LLC
- 8.13 3M Company
 玻璃微球市場:2026-2032年全球市場預測(依產品類型、表面處理、尺寸範圍、終端用戶產業及通路分類)飛灰微球市場:依原料種類、形狀、純度等級、粒徑、應用及通路分類-2026-2032年全球市場預測
 2026-2034年全球發泡聚合物微球市場規模、佔有率、趨勢與成長分析報告
 微球市場規模、佔有率及成長分析(按產品、材料、應用及地區分類)-2026-2033年產業預測
 可膨脹微球:全球市場佔有率和排名、總收入和需求預測(2025-2031年)
 微球市場-全球產業規模、佔有率、趨勢、機會及預測,依原料、應用、區域及競爭狀況細分,2020-2030 年
 全球金屬微球市場
 聚合物微球:市場佔有率分析、產業趨勢、統計和成長預測(2025-2030)
 中空微球市場:2025-2029 年全球市場全球糖球市場規模(按產品、應用、地區、範圍和預測)