


 |
市場調查報告書
商品編碼
1936501
益生元纖維市場機會、成長要素、產業趨勢分析及預測(2026年至2035年)Prebiotic Fibers Market Opportunity, Growth Drivers, Industry Trend Analysis, and Forecast 2026 - 2035 |
||||||
全球益生元紡織品市場預計到 2025 年價值 62 億美元,到 2035 年達到 116 億美元,年複合成長率為 6.5%。
益生元纖維已從一種小眾補充劑轉變為日常食品和飲料中的主流功能性成分。製造商正在開發口味中性、穩定性高的配方,使其適用於添加到乳製品替代品、零食和飲料中,讓消費者能夠輕鬆地將益生元融入日常生活。個人化營養的興起進一步塑造了市場格局,促使企業開發針對特定腸道菌叢的益生元混合物,以支持腸道菌叢並順應數位化健康趨勢。益生元纖維不再只是一種功能性添加劑;它正日益被認為是維持消化系統健康的重要成分。潔淨標示、植物來源和強化食品的創新正在拓展其應用範圍,並推動全球消費者的參與。這種成長得益於健康意識的提高、可支配收入的增加以及支持膳食補充劑和機能性食品普及的法規結構。
| 市場覆蓋範圍 | |
|---|---|
| 開始年份 | 2025 |
| 預測年份 | 2026-2035 |
| 起始值 | 62億美元 |
| 預測金額 | 116億美元 |
| 複合年成長率 | 6.5% |
預計到 2025 年,菊糖市佔率將達到 39.4%,到 2035 年將以 7% 的複合年成長率成長。菊糖和寡果醣(FOS) 預計到 2025 年將佔益生元纖維市場總量的一半以上,這反映了其廣泛的接受度和功能性益處。
2025 年,顆粒劑製劑市佔率為 6.7%,價值 4.147 億美元。由於其精確的劑量控制、緩釋特性以及與低水分配方的相容性,這些劑型在點心棒、穀物和臨床營養產品中應用廣泛,因此備受青睞,並可靈活地融入機能性食品中。
預計到2025年,北美益生元纖維市場規模將達到23億美元,並在整個預測期內保持持續成長。消費者對腸道菌叢的高度關注、健康飲食習慣的養成以及對植物來源和潔淨標示產品的需求,是推動北美市場主導地位的主要因素。膳食補充劑和機能性食品監管的支持,以及嬰幼兒營養和強化食品領域的技術創新,正在進一步推動市場擴張。北美市場的成熟度,加上持續的研發活動,使其在益生元纖維的產品創新和消費者接受度方面都佔據關鍵地位。
目錄
第1章調查方法和範圍
第2章執行摘要
第3章業界考察
- 生態系分析
- 供應商情況
- 利潤率
- 每個階段的附加價值
- 影響價值鏈的因素
- 中斷
- 產業影響因素
- 促進要素
- 消費者對消化系統健康的日益關注正在推動對益生元纖維成分的需求。
- 人們對機能性食品食品和潔淨標示食品的偏好日益成長,正在推動益生元纖維的廣泛應用。
- 人們對預防醫學的興趣日益濃厚,導致改善腸道環境的成分每日攝取量增加。
- 產業潛在風險與挑戰
- 高劑量引起的胃腸道不適限制了消費者對某些益生元纖維的耐受性。
- 監管定義和健康聲明缺乏統一性,給製造商帶來不確定性。
- 與傳統纖維相比,成本較高使其競爭力下降。
- 市場機遇
- 低劑量、高活性益生元的研發消除了抗藥性擔憂。
- 個人化營養正在催生對標靶益生元纖維解決方案的需求。
- 拓展至動物營養領域,使應用範圍不限於人類消費。
- 促進要素
- 成長潛力分析
- 監管環境
- 北美洲
- 歐洲
- 亞太地區
- 拉丁美洲
- 中東和非洲
- 波特五力分析
- PESTEL 分析
- 價格趨勢
- 按地區
- 依產品類型
- 未來市場趨勢
- 科技與創新趨勢
- 當前技術趨勢
- 新興技術
- 專利狀態
- 貿易統計(HS編碼)
- 主要進口國
- 主要出口國
- 永續性和環境方面
- 永續努力
- 減少廢棄物策略
- 生產中的能源效率
- 環保舉措
- 考慮到碳足跡
第4章 競爭情勢
- 介紹
- 公司市佔率分析
- 按地區
- 北美洲
- 歐洲
- 亞太地區
- 拉丁美洲
- 中東和非洲
- 按地區
- 企業矩陣分析
- 主要市場公司的競爭分析
- 競爭定位矩陣
- 重大進展
- 併購
- 夥伴關係與合作
- 新產品發布
- 業務拓展計劃
第5章 依產品類型分類的市場估算與預測,2022-2035年
- 菊糖
- 寡果醣(FOS)
- 半乳寡糖(GOS)
- 人乳低聚醣(HMO)
- 抗解澱粉
- 木寡糖(XOS)
- 聚葡萄糖
- 乳果糖
- 抗性糊精
- 其他
第6章 按類型分類的市場估算與預測,2022-2035年
- 粉末
- 液體/糖漿
- 顆粒
- 膠囊/片劑
7. 按最終用戶分類的市場估計和預測,2022-2035 年
- 麵包糖果甜點
- 乳製品
- 飲料
- 穀物和點心棒
- 加工食品
- 營養補充品
- 嬰幼兒營養食品
- 臨床營養
- 製藥
- 家禽飼料
- 豬飼料
- 反芻動物飼料
- 水產養殖
- 寵物食品
第8章 2022-2035年各地區市場估算與預測
- 北美洲
- 美國
- 加拿大
- 歐洲
- 德國
- 英國
- 法國
- 西班牙
- 義大利
- 其他歐洲地區
- 亞太地區
- 中國
- 印度
- 日本
- 澳洲
- 韓國
- 亞太其他地區
- 拉丁美洲
- 巴西
- 墨西哥
- 阿根廷
- 其他拉丁美洲地區
- 中東和非洲
- 沙烏地阿拉伯
- 南非
- 阿拉伯聯合大公國
- 其他中東和非洲地區
第9章:公司簡介
- Archer Daniels Midland Company
- BENEO GmbH
- Cargill, Incorporated
- Royal FrieslandCampina NV
- Ingredion Incorporated
- International Flavors &Fragrances Inc.(IFF)
- Roquette Freres
- Sensus BV
- Tate &Lyle PLC
- Tereos Group
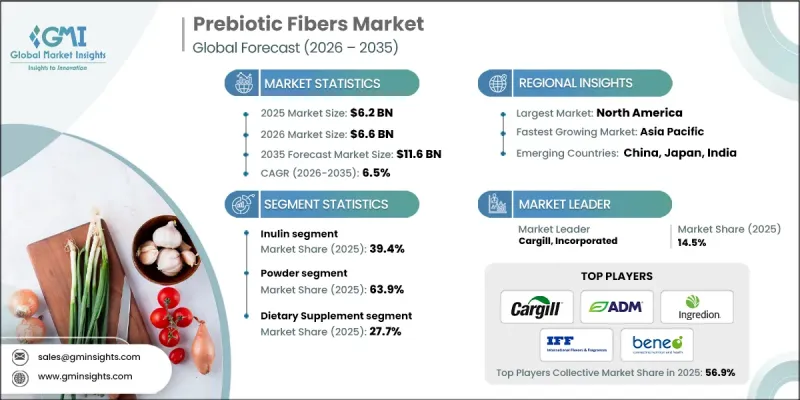
The Global Prebiotic Fibers Market was valued at USD 6.2 billion in 2025 and is estimated to grow at a CAGR of 6.5% to reach USD 11.6 billion by 2035.
Prebiotic fibers have transitioned from being a niche supplement to a mainstream functional ingredient in everyday food and beverage products. Manufacturers are developing neutral-tasting, stable formulations suitable for integration into dairy alternatives, snack foods, and beverages, allowing consumers to incorporate prebiotics seamlessly into daily routines. The rise of personalized nutrition is further shaping the market, with companies creating targeted prebiotic blends designed to support individual gut microbiomes and align with digital health trends. Prebiotic fibers are no longer just functional additives; they are increasingly recognized as essential components for maintaining digestive wellness. Innovations in clean-label, plant-based, and fortifiable foods are expanding the applications and driving consumer engagement globally. This growth is supported by rising health consciousness, increased disposable income, and regulatory frameworks encouraging dietary supplement and functional food adoption.
| Market Scope | |
|---|---|
| Start Year | 2025 |
| Forecast Year | 2026-2035 |
| Start Value | $6.2 Billion |
| Forecast Value | $11.6 Billion |
| CAGR | 6.5% |
The inulin segment held a 39.4% share in 2025 and is expected to grow at a CAGR of 7% through 2035. Inulin, together with fructooligosaccharides (FOS), represents over half of the total prebiotic fiber market by 2025, reflecting their broad acceptance and functional benefits.
The granular formulations segment accounted for 6.7% share, valued at USD 414.7 million in 2025. These formats are favored for applications in snack bars, cereals, and clinical nutrition products due to their precise dosing capabilities, controlled release properties, and compatibility with low-moisture formulations, enabling versatile integration into functional foods.
North America Prebiotic Fibers Market reached USD 2.3 billion in 2025 and is poised for sustained growth over the forecast period. High consumer awareness about the gut microbiome, health-conscious eating habits, and demand for plant-based and clean-label products underpin this leadership. Regulatory support for dietary supplements and functional foods, along with innovations in baby nutrition and fortified products, further enhances market expansion. The region's maturity, combined with ongoing research and development activities, positions it as a hub for both product innovation and consumer adoption of prebiotic fibers.
Key companies operating in the Global Prebiotic Fibers Market include Archer Daniels Midland Company, Cargill, Incorporated, Royal FrieslandCampina N.V., Tate & Lyle PLC, BENEO GmbH, Ingredion Incorporated, Roquette Freres, International Flavors & Fragrances Inc. (IFF), Sensus BV, and Tereos Group. Companies in the prebiotic fibers market strengthen their market position through several strategic approaches. Product innovation remains central, with firms developing neutral-taste, stable prebiotic formulations for diverse food and beverage applications. Expanding into personalized nutrition solutions allows them to cater to individual gut health needs. Strategic collaborations with food manufacturers, retailers, and healthcare providers enhance distribution reach and brand visibility. Investments in R&D and clinical validation support efficacy claims, building consumer trust. Companies also focus on geographic expansion into emerging markets with growing health awareness. Emphasis on sustainable sourcing and clean-label production practices enhances brand reputation and meets evolving regulatory requirements. Marketing campaigns highlighting digestive wellness benefits further reinforce consumer adoption and loyalty.
Table of Contents
Chapter 1 Methodology & Scope
- 1.1 Research approach
- 1.2 Quality Commitments
- 1.2.1 GMI AI policy & data integrity commitment
- 1.2.1.1 Source consistency protocol
- 1.2.1 GMI AI policy & data integrity commitment
- 1.3 Research Trail & Confidence Scoring
- 1.3.1 Research Trail Components
- 1.3.2 Scoring Components
- 1.4 Data Collection
- 1.4.1 Partial list of primary sources
- 1.5 Data mining sources
- 1.5.1 Paid sources
- 1.5.1.1 Sources, by region
- 1.5.1 Paid sources
- 1.6 Base estimates and calculations
- 1.6.1 Base year calculation for any one approach
- 1.7 Forecast model
- 1.7.1 Quantified market impact analysis
- 1.7.1.1 Mathematical impact of growth parameters on forecast
- 1.7.1 Quantified market impact analysis
- 1.8 Research transparency addendum
- 1.8.1 Source attribution framework
- 1.8.2 Quality assurance metrics
- 1.8.3 Our commitment to trust
Chapter 2 Executive Summary
- 2.1 Industry 360° synopsis
- 2.2 Key market trends
- 2.2.1 Regional
- 2.2.2 Product Type
- 2.2.3 Form
- 2.2.4 End User
- 2.3 TAM Analysis, 2025-2034
- 2.4 CXO perspectives: Strategic imperatives
- 2.4.1 Executive decision points
- 2.4.2 Critical success factors
- 2.5 Future Outlook and Strategic Recommendations
Chapter 3 Industry Insights
- 3.1 Industry ecosystem analysis
- 3.1.1 Supplier landscape
- 3.1.2 Profit margin
- 3.1.3 Value addition at each stage
- 3.1.4 Factor affecting the value chain
- 3.1.5 Disruptions
- 3.2 Industry impact forces
- 3.2.1 Growth drivers
- 3.2.1.1 Increasing consumer focus on digestive wellness is driving demand for prebiotic fiber ingredients.
- 3.2.1.2 Rising preference for functional and clean-label foods supports wider prebiotic fiber incorporation.
- 3.2.1.3 Growing emphasis on preventive healthcare encourages routine consumption of gut-health ingredients.
- 3.2.2 Industry pitfalls and challenges
- 3.2.2.1 Gastrointestinal discomfort at higher doses limits consumer tolerance of certain prebiotic fibers.
- 3.2.2.2 Inconsistent regulatory definitions and health claims create uncertainty for manufacturers.
- 3.2.2.3 Higher costs compared to conventional fibers reduce price competitiveness.
- 3.2.3 Market opportunities
- 3.2.3.1 Development of low-dose, high-efficacy prebiotics addresses tolerance concerns.
- 3.2.3.2 Personalized nutrition creates demand for targeted prebiotic fiber solutions.
- 3.2.3.3 Expansion into animal nutrition broadens applications beyond human consumption.
- 3.2.1 Growth drivers
- 3.3 Growth potential analysis
- 3.4 Regulatory landscape
- 3.4.1 North America
- 3.4.2 Europe
- 3.4.3 Asia Pacific
- 3.4.4 Latin America
- 3.4.5 Middle East & Africa
- 3.5 Porter's analysis
- 3.6 PESTEL analysis
- 3.7 Price trends
- 3.7.1 By region
- 3.7.2 By product type
- 3.8 Future market trends
- 3.9 Technology and Innovation landscape
- 3.9.1 Current technological trends
- 3.9.2 Emerging technologies
- 3.10 Patent Landscape
- 3.11 Trade statistics (HS code)
- 3.11.1 Major importing countries
- 3.11.2 Major exporting countries
- 3.12 Sustainability and environmental aspects
- 3.12.1 Sustainable practices
- 3.12.2 Waste reduction strategies
- 3.12.3 Energy efficiency in production
- 3.12.4 Eco-friendly initiatives
- 3.13 Carbon footprint consideration
Chapter 4 Competitive Landscape, 2025
- 4.1 Introduction
- 4.2 Company market share analysis
- 4.2.1 By region
- 4.2.1.1 North America
- 4.2.1.2 Europe
- 4.2.1.3 Asia Pacific
- 4.2.1.4 LATAM
- 4.2.1.5 MEA
- 4.2.1 By region
- 4.3 Company matrix analysis
- 4.4 Competitive analysis of major market players
- 4.5 Competitive positioning matrix
- 4.6 Key developments
- 4.6.1 Mergers & acquisitions
- 4.6.2 Partnerships & collaborations
- 4.6.3 New Product Launches
- 4.6.4 Expansion Plans
Chapter 5 Market Estimates and Forecast, By Product Type, 2022-2035 (USD Billion) (Kilo Tons)
- 5.1 Key trends
- 5.2 Inulin
- 5.3 Fructooligosaccharides (FOS)
- 5.4 Galactooligosaccharides (GOS)
- 5.5 Human Milk Oligosaccharides (HMOs)
- 5.6 Resistant Starch
- 5.7 Xylooligosaccharides (XOS)
- 5.8 Polydextrose
- 5.9 Lactulose
- 5.10 Resistant Dextrin
- 5.11 Others
Chapter 6 Market Estimates and Forecast, By Form, 2022-2035 (USD Billion) (Kilo Tons)
- 6.1 Key trends
- 6.2 Powder
- 6.3 Liquid/Syrup
- 6.4 Granules
- 6.5 Capsules/Tablets
Chapter 7 Market Estimates and Forecast, By End User, 2022-2035 (USD Billion) (Kilo Tons)
- 7.1 Key trends
- 7.2 Bakery & Confectionery
- 7.3 Dairy Products
- 7.4 Beverages
- 7.5 Cereals & Snack Bars
- 7.6 Processed Foods
- 7.7 Dietary Supplements
- 7.8 Infant Nutrition
- 7.9 Clinical Nutrition
- 7.10 Pharmaceuticals
- 7.11 Poultry Feed
- 7.12 Swine Feed
- 7.13 Ruminant Feed
- 7.14 Aquaculture
- 7.15 Pet Food
Chapter 8 Market Estimates and Forecast, By Region, 2022-2035 (USD Billion) (Kilo Tons)
- 8.1 Key trends
- 8.2 North America
- 8.2.1 U.S.
- 8.2.2 Canada
- 8.3 Europe
- 8.3.1 Germany
- 8.3.2 UK
- 8.3.3 France
- 8.3.4 Spain
- 8.3.5 Italy
- 8.3.6 Rest of Europe
- 8.4 Asia Pacific
- 8.4.1 China
- 8.4.2 India
- 8.4.3 Japan
- 8.4.4 Australia
- 8.4.5 South Korea
- 8.4.6 Rest of Asia Pacific
- 8.5 Latin America
- 8.5.1 Brazil
- 8.5.2 Mexico
- 8.5.3 Argentina
- 8.5.4 Rest of Latin America
- 8.6 Middle East and Africa
- 8.6.1 Saudi Arabia
- 8.6.2 South Africa
- 8.6.3 UAE
- 8.6.4 Rest of Middle East and Africa
Chapter 9 Company Profiles
- 9.1 Archer Daniels Midland Company
- 9.2 BENEO GmbH
- 9.3 Cargill, Incorporated
- 9.4 Royal FrieslandCampina N.V.
- 9.5 Ingredion Incorporated
- 9.6 International Flavors & Fragrances Inc. (IFF)
- 9.7 Roquette Freres
- 9.8 Sensus BV
- 9.9 Tate & Lyle PLC
- 9.10 Tereos Group
 膠纖維市場規模、佔有率和成長分析:按類型、原料、形態、功能、應用、分銷管道、最終用途和地區分類-2026-2033年產業預測
 2026年全球阻燃芳綸黏膠混紡纖維市場報告(防護纖維用)
 纖維到纖維回收技術市場預測至2034年-全球技術、纖維類型、原料、製程階段、輸出形式、應用、經營模式、最終用戶與地區分析
 軍用克維拉市場規模、佔有率和成長分析:按產品類型、功能、最終用途產業、材料整合、銷售管道和地區分類-2026-2033年產業預測
 低熔點纖維:市場佔有率分析、產業趨勢與統計、成長預測(2026-2031 年)2026年全球益生元纖維市場報告益生元纖維市場預測至2034年:按類型、來源、形態、性質、功能、應用、最終用戶、分銷管道和地區分類的全球分析
 農業纖維產品市場:依產品類型、形態、最終用途及通路分類-2026-2032年全球預測高鍺摻雜光纖市場:按應用、光纖類型、最終用戶、分銷管道和技術分類的全球預測(2026-2032年)2026年全球低熔點纖維市場報告