


 |
市場調查報告書
商品編碼
1929005
汽車輪胎電子零售市場機會、成長促進因素、產業趨勢分析及預測(2026-2035)Automotive Tires E-Retailing Market Opportunity, Growth Drivers, Industry Trend Analysis, and Forecast 2026 - 2035 |
||||||
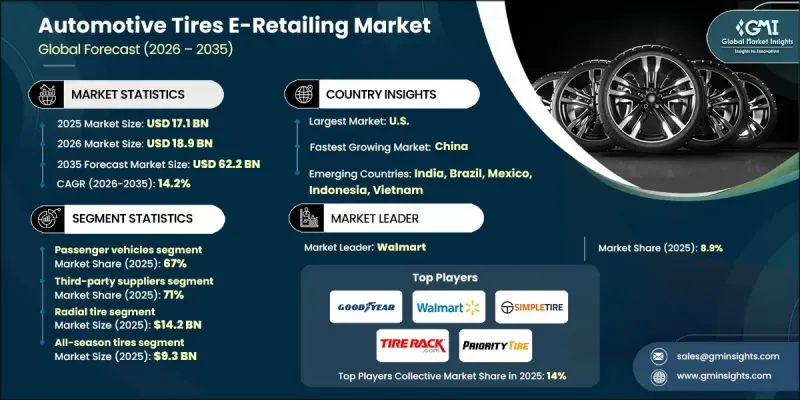
全球汽車輪胎電子零售市場預計到 2025 年將達到 171 億美元,到 2035 年將達到 622 億美元,年複合成長率為 14.2%。
市場成長正受到視覺和互動式數位商務工具在線上輪胎零售平台快速整合的影響。數位零售體驗日趨沉浸式,使客戶能夠在購買前更好地評估產品,並做出更自信、更明智的決策。這種轉變正在提升客戶參與,降低產品退貨率,並提高線上經銷商的轉換率。先進的數位展示室和配置工具的日益普及,使輪胎經銷商能夠在競爭激烈的市場環境中脫穎而出,同時提升整體客戶滿意度。專注於輪胎輪換週期、維護計劃和季節性使用模式的訂閱服務也在改變消費者的購買行為。這些模式使客戶能夠擺脫一次性購買,選擇靈活且經濟實惠的服務計劃。這種模式正受到追求便利性和可預測支出的用戶的青睞。預測分析技術透過基於使用數據實現最佳更換提案,進一步推動了這一發展,從而有助於提升客戶終身價值。人工智慧驅動的建議引擎持續影響購買決策,並正在重新定義消費者在線上購買輪胎的方式。
| 市場覆蓋範圍 | |
|---|---|
| 開始年份 | 2025 |
| 預測年份 | 2026-2035 |
| 起始值 | 171億美元 |
| 預測金額 | 622億美元 |
| 複合年成長率 | 14.2% |
預計到2025年,乘用車市場將佔據67%的市場佔有率,並在2026年至2035年間以14%的複合年成長率成長。不斷成長的車輛保有量和更長的車輛使用週期支撐了市場需求,並持續推動輪胎更換需求。由於便於價格比較、獲取用戶回饋以及簡化購買流程,線上平台越來越受到消費者的青睞。隨著越來越多的車輛運作時間延長,透過數位化管道購買替換輪胎的需求持續成長。消費者優先考慮便利性和速度,電商平台正透過簡化的流程和高效率的購買方式來滿足這些期望。
預計到2025年,第三方供應商將佔據71%的市場佔有率,並在2026年至2035年間以13.5%的複合年成長率成長。主導地位得益於涵蓋多個品牌、規格和價格範圍的豐富產品線。強大的採購網路和基於批量籌資策略使其能夠在保持性能和安全標準的同時,提供具有競爭力的價格。這種以價值為導向的提案符合線上購物者的期望,並持續鞏固其市場地位。
預計到2025年,美國汽車輪胎電商市場將佔據82%的市場佔有率,銷售額將達到40億美元。美國較高的汽車保有量和穩定的輪胎更換需求支撐著該國的線上輪胎銷售。消費者越來越傾向選擇產品種類豐富、價格優惠且提供宅配服務的線上管道。零售商則透過會員獎勵和靈活的數位支付解決方案進一步推動銷售成長,提升了產品的可負擔性和便利性。
目錄
第1章調查方法
第2章執行摘要
第3章業界考察
- 生態系分析
- 供應商情況
- 利潤率分析
- 成本結構
- 每個階段的附加價值
- 影響價值鏈的因素
- 中斷
- 產業影響因素
- 促進要素
- 擴大線上輪胎市場
- 消費者越來越傾向於直接面對消費者的銷售方式
- 汽車零售業數位化興起
- 消費者對便利性的偏好日益增強
- 產業潛在風險與挑戰
- 由於尺寸選擇錯誤導致退貨率高
- 購買前檢查實物的能力有限
- 對最後一公里物流和安裝人員的依賴
- 在線經銷商之間的價格競爭
- 市場機遇
- 基於人工智慧的輪胎推薦引擎
- 訂閱模式和輪胎即服務模式
- 電動車輪胎需求不斷成長
- 新興市場的擴張
- 與安裝商和服務網路建立合作關係
- 促進要素
- 成長潛力分析
- 監管環境
- 北美洲
- FMVSS - 聯邦機動車輛安全標準(輪胎)
- 加拿大車輛安全標準(CVSS)
- 歐洲
- UNECE R117/E 標誌認證
- EUDR-歐盟森林砍伐法規
- 輪胎標記法規(歐盟 2020/740)
- 亞太地區
- 輪胎中國強制產品認證(CCC)
- 生產者延伸責任制(EPR)
- 日本輪胎工業標準(JIS)
- 拉丁美洲
- INMETRO輪胎認證和標記系統
- IRAM/區域輪胎標準
- 車輛和輪胎符合歐洲標準
- 中東和非洲
- 具備RFID功能的輪胎識別標籤
- SASO輪胎性能和耐熱標準
- EPR輪胎回收/廢棄物管理標準
- 北美洲
- 波特分析
- PESTEL 分析
- 專利分析
- 科技與創新趨勢
- 當前技術趨勢
- 新興技術
- 價格趨勢
- 按地區
- 依產品
- 成本細分分析
- 生產統計
- 生產基地
- 進出口
- 主要進口國
- 永續性和環境方面
- 永續努力
- 減少廢棄物策略
- 生產中的能源效率
- 環保舉措
- 碳足跡考量
- 消費者購買過程與決策因素
- 關鍵線上決策參數(價格、評價、適用性工具)
- 人工智慧輪胎推薦引擎的作用
- 比較工具、使用者評論和評分的影響
- 付款方式偏好
- 未來市場展望與結構性變化
- 向全通路輪胎零售的轉型
- 訂閱輪胎服務的成長
- 加快製造商直接向消費者銷售的速度
- 電子零售平台整合展望
第4章 競爭情勢
- 介紹
- 公司市佔率分析
- 主要市場公司的競爭分析
- 競爭定位矩陣
- 戰略展望矩陣
- 重大進展
- 併購
- 夥伴關係與合作
- 新產品發布
- 企業擴張計畫和資金籌措
第5章 依輪胎類型分類的市場估計與預測,2022-2035年
- 全天候輪胎
- 夏季輪胎
- 冬季輪胎
- 其他
6. 按產品類型分類的市場估算與預測,2022-2035年
- 子午線輪胎
- 斜交輪胎
第7章 依車輛類型分類的市場估計與預測,2022-2035年
- 搭乘用車
- 掀背車
- 轎車
- SUV
- 商用車輛
- 輕型商用車(LCV)
- 中型商用車(MCV)
- 重型商用車(HCV)
第8章 按分銷管道分類的市場估算與預測,2022-2035年
- OEM
- 第三方供應商
第9章 依銷售模型分類的市場估計與預測,2022-2035年
- 直接面對消費者(D2C)
- 線上到線下 (O2O)
- 提供安裝服務的市場
第10章 2022-2034年各地區市場估計與預測
- 北美洲
- 美國
- 加拿大
- 歐洲
- 英國
- 德國
- 法國
- 義大利
- 西班牙
- 俄羅斯
- 丹麥
- 芬蘭
- 挪威
- 瑞典
- 亞太地區
- 中國
- 印度
- 日本
- 韓國
- ANZ
- 新加坡
- 泰國
- 印尼
- 越南
- 拉丁美洲
- 巴西
- 墨西哥
- 阿根廷
- 中東和非洲
- 南非
- 沙烏地阿拉伯
- 阿拉伯聯合大公國
第11章 公司簡介
- 世界公司
- Amazon Tires
- Costco Tires
- Discount Tire Direct
- Goodyear
- Pep Boys
- 山姆會員店輪胎
- SimpleTire
- Tire Rack
- TireBuyer
- Walmart Tires
- 該地區頂尖公司
- 4 Wheel Parts
- BJ輪胎中心
- BJ's Wholesale Club 輪胎
- Discounted Wheel Warehouse
- Fountain Tire
- Les Schwab Tires
- NTB(National Tire &Battery)
- Priority Tire
- Tire Kingdom
- Tires-easy.com
- 新興企業
- 123 Tire
- AlloTire
- BestOne Tire &Auto
- Blackcircles
- CarParts.com Tires
- Falken Tires Online
- Just Tires
- Oponeo
- Tyremarket
- WheelMax
The Global Automotive Tires E-Retailing Market was valued at USD 17.1 billion in 2025 and is estimated to grow at a CAGR of 14.2% to reach USD 62.2 billion by 2035.
Market growth is shaped by the rapid integration of visual and interactive digital commerce tools across online tire retail platforms. Digital retail experiences are becoming more immersive, allowing customers to better evaluate products before purchase and make informed decisions with higher confidence. This shift is improving engagement levels, lowering product return rates, and strengthening conversion performance for online sellers. The growing use of advanced digital showrooms and configuration tools is enabling tire sellers to differentiate themselves while improving overall customer satisfaction in a competitive landscape. Subscription-based offerings focused on tire replacement cycles, maintenance scheduling, and seasonal usage patterns are also reshaping purchasing behavior. These models allow customers to move away from one-time purchases in favor of flexible, cost-efficient service plans. The model is gaining traction among users seeking convenience and predictable expenses. Predictive analytics are further supporting this evolution by enabling retailers to recommend timely replacements based on usage data, supporting higher lifetime customer value. Artificial intelligence-driven recommendation engines continue to influence purchasing decisions and redefine how consumers approach online tire buying.
| Market Scope | |
|---|---|
| Start Year | 2025 |
| Forecast Year | 2026-2035 |
| Start Value | $17.1 Billion |
| Forecast Value | $62.2 Billion |
| CAGR | 14.2% |
The passenger vehicle segment held 67% share in 2025 and is forecast to grow at a CAGR of 14% from 2026 to 2035. Market demand is supported by rising vehicle ownership and longer vehicle usage cycles, which are driving consistent replacement needs. Online platforms are increasingly preferred due to ease of price comparison, access to user feedback, and simplified purchasing workflows. As more vehicles remain in operation for extended periods, demand for replacement tires through digital channels continues to rise. Consumers are prioritizing convenience and speed, and e-retailing platforms are meeting these expectations through streamlined access and purchasing efficiency.
The third-party suppliers segment held a 71% share in 2025 and is expected to grow at a CAGR of 13.5% from 2026 to 2035. Their leadership position is supported by broad product assortments covering multiple brands, specifications, and pricing tiers. These suppliers can offer competitive pricing while maintaining performance and safety standards due to strong procurement networks and volume-based sourcing strategies. This value-driven proposition aligns well with online buyer expectations and continues to reinforce their market presence.
United States Automotive Tires E-Retailing Market held 82% share in 2025, generating USD 4 billion. Strong vehicle ownership levels and consistent replacement demand are sustaining online tire sales across the country. Consumers are increasingly turning to digital channels that offer wide product availability, competitive pricing, and home delivery services. Retailers are further supporting sales momentum through loyalty incentives and flexible digital payment solutions that enhance affordability and convenience.
Key companies operating in the Global Automotive Tires E-Retailing Market include Tire Rack, Amazon, Walmart Tires, Discount Tire Direct, Goodyear, SimpleTire, Priority Tire, Pep Boys, Tires-easy, and NTB. These companies are actively shaping the competitive environment through platform innovation and service expansion. Companies in the automotive tires e-retailing market are reinforcing their competitive position through digital optimization, customer-centric services, and supply chain efficiency. Many players are investing in advanced data analytics to personalize recommendations and improve demand forecasting. Expanding private-label offerings and exclusive partnerships is helping improve margins and brand loyalty. Retailers are also enhancing fulfillment capabilities through faster delivery options and expanded installation networks. Subscription services and flexible payment plans are being used to encourage repeat purchases and long-term engagement.
Table of Contents
Chapter 1 Methodology
- 1.1 Research approach
- 1.2 Quality Commitments
- 1.2.1 GMI AI policy & data integrity commitment
- 1.2.1.1 Source consistency protocol
- 1.2.1 GMI AI policy & data integrity commitment
- 1.3 Research Trail & Confidence Scoring
- 1.3.1 Research Trail Components
- 1.3.2 Scoring Components
- 1.4 Data Collection
- 1.4.1 Partial list of primary sources
- 1.5 Data mining sources
- 1.5.1 Paid sources
- 1.5.1.1 Sources, by region
- 1.5.1 Paid sources
- 1.6 Base estimates and calculations
- 1.6.1 Base year calculation for any one approach
- 1.7 Forecast model
- 1.7.1 Quantified market impact analysis
- 1.7.1.1 Mathematical impact of growth parameters on forecast
- 1.7.1 Quantified market impact analysis
- 1.8 Research transparency addendum
- 1.8.1 Source attribution framework
- 1.8.2 Quality assurance metrics
- 1.8.3 Our commitment to trust
Chapter 2 Executive Summary
- 2.1 Industry 360° synopsis, 2022 - 2035
- 2.2 Key market trends
- 2.2.1 Regional
- 2.2.2 Tire
- 2.2.3 Manufacturing
- 2.2.4 Vehicle
- 2.2.5 Distribution channel
- 2.2.6 Sales model
- 2.3 TAM Analysis, 2026-2035
- 2.4 CXO perspectives: Strategic imperatives
- 2.4.1 Executive decision points
- 2.4.2 Critical success factors
- 2.5 Future outlook and strategic recommendations
- 2.6 Strategic recommendations
Chapter 3 Industry Insights
- 3.1 Industry ecosystem analysis
- 3.1.1 Supplier landscape
- 3.1.2 Profit margin analysis
- 3.1.3 Cost structure
- 3.1.4 Value addition at each stage
- 3.1.5 Factor affecting the value chain
- 3.1.6 Disruptions
- 3.2 Industry impact forces
- 3.2.1 Growth drivers
- 3.2.1.1 Expansion of online tire marketplaces
- 3.2.1.2 Rising preference for direct-to-consumer sales
- 3.2.1.3 Growing digitalization in automotive retail
- 3.2.1.4 Increased consumer preference for convenience
- 3.2.2 Industry pitfalls and challenges
- 3.2.2.1 High return rates due to incorrect size selection
- 3.2.2.2 Limited physical inspection before purchase
- 3.2.2.3 Dependence on last-mile logistics & installers
- 3.2.2.4 Price competition among online sellers
- 3.2.3 Market opportunities
- 3.2.3.1 AI-based tire recommendation engines
- 3.2.3.2 Subscription & tire-as-a-service models
- 3.2.3.3 Growth of EV-specific tire demand
- 3.2.3.4 Expansion in emerging markets
- 3.2.3.5 Partnerships with installers & service networks
- 3.2.1 Growth drivers
- 3.3 Growth potential analysis
- 3.4 Regulatory landscape
- 3.4.1 North America
- 3.4.1.1 FMVSS - Federal Motor Vehicle Safety Standards (Tires)
- 3.4.1.2 Canada Vehicle Safety Standards (CVSS)
- 3.4.2 Europe
- 3.4.2.1 UNECE R117 / E-Mark Certification
- 3.4.2.2 EUDR - EU Deforestation Regulation
- 3.4.2.3 Tyre Labelling Regulation (EU 2020/740)
- 3.4.3 Asia Pacific
- 3.4.3.1 China Compulsory Certification (CCC) for Tires
- 3.4.3.2 Extended Producer Responsibility (EPR)
- 3.4.3.3 Japan Industrial Standards (JIS) for Tires
- 3.4.4 Latin America
- 3.4.4.1 INMETRO Tire Certification & Labeling
- 3.4.4.2 IRAM / Local Tire Standards
- 3.4.4.3 Vehicle & Tire Relevance to Euro Standards
- 3.4.5 MEA
- 3.4.5.1 Tire Identification Labels with RFID
- 3.4.5.2 SASO Tire Performance & Heat Resistance Standards
- 3.4.5.3 EPR Tire Recycling / Waste Management Standards
- 3.4.1 North America
- 3.5 Porter';s analysis
- 3.6 PESTEL analysis
- 3.7 Patent analysis
- 3.8 Technology and innovation landscape
- 3.8.1 Current technological trends
- 3.8.2 Emerging technologies
- 3.9 Price trends
- 3.9.1 By region
- 3.9.2 By product
- 3.10 Cost breakdown analysis
- 3.11 Production statistics
- 3.11.1 Production hubs
- 3.11.2 Import and export
- 3.11.3 Major import countries
- 3.12 Sustainability and environmental aspects
- 3.12.1 Sustainable practices
- 3.12.2 Waste reduction strategies
- 3.12.3 Energy efficiency in production
- 3.12.4 Eco-friendly initiatives
- 3.12.5 Carbon footprint considerations
- 3.13 Consumer buying journey & decision factors
- 3.13.1 Key online decision parameters (price, reviews, fitment tools)
- 3.13.2 Role of AI-based tire recommendation engines
- 3.13.3 Comparison tools, user reviews, and ratings impact
- 3.13.4 Payment preferences
- 3.14 Future market outlook & structural shifts
- 3.14.1 Shift toward omnichannel tire retailing
- 3.14.2 Growth of subscription-based tire services
- 3.14.3 Direct OEM-to-consumer acceleration
- 3.14.4 Consolidation outlook among e-retail platforms
Chapter 4 Competitive Landscape, 2025
- 4.1 Introduction
- 4.2 Company market share analysis
- 4.2.1 North America
- 4.2.2 Europe
- 4.2.3 Asia Pacific
- 4.2.4 Latin America
- 4.2.5 MEA
- 4.3 Competitive analysis of major market players
- 4.4 Competitive positioning matrix
- 4.5 Strategic outlook matrix
- 4.6 Key developments
- 4.6.1 Mergers & acquisitions
- 4.6.2 Partnerships & collaborations
- 4.6.3 New product launches
- 4.6.4 Expansion plans and funding
Chapter 5 Market Estimates & Forecast, By Tire, 2022 - 2035 ($Mn & Units)
- 5.1 Key trends
- 5.2 All-season tires
- 5.3 Summer tires
- 5.4 Winter tires
- 5.5 Others
Chapter 6 Market Estimates & Forecast, By Manufacturing, 2022 - 2035 ($Mn & Units)
- 6.1 Key trends
- 6.2 Radial tire
- 6.3 Bias tire
Chapter 7 Market Estimates & Forecast, By Vehicle, 2022 - 2035 ($Mn & Units)
- 7.1 Key trends
- 7.2 Passenger car
- 7.2.1 Hatchback
- 7.2.2 Sedan
- 7.2.3 SUV
- 7.3 Commercial vehicle
- 7.3.1 Light commercial vehicle (LCV)
- 7.3.2 Medium commercial vehicle (MCV)
- 7.3.3 Heavy commercial vehicle (HCV)
Chapter 8 Market Estimates & Forecast, By Distribution Channel, 2022 - 2035 ($Mn & Units)
- 8.1 Key trends
- 8.2 OEM
- 8.3 Third-party suppliers
Chapter 9 Market Estimates & Forecast, By Sales Model, 2022 - 2035 ($Mn & Units)
- 9.1 Key trends
- 9.2 Direct-to-Consumer (D2C)
- 9.3 Online-to-Offline (O2O)
- 9.4 Marketplace with Installed Services
Chapter 10 Market Estimates & Forecast, By Region, 2022-2034 ($Mn, Units)
- 10.1 Key trends
- 10.2 North America
- 10.2.1 U.S.
- 10.2.2 Canada
- 10.3 Europe
- 10.3.1 UK
- 10.3.2 Germany
- 10.3.3 France
- 10.3.4 Italy
- 10.3.5 Spain
- 10.3.6 Russia
- 10.3.7 Denmark
- 10.3.8 Finland
- 10.3.9 Norway
- 10.3.10 Sweden
- 10.4 Asia Pacific
- 10.4.1 China
- 10.4.2 India
- 10.4.3 Japan
- 10.4.4 South Korea
- 10.4.5 ANZ
- 10.4.6 Singapore
- 10.4.7 Thailand
- 10.4.8 Indonesia
- 10.4.9 Vietnam
- 10.5 Latin America
- 10.5.1 Brazil
- 10.5.2 Mexico
- 10.5.3 Argentina
- 10.6 MEA
- 10.6.1 South Africa
- 10.6.2 Saudi Arabia
- 10.6.3 UAE
Chapter 11 Company Profiles
- 11.1 Global Players
- 11.1.1 Amazon Tires
- 11.1.2 Costco Tires
- 11.1.3 Discount Tire Direct
- 11.1.4 Goodyear
- 11.1.5 Pep Boys
- 11.1.6 Sam’s Club Tires
- 11.1.7 SimpleTire
- 11.1.8 Tire Rack
- 11.1.9 TireBuyer
- 11.1.10 Walmart Tires
- 11.2 Regional Champions
- 11.2.1. 4 Wheel Parts
- 11.2.2 BJ’s Tire Center
- 11.2.3 BJ’s Wholesale Club Tires
- 11.2.4 Discounted Wheel Warehouse
- 11.2.5 Fountain Tire
- 11.2.6 Les Schwab Tires
- 11.2.7 NTB (National Tire & Battery)
- 11.2.8 Priority Tire
- 11.2.9 Tire Kingdom
- 11.2.10 Tires-easy.com
- 11.3 Emerging Players
- 11.3.1. 123 Tire
- 11.3.2 AlloTire
- 11.3.3 BestOne Tire & Auto
- 11.3.4 Blackcircles
- 11.3.5 CarParts.com Tires
- 11.3.6 Falken Tires Online
- 11.3.7 Just Tires
- 11.3.8 Oponeo
- 11.3.9 Tyremarket
- 11.3.10 WheelMax
 2026-2030年全球汽車售後市場電子商務零售市場
 美國汽車經銷商:市場佔有率分析、行業趨勢和統計數據、成長預測(2026-2031 年)
 日本汽車零售市場規模、佔有率、趨勢和預測:按類型、車型、銷售管道和地區分類,2026-2034年
 按部署模式、車輛類型、銷售管道、動力系統、應用程式和最終用戶分類的汽車數位化經銷商整合平台市場,全球預測,2026-2032年汽車印刷基板連接器市場(按連接器類型、安裝類型、引腳數、額定電流、材質和應用分類)—2026-2032年全球預測汽車基板對板連接器市場:2026-2032年全球預測(按連接器類型、額定電流、間距、引腳數、安裝方式、絕緣材料、觸點鍍層和鎖定機制分類)汽車級闆對板連接器市場(按外形規格、間距、引腳數、額定電流、應用和最終用戶行業分類)—全球預測,2026-2032年汽車經銷商API解決方案市場(按經銷商類型、服務產品、動力傳動系統、客戶細分、經銷商規模、數位化整合和銷售管道分類),全球預測,2026-2032年汽車零售SaaS市場按解決方案類型、經營模式、車輛類型、部署模式和最終用戶分類,全球預測(2026-2032年)雲端原生汽車銷售平台市場(按組件、部署方式、最終用戶和銷售管道),全球預測(2026-2032)