


 |
市場調查報告書
商品編碼
1928968
吊扇市場機會、成長促進因素、產業趨勢分析及預測(2026-2035)Ceiling Fan Market Opportunity, Growth Drivers, Industry Trend Analysis, and Forecast 2026 - 2035 |
||||||
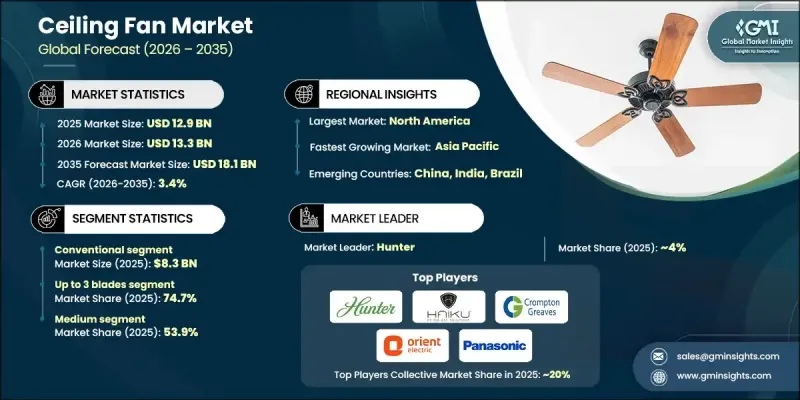
全球吊扇市場預計到 2025 年將達到 129 億美元,到 2035 年將達到 181 億美元,年複合成長率為 3.4%。
快速的城市發展和日益成長的住宅建設活動,尤其是在發展中地區,推動了市場成長。吊扇作為一種經濟實惠的降溫解決方案,尤其受到注重成本的家庭的青睞,相比其他高能耗的替代方案,吊扇更受歡迎。人們對節能和能源效率標準的日益重視正在改變產品開發和購買行為。節能馬達技術因其降低電力消耗的優勢而得到更廣泛的認可。同時,消費者對舒適性、便利性和現代設計的需求不斷成長,促使製造商將先進功能整合到新型號中。這些變化支撐了住宅和商業應用領域的穩定需求。雖然技術創新影響購買偏好,但價格和可靠性仍然是核心決定因素,市場在傳統需求和漸進式技術進步之間尋求平衡。
| 市場覆蓋範圍 | |
|---|---|
| 開始年份 | 2025 |
| 預測年份 | 2026-2035 |
| 起始值 | 129億美元 |
| 預測金額 | 181億美元 |
| 複合年成長率 | 3.4% |
傳統吊扇市場預計2025年將達到83億美元,2026年至2035年的複合年成長率將達到3.3%。該市場憑藉其低成本、可靠的性能和強大的消費者接受度,持續保持主導地位。在對價格敏感且冷卻需求簡單的地區,傳統吊扇設計因其易於維護和使用壽命長而備受歡迎。
預計2025年,三葉或三葉以下風扇將佔據74.7%的市場佔有率,預測期內複合年成長率(CAGR)為3.5%。這些型號的風扇因其高效的空氣循環和經濟實惠的性價比而廣受歡迎,因此對大眾市場和中端市場都具有吸引力。
美國吊扇市場預計到 2025 年將達到 13.8 億美元,從 2026 年到 2035 年的複合年成長率為 3%。吊扇是室內氣候控制的關鍵組成部分,廣泛應用於住宅和商業建築中,以提高空氣流通效率並有助於節能。
目錄
第1章調查方法和範圍
第2章執行摘要
第3章業界考察
- 生態系分析
- 供應商情況
- 利潤率
- 每個階段的附加價值
- 影響價值鏈的因素
- 產業影響因素
- 促進要素
- 都市化和住宅開發
- 能源效率和技術進步
- 可支配所得增加,生活水準提高
- 挑戰與困難
- 激烈的價格競爭
- 季節性需求波動
- 機會
- 智慧家庭整合
- 新興市場的出口潛力
- 促進要素
- 成長潛力分析
- 未來市場趨勢
- 科技與創新趨勢
- 當前技術趨勢
- 新興技術
- 價格趨勢
- 按地區
- 依產品
- 監管環境
- 北美洲
- 美國:消費品安全委員會(CPSC)聯邦法規(CFR)第16篇第1512部分
- 加拿大:國際標準化組織(ISO)4210
- 歐洲
- 德國:德國標準化協會 (DIN) 歐洲標準 (EN) ISO 4210
- 英國:歐洲標準 (EN) ISO 4210 /英國合格評定 (UKCA)
- 法國:歐洲標準 (EN) ISO 4210
- 亞太地區
- 中國:國家標準(GB)3565
- 印度:印度標準 (IS) 10613
- 日本:日本工業標準(JIS)D 9110
- 拉丁美洲
- 巴西:巴西技術標準協會 (ABNT) 巴西標準 (NBR) ISO 4210
- 墨西哥:國際標準化組織(ISO)4210
- 中東和非洲
- 南非:南非國家標準 (SANS) 311
- 沙烏地阿拉伯:沙烏地阿拉伯標準、計量和品質組織 (SASO) 海灣標準組織 (GSO) ISO 4210
- 北美洲
- 貿易統計(HS編碼-8414.51)
- 主要進口國
- 主要出口國
- 波特分析
- PESTEL 分析
第4章 競爭情勢
- 介紹
- 公司市佔率分析
- 按地區
- 北美洲
- 歐洲
- 亞太地區
- 拉丁美洲
- 中東和非洲
- 按地區
- 企業矩陣分析
- 主要市場公司的競爭分析
- 競爭定位矩陣
- 重大進展
- 併購
- 夥伴關係與合作
- 新產品發布
- 擴張計劃
第5章 依產品類型分類的市場估算與預測,2022-2035年
- 標準風扇
- 裝飾風扇
- 高速風扇
- 節能風扇
- 其他(戶外風扇、抱扇等)
第6章 按類型分類的市場估算與預測,2022-2035年
- 聰明的
- 傳統的
第7章 依葉片數量分類的市場估計與預測,2022-2035年
- 少於3張
- 4張
- 5張
- 超過5件
第8章 依葉片長度分類的市場估算與預測,2022-2035年
- 小於 20.9 英寸
- 21.0 至 36.9 英寸
- 37.0 至 52.9 英寸
- 53.0吋或以上
第9章 依價格區間分類的市場估計與預測,2022-2035年
- 低價位
- 中價位
- 高價位範圍
第10章 依最終用途分類的市場估計與預測,2022-2035年
- 住宅
- 商業的
- 產業
第11章 按分銷管道分類的市場估算與預測,2022-2035年
- 線上
- 離線
第12章 2022-2035年各地區市場估算與預測
- 北美洲
- 美國
- 加拿大
- 歐洲
- 德國
- 英國
- 法國
- 義大利
- 西班牙
- 亞太地區
- 中國
- 印度
- 日本
- 韓國
- 澳洲
- 拉丁美洲
- 巴西
- 墨西哥
- 阿根廷
- 中東和非洲
- 沙烏地阿拉伯
- 阿拉伯聯合大公國
- 南非
第13章:公司簡介
- Atomberg Technologies
- Bajaj Electricals
- Big Ass Fans
- Casablanca Fan Company
- Crompton Greaves
- Emerson Electric Co.
- Fanimation
- Havells
- Hunter Fan Company
- Minka Group
- Orient Electric
- Panasonic
- Risun Corp
- Usha International
- V-Guard
The Global Ceiling Fan Market was valued at USD 12.9 billion in 2025 and is estimated to grow at a CAGR of 3.4% to reach USD 18.1 billion by 2035.
Market growth is supported by rapid urban development and rising residential construction activity, particularly across developing regions. Ceiling fans continue to be favored as an economical cooling solution when compared with more energy-intensive alternatives, especially among cost-conscious households. Increasing focus on power conservation and efficiency standards is reshaping product development and purchasing behavior. Energy-saving motor technologies are gaining stronger acceptance due to their ability to reduce electricity consumption. At the same time, consumer interest in comfort, convenience, and modern design is encouraging manufacturers to integrate advanced functionality into newer models. These shifts are reinforcing steady demand across both residential and commercial applications. While innovation is influencing buying preferences, affordability and reliability remain core decision factors, allowing the market to balance traditional demand with gradual technological evolution.
| Market Scope | |
|---|---|
| Start Year | 2025 |
| Forecast Year | 2026-2035 |
| Start Value | $12.9 Billion |
| Forecast Value | $18.1 Billion |
| CAGR | 3.4% |
The conventional ceiling fan segment generated USD 8.3 billion in 2025 and is expected to grow at a CAGR of 3.3% from 2026 to 2035. This segment continues to lead due to its low cost, dependable performance, and strong acceptance among consumers. Traditional designs remain widely used in areas with basic cooling needs and high price sensitivity, where ease of maintenance and long product life are prioritized.
The fans with up to three blades accounted for 74.7% share in 2025 and are projected to grow at a CAGR of 3.5% during the forecast period. These models are widely preferred due to their balance between efficient air circulation and cost efficiency, making them attractive in both mass and mid-range markets.
U.S. Ceiling Fan Market reached USD 1.38 billion in 2025 and is expected to grow at a CAGR of 3% from 2026 to 2035. Ceiling fans remain an integral component of indoor climate management, commonly used to enhance airflow efficiency and support energy savings in residential and commercial settings.
Key companies operating in the Global Ceiling Fan Market include Hunter Fan Company, Havells, Crompton Greaves, Orient Electric, Bajaj Electricals, Panasonic, Big Ass Fans, Emerson Electric Co., Atomberg Technologies, Casablanca Fan Company, Fanimation, Minka Group, Usha International, V-Guard, and Risun Corp. Companies in the Global Ceiling Fan Market are strengthening their positions by focusing on energy-efficient technologies, product differentiation, and wider distribution reach. Many manufacturers are investing in advanced motor systems that reduce power consumption while improving performance. Design innovation and aesthetic customization are being used to appeal to modern consumers. Expanding presence across online and offline retail channels is helping brands improve accessibility. Strategic pricing across multiple product tiers allows companies to serve both premium and value-driven segments.
Table of Contents
Chapter 1 Methodology & Scope
- 1.1 Market scope & definitions
- 1.2 Research design
- 1.2.1 Research approach
- 1.2.2 Data collection methods
- 1.3 Base estimates and calculations
- 1.3.1 Base year calculation
- 1.3.2 Market estimates & forecasts parameters
- 1.4 Forecast Model
- 1.4.1 Key trends for market estimates
- 1.4.2 Quantified market impact analysis
- 1.4.2.1 Mathematical impact of growth parameters on forecast
- 1.4.3 Scenario analysis framework
- 1.5 Primary research and validation
- 1.5.1 Some of the primary sources (but not limited to)
- 1.6 Data mining sources
- 1.6.1 Paid Sources
- 1.7 Primary research and validation
- 1.7.1 Primary sources
- 1.8 Research Trail & confidence scoring
- 1.8.1 Research trail components
- 1.8.2 Scoring components
- 1.9 Research transparency addendum
- 1.9.1 Source attribution framework
- 1.9.2 Quality assurance metrics
- 1.9.3 Our commitment to trust
- 1.10 Market Definitions
Chapter 2 Executive Summary
- 2.1 Industry 360° synopsis
- 2.2 Key market trends
- 2.2.1 Regional
- 2.2.2 Product Type
- 2.2.3 Type
- 2.2.4 Number of blades
- 2.2.5 Blade length
- 2.2.6 Price range
- 2.2.7 End use
- 2.2.8 Distribution channels
- 2.3 CXO perspectives: Strategic imperatives
- 2.3.1 Key decision points for industry executives
- 2.3.2 Critical success factors for market players
- 2.4 Future outlook and strategic recommendations
Chapter 3 Industry Insights
- 3.1 Industry ecosystem analysis
- 3.1.1 Supplier landscape
- 3.1.2 Profit margin
- 3.1.3 Value addition at each stage
- 3.1.4 Factor affecting the value chain
- 3.2 Industry impact forces
- 3.2.1 Growth drivers
- 3.2.1.1 Urbanization and housing development
- 3.2.1.2 Energy efficiency and technological advancements
- 3.2.1.3 Rising disposable income and lifestyle upgrades
- 3.2.2 Pitfalls & Challenges
- 3.2.2.1 Intense price competition
- 3.2.2.2 Seasonal demand fluctuations
- 3.2.3 Opportunities
- 3.2.3.1 Smart home integration
- 3.2.3.2 Export potential in emerging markets
- 3.2.1 Growth drivers
- 3.3 Growth potential analysis
- 3.4 Future market trends
- 3.5 Technology and innovation landscape
- 3.5.1 Current technological trends
- 3.5.2 Emerging technologies
- 3.6 Price trends
- 3.6.1 By region
- 3.6.2 By product
- 3.7 Regulatory landscape
- 3.7.1 North America
- 3.7.1.1 US: Consumer Product Safety Commission (CPSC) 16 Code of Federal Regulations (CFR) part 1512
- 3.7.1.2 Canada: International Organization for Standardization (ISO) 4210
- 3.7.2 Europe
- 3.7.2.1 Germany: Deutsches Institut fur Normung (DIN) European Norm (EN) ISO 4210
- 3.7.2.2 UK: European Norm (EN) ISO 4210 / United Kingdom Conformity Assessed (UKCA)
- 3.7.2.3 France: European Norm (EN) ISO 4210
- 3.7.3 Asia Pacific
- 3.7.3.1 China: Guobiao (GB) 3565
- 3.7.3.2 India: Indian Standard (IS) 10613
- 3.7.3.3 Japan: Japanese Industrial Standard (JIS) D 9110
- 3.7.4 Latin America
- 3.7.4.1 Brazil: Associacao Brasileira de Normas Tecnicas (ABNT) Norma Brasileira (NBR) ISO 4210
- 3.7.4.2 Mexico: International Organization for Standardization (ISO) 4210
- 3.7.5 Middle East & Africa
- 3.7.5.1 South Africa: South African National Standard (SANS) 311
- 3.7.5.2 Saudi Arabia: Saudi Standards, Metrology and Quality Organization (SASO) Gulf Standardization Organization (GSO) ISO 4210
- 3.7.1 North America
- 3.8 Trade statistics (HS Code - 8414.51)
- 3.8.1 Major importing countries
- 3.8.2 Major exporting countries
- 3.9 Porter';s analysis
- 3.10 PESTEL analysis
Chapter 4 Competitive Landscape, 2025
- 4.1 Introduction
- 4.2 Company market share analysis
- 4.2.1 By Region
- 4.2.1.1 North America
- 4.2.1.2 Europe
- 4.2.1.3 Asia Pacific
- 4.2.1.4 Latin America
- 4.2.1.5 Middle East & Africa
- 4.2.1 By Region
- 4.3 Company matrix analysis
- 4.4 Competitive analysis of major market players
- 4.5 Competitive positioning matrix
- 4.6 Key developments
- 4.6.1 Mergers & acquisitions
- 4.6.2 Partnerships & collaborations
- 4.6.3 New product launches
- 4.6.4 Expansion plans
Chapter 5 Market Estimates & Forecast, By Product Type, 2022 - 2035, (USD Billion) (Million Units)
- 5.1 Key trends
- 5.2 Standard fan
- 5.3 Decorative fan
- 5.4 High-speed fan
- 5.5 Energy-saving fan
- 5.6 Others (outdoor fans, hugger fans, etc.)
Chapter 6 Market Estimates & Forecast, By Type, 2022 - 2035, (USD Billion) (Million Units)
- 6.1 Key trends
- 6.2 Smart
- 6.3 Conventional
Chapter 7 Market Estimates & Forecast, By Number of Blades, 2022 - 2035, (USD Billion) (Million Units)
- 7.1 Key trends
- 7.2 Up to 3
- 7.3 4
- 7.4 5
- 7.5 Above 5
Chapter 8 Market Estimates & Forecast, By Blade length, 2022 - 2035, (USD Billion) (Million Units)
- 8.1 Key trends
- 8.2 Up to 20.9 in
- 8.3 21.0 to 36.9 in
- 8.4 37.0 to 52.9 in
- 8.5 53.0 in & above
Chapter 9 Market Estimates & Forecast, By Price Range, 2022 - 2035, (USD Billion) (Million Units)
- 9.1 Key trends
- 9.2 Low
- 9.3 Medium
- 9.4 High
Chapter 10 Market Estimates & Forecast, By End Use, 2022 - 2035, (USD Billion) (Million Units)
- 10.1 Key trends
- 10.2 Residential
- 10.3 Commercial
- 10.4 Industrial
Chapter 11 Market Estimates & Forecast, By Distribution Channel, 2022 - 2035, (USD Billion) (Million Units)
- 11.1 Key trends
- 11.2 Online
- 11.3 Offline
Chapter 12 Market Estimates & Forecast, By Region, 2022 - 2035, (USD Billion) (Million Units)
- 12.1 Key trends
- 12.2 North America
- 12.2.1 U.S.
- 12.2.2 Canada
- 12.3 Europe
- 12.3.1 Germany
- 12.3.2 UK
- 12.3.3 France
- 12.3.4 Italy
- 12.3.5 Spain
- 12.4 Asia Pacific
- 12.4.1 China
- 12.4.2 India
- 12.4.3 Japan
- 12.4.4 South Korea
- 12.4.5 Australia
- 12.5 Latin America
- 12.5.1 Brazil
- 12.5.2 Mexico
- 12.5.3 Argentina
- 12.6 MEA
- 12.6.1 Saudi Arabia
- 12.6.2 UAE
- 12.6.3 South Africa
Chapter 13 Company Profiles
- 13.1 Atomberg Technologies
- 13.2 Bajaj Electricals
- 13.3 Big Ass Fans
- 13.4 Casablanca Fan Company
- 13.5 Crompton Greaves
- 13.6 Emerson Electric Co.
- 13.7 Fanimation
- 13.8 Havells
- 13.9 Hunter Fan Company
- 13.10 Minka Group
- 13.11 Orient Electric
- 13.12 Panasonic
- 13.13 Risun Corp
- 13.14 Usha International
- 13.15 V-Guard
 智慧吊扇市場-全球產業規模、佔有率、趨勢、機會、預測:按連接類型、應用、分銷管道、地區和競爭格局分類,2021-2031年無刷直流風扇市場 - 全球產業規模、佔有率、趨勢、機會、預測:按類型、最終用戶、風扇轉速、地區和競爭對手分類,2021-2031年
 無刷直流風扇:市場佔有率分析、產業趨勢與統計、成長預測(2026-2031)
 吊扇市場規模、佔有率、趨勢和預測:按產品類型、風扇尺寸、應用、銷售管道和地區分類,2026-2034年
 無刷直流風扇市場:依控制方式、產品類型、風量、額定功率、銷售管道及最終用途分類-2026-2032年全球市場預測智慧吊扇市場:2026-2032年全球預測(按馬達類型、連接技術、控制系統、產品類型、安裝類型、扇葉材質、最終用戶和分銷管道分類)天花板式集塵機市場:按集塵機類型、安裝方式、流量和最終用戶分類的全球預測,2026-2032年無刷直流軸流風扇市場:依葉片直徑、風量範圍、轉速、終端用戶產業、應用及銷售管道,全球預測,2026-2032年
 全球吊扇市場規模、佔有率、成長率、按類型和應用分類的全球產業分析、區域趨勢以及 2026-2034 年預測。日本吊扇市場規模、佔有率、趨勢及預測(按產品類型、風扇尺寸、分銷管道、最終用途和地區分類,2026-2034年)