

 |
市場調查報告書
商品編碼
1928952
遊戲相關產品市場機會、成長要素、產業趨勢分析及2026年至2035年預測Gaming Merchandise Market Opportunity, Growth Drivers, Industry Trend Analysis, and Forecast 2026 - 2035 |
||||||
全球遊戲周邊商品市場預計到 2025 年將達到 317 億美元,到 2035 年將達到 1976 億美元,年複合成長率為 20.5%。
這種快速成長反映了全球遊戲使用者群體的穩定擴張以及遊戲娛樂界文化影響力的不斷加深。隨著遊戲不斷融入日常生活,消費者的參與度也從互動體驗擴展到購買品牌實體產品。周邊產品已成為粉絲表達個人身分、品牌親和性和長期忠誠度的重要途徑。隨著遊戲在各個年齡層和地區被更廣泛地接受,與知名遊戲品牌相關的生活風格類產品的需求也不斷成長。隨著遊戲生態系統的日趨成熟,周邊產品的購買行為正從小眾活動演變為主流消費趨勢。不斷壯大的粉絲群、日益成長的數位曝光度以及對遊戲世界的強烈情感依戀,都支撐著這種持續的需求。在持續創新、不斷拓展的分銷網路和不斷擴大的全球影響力的支持下,遊戲相關周邊產品正轉型成為一個高成長的消費品類。
| 市場覆蓋範圍 | |
|---|---|
| 開始年份 | 2025 |
| 預測年份 | 2026-2035 |
| 起始值 | 317億美元 |
| 預測金額 | 1976億美元 |
| 複合年成長率 | 20.5% |
到2025年,服飾品類將成為最大的產品類別,市佔率將達到39.1%。消費者對品牌服飾和與遊戲文化相關的休閒服飾的濃厚興趣是推動此需求的主要因素。時尚的設計、品牌知名度和零售店的便利購買管道持續推動著服飾品類的普及,鞏固了其在市場上的主導地位。
預計到2025年,中價位市場將創造157億美元的收入。該市場憑藉其在價格和感知品質之間的最佳平衡,吸引了眾多消費者,並從中受益。這價位的產品符合主流消費者的購買習慣,並支撐著多個產品類別的穩定銷售。
預計到2025年,北美將以35.5%的市佔率引領區域遊戲周邊商品市場。強勁的消費者參與度、成熟的數位商務管道和強大的品牌知名度是推動市場需求的主要因素。該地區對能夠體現遊戲相關生活方式偏好的品牌商品持續保持著濃厚的興趣。
目錄
第1章調查方法和範圍
第2章執行摘要
第3章業界考察
- 生態系分析
- 供應商情況
- 利潤率
- 成本結構
- 每個階段的附加價值
- 影響價值鏈的因素
- 中斷
- 產業影響因素
- 促進要素
- 全球遊戲社群在PC、主機和行動平台方面迅速發展
- 電子競技聯賽和現場遊戲活動的擴展
- 粉絲對遊戲系列的濃厚興趣推動了對授權版和限量版產品的需求。
- 主播和遊戲網紅的影響力日益增強,正在加速產品認知度和直接面對消費者的銷售成長。
- 電子商務和線上市場的發展正在增加全球遊戲相關商品的供應量。
- 產業潛在風險與挑戰
- 高額的許可費和特許權使用費
- 新興市場零售店的匱乏限制了線下產品銷售。
- 市場機遇
- 將遊戲相關產品與時尚和生活風格品牌結合
- 對永續、環保遊戲服裝日益成長的需求為差異化提供了機會。
- 促進要素
- 成長潛力分析
- 監管環境
- 北美洲
- 歐洲
- 亞太地區
- 拉丁美洲
- 中東和非洲
- 波特分析
- PESTEL 分析
- 科技與創新趨勢
- 當前技術趨勢
- 新興技術
- 價格趨勢
- 歷史價格分析(2022-2024)
- 價格趨勢背後的因素
- 區域價格差異
- 價格預測(2026-2035)
- 定價策略
- 新興經營模式
- 合規要求
- 永續性措施
- 永續材料評估
- 碳足跡分析
- 採取循環經濟模式
- 永續性認證和標準
- 永續性投資報酬率分析
- 全球消費者心理分析
- 專利分析
第4章 競爭情勢
- 介紹
- 公司市佔率分析
- 按地區
- 北美洲
- 歐洲
- 亞太地區
- 拉丁美洲
- 中東和非洲
- 市場集中度分析
- 按地區
- 主要企業的競爭標竿分析
- 財務績效比較
- 收入
- 利潤率
- 研究與開發
- 產品系列比較
- 產品線的廣度
- 科技
- 創新
- 地理分佈比較
- 全球擴張分析
- 服務網路覆蓋
- 按地區分類的市場滲透率
- 競爭定位矩陣
- 領導企業
- 受讓人
- 追蹤者
- 小眾玩家
- 戰略展望矩陣
- 財務績效比較
- 2022-2025 年主要發展動態
- 併購
- 合作夥伴關係和合資企業
- 技術進步
- 擴張與投資策略
- 永續發展計劃
- 數位轉型計劃
- 新興/Start-Ups競賽的趨勢
第5章 2022-2035年按產品分類的市場估算與預測
- ,
- 服飾
- 配件
- 收藏品
- 遊戲周邊設備
- 居家裝飾
- 其他
第6章 依價格區間分類的市場估計與預測,2022-2035年
- 高階
- 中檔
- 低價位
7. 2022-2035年按分銷管道分類的市場估算與預測
- 線上
- 離線
第8章 2022-2035年各地區市場估算與預測
- 按地區
- 北美洲
- 美國
- 加拿大
- 歐洲
- 英國
- 德國
- 法國
- 義大利
- 西班牙
- 俄羅斯
- 其他歐洲地區
- 亞太地區
- 中國
- 印度
- 日本
- 韓國
- ANZ
- 亞太其他地區
- 拉丁美洲
- 巴西
- 墨西哥
- 阿根廷
- 其他拉丁美洲地區
- 中東和非洲
- 沙烏地阿拉伯
- 南非
- 阿拉伯聯合大公國
- 其他中東和非洲地區
第9章:公司簡介
- Activision Blizzard
- Amazon
- Bandai Namco
- Bioworld Merchandising
- Capcom Store
- Electronic Arts(EA)
- Etsy Sellers
- Fanatics, Inc.
- Fangamer
- Funko, Inc.
- Gamerabilia
- GameStop Corp.
- Insert Coin Clothing
- Hasbro, Inc.
- Hot Topic, Inc.
- J!NX, LLC
- LEGO Group
- Logitech G
- Loot Crate, LLC
- Microsoft Gaming
- NetEase
- Nintendo
- Numskull Designs
- Razer
- Sony Interactive Entertainment
- Square Enix Store
- SteelSeries
- Take-Two Interactive
- Tencent Holdings
- Ubisoft
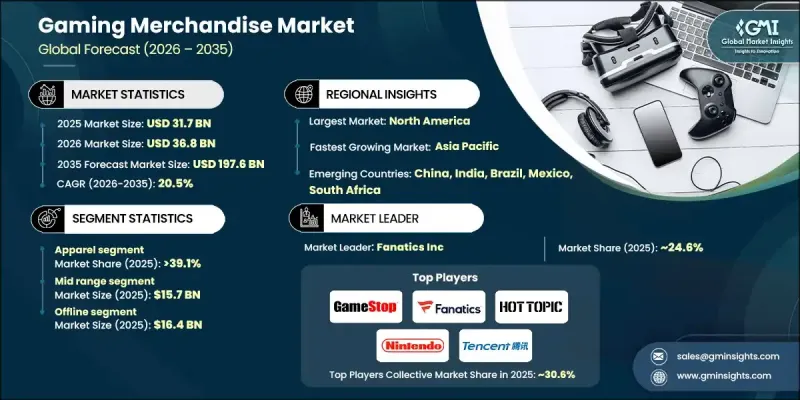
The Global Gaming Merchandise Market was valued at USD 31.7 billion in 2025 and is estimated to grow at a CAGR of 20.5% to reach USD 197.6 billion by 2035.
This sharp growth reflects the steady enlargement of the global gaming audience and the deeper cultural influence of gaming entertainment worldwide. As gaming continues to integrate into everyday lifestyles, consumer engagement increasingly extends beyond interactive experiences into the purchase of branded physical products. Merchandise has become a key channel through which fans express personal identity, brand affinity, and long-term loyalty. The growing acceptance of gaming across age groups and geographies is driving demand for lifestyle-oriented products associated with well-known game brands. As the gaming ecosystem matures, merchandise purchasing behavior is evolving into a mainstream consumer trend rather than a niche activity. Rising fan communities, increased digital exposure, and stronger emotional attachment to game universes are supporting sustained demand. This momentum is transforming gaming merchandise into a high-growth consumer category, supported by continuous innovation, broader distribution, and expanding global reach.
| Market Scope | |
|---|---|
| Start Year | 2025 |
| Forecast Year | 2026-2035 |
| Start Value | $31.7 Billion |
| Forecast Value | $197.6 Billion |
| CAGR | 20.5% |
The apparel category accounted for 39.1% share in 2025, making it the largest product segment. Demand is being driven by strong interest in branded clothing and lifestyle wear associated with gaming culture. Fashion-forward designs, brand visibility, and wider retail accessibility continue to support adoption, reinforcing apparel's leading position within the market.
The mid-range price segment generated USD 15.7 billion in 2025. This segment benefits from offering an optimal balance between cost and perceived quality, appealing to a broad consumer base. Products in this range align well with mainstream purchasing behavior, supporting consistent sales volumes across multiple merchandise categories.
North America Gaming Merchandise Market represented 35.5% share in 2025, positioning it as the leading regional market. Strong consumer engagement, established digital commerce channels, and high brand awareness are driving demand. The region continues to see strong interest in branded merchandise that reflects gaming-related lifestyle preferences.
Key companies active in the Global Gaming Merchandise Market include Nintendo, Funko, Sony Interactive Entertainment, Microsoft Gaming, Bandai Namco, Fanatics, Inc., Ubisoft, LEGO Group, Activision Blizzard, Hasbro, Inc., Razer, Logitech G, Square Enix Store, NetEase, Electronic Arts, Take-Two Interactive, Tencent Holdings, SteelSeries, GameStop Corp., Hot Topic, Inc., Insert Coin Clothing, Fangamer, Loot Crate, LLC, Numskull Designs, J!NX, LLC, Bioworld Merchandising, Capcom Store, Gamerabilia, Amazon, and independent Etsy sellers. Companies operating in the Global Gaming Merchandise Market are strengthening their positions through brand partnerships, diversified product lines, and direct-to-consumer sales strategies. Many players are focusing on limited-edition releases and exclusive collections to increase brand value and customer engagement. Expanding e-commerce capabilities and leveraging global distribution networks remain central priorities. Collaborations with designers and content creators are used to align merchandise with evolving consumer tastes. Firms are also investing in data-driven marketing to understand fan preferences and optimize product launches.
Table of Contents
Chapter 1 Methodology and Scope
- 1.1 Market scope and definition
- 1.2 Research design
- 1.2.1 Research approach
- 1.2.2 Data collection methods
- 1.3 Data mining sources
- 1.3.1 Global
- 1.3.2 Regional/Country
- 1.4 Base estimates and calculations
- 1.4.1 Base year calculation
- 1.4.2 Key trends for market estimation
- 1.5 Primary research and validation
- 1.5.1 Primary sources
- 1.6 Forecast model
- 1.7 Research assumptions and limitations
Chapter 2 Executive Summary
- 2.1 Industry snapshot
- 2.2 Key market trends
- 2.2.1 Products trends
- 2.2.2 Price Range trends
- 2.2.3 Distribution trends
- 2.2.4 Regional
- 2.3 TAM Analysis, 2026-2035 (USD Billion)
- 2.4 CXO perspectives: Strategic imperatives
- 2.4.1 Executive decision points
- 2.4.2 critical success factors
- 2.5 Future outlook and strategic recommendations
Chapter 3 Industry Insights
- 3.1 Industry ecosystem analysis
- 3.1.1 Supplier landscape
- 3.1.2 Profit margin
- 3.1.3 Cost structure
- 3.1.4 Value addition at each stage
- 3.1.5 Factor affecting the value chain
- 3.1.6 Disruptions
- 3.2 Industry impact forces
- 3.2.1 Growth drivers
- 3.2.1.1 Rapid growth of global gaming communities across PC, console, and mobile platforms.
- 3.2.1.2 Expansion of esports leagues and live gaming events
- 3.2.1.3 Strong fan engagement with game franchises is increasing demand for licensed and limited-edition products.
- 3.2.1.4 Rising influence of streamers and gaming influencers is accelerating merchandise visibility and direct-to-consumer sales.
- 3.2.1.5 Growth of e-commerce and online marketplaces is improving global accessibility to gaming merchandise.
- 3.2.2 Industry pitfalls and challenges
- 3.2.2.1 High licensing and royalty costs.
- 3.2.2.2 Limited retail presence in emerging markets restricts offline merchandise sales.
- 3.2.3 Market opportunities
- 3.2.4 Integration of gaming merchandise with fashion and lifestyle brands.
- 3.2.5 Rising demand for sustainable and eco-friendly gaming apparel presents differentiation opportunities.
- 3.2.1 Growth drivers
- 3.3 Growth potential analysis
- 3.4 Regulatory landscape
- 3.4.1 North America
- 3.4.2 Europe
- 3.4.3 Asia Pacific
- 3.4.4 Latin America
- 3.4.5 Middle East & Africa
- 3.5 Porter';s analysis
- 3.6 PESTEL analysis
- 3.7 Technology and innovation landscape
- 3.7.1 Current technological trends
- 3.7.2 Emerging technologies
- 3.8 Price trends
- 3.8.1 Historical price analysis (2022-2024)
- 3.8.2 Price trend drivers
- 3.8.3 Regional price variations
- 3.8.4 Price forecast (2026-2035)
- 3.9 Pricing strategies
- 3.10 Emerging business models
- 3.11 Compliance requirements
- 3.12 Sustainability measures
- 3.12.1 Sustainable materials assessment
- 3.12.2 Carbon footprint analysis
- 3.12.3 Circular economy implementation
- 3.12.4 Sustainability certifications and standards
- 3.12.5 Sustainability roi analysis
- 3.13 Global consumer sentiment analysis
- 3.14 Patent analysis
Chapter 4 Competitive Landscape, 2025
- 4.1 Introduction
- 4.2 Company market share analysis
- 4.2.1 By region
- 4.2.1.1 North America
- 4.2.1.2 Europe
- 4.2.1.3 Asia Pacific
- 4.2.1.4 Latin America
- 4.2.1.5 Middle East & Africa
- 4.2.2 Market Concentration Analysis
- 4.2.1 By region
- 4.3 Competitive benchmarking of key players
- 4.3.1 Financial performance comparison
- 4.3.1.1 Revenue
- 4.3.1.2 Profit margin
- 4.3.1.3 R&D
- 4.3.2 Product portfolio comparison
- 4.3.2.1 Product range breadth
- 4.3.2.2 Technology
- 4.3.2.3 Innovation
- 4.3.3 Geographic presence comparison
- 4.3.3.1 Global footprint analysis
- 4.3.3.2 Service network coverage
- 4.3.3.3 Market penetration by region
- 4.3.4 Competitive positioning matrix
- 4.3.4.1 Leaders
- 4.3.4.2 Challengers
- 4.3.4.3 Followers
- 4.3.4.4 Niche players
- 4.3.5 Strategic outlook matrix
- 4.3.1 Financial performance comparison
- 4.4 Key developments, 2022-2025
- 4.4.1 Mergers and acquisitions
- 4.4.2 Partnerships and collaborations
- 4.4.3 Technological advancements
- 4.4.4 Expansion and investment strategies
- 4.4.5 Sustainability initiatives
- 4.4.6 Digital transformation initiatives
- 4.5 Emerging/ startup competitors landscape
Chapter 5 Market Estimates & Forecast, By Product, 2022 - 2035 (USD Billion)
- 5.1 Key trends,
- 5.2 Apparel
- 5.3 Accessories
- 5.4 Collectibles
- 5.5 Gaming Peripherals
- 5.6 Home Decor
- 5.7 Others
Chapter 6 Market Estimates and Forecast, By Price Range, 2022 - 2035 (USD Billion)
- 6.1 Key trends
- 6.2 High-end
- 6.3 Mid-range
- 6.4 Low-cost
Chapter 7 Market Estimates & Forecast, By Distribution Channel, 2022 - 2035 (USD Billion)
- 7.1 Key trends
- 7.2 Online
- 7.3 Offline
Chapter 8 Market Estimates & Forecast, By Region, 2022 - 2035 (USD Billion)
- 8.1 Key trends, by region
- 8.2 North America
- 8.2.1 U.S.
- 8.2.2 Canada
- 8.3 Europe
- 8.3.1 UK
- 8.3.2 Germany
- 8.3.3 France
- 8.3.4 Italy
- 8.3.5 Spain
- 8.3.6 Russia
- 8.3.7 Rest of Europe
- 8.4 Asia-Pacific
- 8.4.1 China
- 8.4.2 India
- 8.4.3 Japan
- 8.4.4 South Korea
- 8.4.5 ANZ
- 8.4.6 Rest of Asia-Pacific
- 8.5 Latin America
- 8.5.1 Brazil
- 8.5.2 Mexico
- 8.5.3 Argentina
- 8.5.3 Rest of Latin America
- 8.6 MEA
- 8.6.1 Saudi Arabia
- 8.6.2 South Africa
- 8.6.3 UAE
- 8.6.4 Rest of MEA
Chapter 9 Company Profiles
- 9.1 Activision Blizzard
- 9.2 Amazon
- 9.3 Bandai Namco
- 9.4 Bioworld Merchandising
- 9.5 Capcom Store
- 9.6 Electronic Arts (EA)
- 9.7 Etsy Sellers
- 9.8 Fanatics, Inc.
- 9.9 Fangamer
- 9.10 Funko, Inc.
- 9.11 Gamerabilia
- 9.12 GameStop Corp.
- 9.13 Insert Coin Clothing
- 9.14 Hasbro, Inc.
- 9.15 Hot Topic, Inc.
- 9.16 J!NX, LLC
- 9.17 LEGO Group
- 9.18 Logitech G
- 9.19 Loot Crate, LLC
- 9.20 Microsoft Gaming
- 9.21 NetEase
- 9.22 Nintendo
- 9.23 Numskull Designs
- 9.24 Razer
- 9.25 Sony Interactive Entertainment
- 9.26 Square Enix Store
- 9.27 SteelSeries
- 9.28 Take-Two Interactive
- 9.29 Tencent Holdings
- 9.30 Ubisoft


