


 |
市場調查報告書
商品編碼
1928943
金奈米顆粒市場機會、成長要素、產業趨勢分析及預測(2026年至2035年)Gold Nanoparticles Market Opportunity, Growth Drivers, Industry Trend Analysis, and Forecast 2026 - 2035 |
||||||
全球金奈米顆粒市場預計到 2025 年將達到 64 億美元,到 2035 年將達到 192 億美元,年複合成長率為 11.8%。
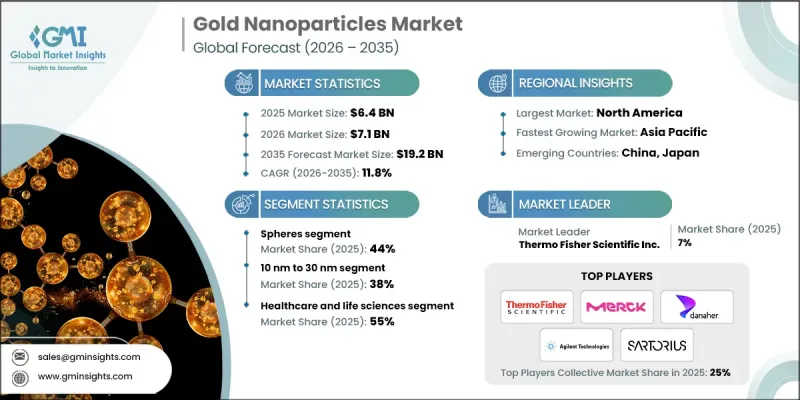
金奈米顆粒已從專業的實驗室材料發展成為生命科學領域中可規模化生產且應用廣泛的材料,解決了諸如穩定的生物標記和可調光學性質等挑戰。新冠疫情期間,生命科學研究經費達到前所未有的水平,大大促進了創新和學術論文的發表。這些奈米顆粒通常用作研究和診斷中的試劑和檢測組件。買家對品質標準、可追溯性和全面文件的要求日益提高,尤其是在體外診斷和生物偶聯應用領域。符合ISO標準的系統和分析證書正逐漸成為採購中的標準要求,確保了供應鏈的穩定性。持續的研發投入、公共科學參與以及對可重複性的重視,即使在疫情引發的需求激增結束後,也將繼續支撐市場的長期成長。
| 市場覆蓋範圍 | |
|---|---|
| 開始年份 | 2025 |
| 預測年份 | 2026-2035 |
| 起始值 | 64億美元 |
| 預測金額 | 192億美元 |
| 複合年成長率 | 11.8% |
球形奈米顆粒市場佔有率佔44%,預計到2035年將以11.1%的複合年成長率成長。這種形狀的奈米顆粒因其擴充性大規模生產、可重複性好以及在常規標記和檢測生產中易於檢驗等優點而日益受到青睞。同時,為了獲得可調的等離子體特性,用於光熱治療和感測應用,買家擴大採用棒狀和星狀等異向性形狀的奈米顆粒。供應商正透過擴展產品目錄和提高批次間一致性來應對不斷變化的研究需求。
預計到2025年,粒徑在10-30奈米範圍內的金奈米顆粒將佔據38%的市場佔有率,並在2035年之前以14.8%的複合年成長率成長。中等尺寸的顆粒在光學訊號強度、膠體穩定性和生物偶聯實用性方面實現了良好的平衡,適用於常規檢測。小於10奈米的奈米顆粒因其優異的組織穿透性和更大的表面積而更受歡迎,但需要更嚴格的品管。同時,較大的顆粒仍然適用於散射和可視化應用。
預計2025年,北美金奈米顆粒市場規模將達22億美元,2035年將達71億美元,複合年成長率(CAGR)為12.5%。強大的生命科學研發叢集、完善的採購標準以及強勁的診斷需求是推動區域成長的主要動力。檢測生產規模的擴大和轉化研究的持續投入,則維持了診斷、影像和早期治療應用領域的穩定需求。
目錄
第1章調查方法和範圍
第2章執行摘要
第3章業界考察
- 生態系分析
- 供應商情況
- 利潤率
- 每個階段的附加價值
- 影響價值鏈的因素
- 中斷
- 產業影響因素
- 促進要素
- 快速診斷和生物感測器
- 奈米醫學研究和轉化流程的進展
- 等離子體激元學和先進光學元件的發展
- 產業潛在風險與挑戰
- 黃金高成本且價格波動劇烈
- 監理和安全檢驗負擔
- 市場機遇
- 標靶藥物傳遞和光熱治療
- 可擴展的綠色合成和表面功能化
- 促進要素
- 成長潛力分析
- 監管環境
- 北美洲
- 歐洲
- 亞太地區
- 拉丁美洲
- 中東和非洲
- 波特分析
- PESTEL 分析
- 價格趨勢
- 按地區
- 依產品類型
- 未來市場趨勢
- 科技與創新趨勢
- 當前技術趨勢
- 新興技術
- 專利狀態
- 貿易統計(HS編碼)(註:僅提供主要國家的貿易統計)
- 主要進口國
- 主要出口國
- 永續性和環境方面
- 永續努力
- 減少廢棄物策略
- 生產中的能源效率
- 環保舉措
- 考慮到碳足跡
第4章 競爭情勢
- 介紹
- 公司市佔率分析
- 按地區
- 北美洲
- 歐洲
- 亞太地區
- 拉丁美洲
- 中東和非洲
- 按地區
- 企業矩陣分析
- 主要市場公司的競爭分析
- 競爭定位矩陣
- 重大進展
- 併購
- 夥伴關係與合作
- 新產品發布
- 業務拓展計劃
第5章 2022-2035年按產品分類的市場估算與預測
- 領域
- 桿
- 殼
- 籠
- 星星
- 三角形和棱柱
- 其他
6. 按規模範圍分類的市場估算與預測,2022-2035 年
- 小於10奈米
- 10nm~30nm
- 31nm~50nm
- 51nm~100nm
- 超過100奈米
7. 2022-2035年按最終用途產業分類的市場估算與預測
- 醫學與生命科學
- 體外診斷
- 影像劑和造影劑
- 藥物傳遞與治療方法
- 生物感測器
- 研究和實驗室用途
- 電子學與光電
- 導電油墨
- 顯示器和光電子學
- 電漿裝置
- 光熱和光學元件
- 化學品/材料
- 催化劑
- 塗料和複合材料
- 能源與環境
- 太陽能和燃料電池應用
- 水處理與環境感測
- 其他最終用途
第8章 2022-2035年各地區市場估算與預測
- 北美洲
- 美國
- 加拿大
- 歐洲
- 德國
- 英國
- 法國
- 西班牙
- 義大利
- 其他歐洲地區
- 亞太地區
- 中國
- 印度
- 日本
- 澳洲
- 韓國
- 亞太其他地區
- 拉丁美洲
- 巴西
- 墨西哥
- 阿根廷
- 其他拉丁美洲地區
- 中東和非洲
- 沙烏地阿拉伯
- 南非
- 阿拉伯聯合大公國
- 其他中東和非洲地區
第9章:公司簡介
- Cytodiagnostics Inc.
- nanoComposix
- BBI Solutions
- Merck KGaA
- Thermo Fisher Scientific Inc.
- Danaher Corporation
- Sartorius AG
- Agilent Technologies Inc.
- PerkinElmer Inc.
- Luminex Corporation
- Tanaka Precious Metals
- AMETEK Inc.
- Strem Chemicals Inc.
- Nanopartz Inc.
- Meliorum Technologies Inc.
- Goldsol Inc.
The Global Gold Nanoparticles Market was valued at USD 6.4 billion in 2025 and is estimated to grow at a CAGR of 11.8% to reach USD 19.2 billion by 2035.
Gold nanoparticles have evolved from a specialized laboratory material into a scalable, widely applied input across life sciences, addressing challenges in stable bio-labeling and tunable optical properties. Funding for life sciences research reached unprecedented levels during the COVID-19 pandemic, driving both innovation and publication output. These nanoparticles are commonly utilized as reagents and assay components in research and diagnostics. Buyers increasingly demand higher quality standards, traceability, and comprehensive documentation, particularly in in-vitro diagnostics and bioconjugation applications. ISO-aligned systems and certificates of analysis are becoming standard requirements in procurement, ensuring consistent supply chains. Sustained R&D, public science engagement, and a focus on reproducibility continue to underpin the market's long-term growth, even beyond pandemic-driven demand spikes.
| Market Scope | |
|---|---|
| Start Year | 2025 |
| Forecast Year | 2026-2035 |
| Start Value | $6.4 Billion |
| Forecast Value | $19.2 Billion |
| CAGR | 11.8% |
The spherical nanoparticles segment held a 44% share and is expected to grow at a CAGR of 11.1% through 2035. This shape dominates due to high-volume scalability, reproducibility, and ease of validation in routine labeling and assay production. Meanwhile, buyers are increasingly adding anisotropic shapes, such as rods and stars, to achieve tunable plasmonic properties for photothermal therapy and sensing applications. Suppliers are responding by broadening product catalogs and enhancing batch consistency to meet evolving research needs.
The gold nanoparticles sized 10 nm to 30 nm captured 38% share in 2025 and are expected to grow at a CAGR of 14.8% through 2035. Mid-range particles balance optical signal strength, colloidal stability, and bioconjugation practicality for routine assays. Smaller nanoparticles under 10 nm are preferred for enhanced tissue penetration and surface area, though they require stricter quality control. Larger particles remain relevant for scattering and visibility applications.
North America Gold Nanoparticles Market generated USD 2.2 billion in 2025 and is projected to reach USD 7.1 billion by 2035 at a CAGR of 12.5%. Strong life science R&D clusters, established procurement standards, and robust diagnostics demand drive regional growth. The scaling of assay manufacturing and consistent funding for translational research maintain steady demand across diagnostics, imaging, and early-stage therapeutic applications.
Major players in the Global Gold Nanoparticles Market include Cytodiagnostics Inc., nanoComposix, BBI Solutions, Merck KGaA, Thermo Fisher Scientific Inc., Danaher Corporation, Sartorius AG, Agilent Technologies, Inc., PerkinElmer, Inc., Luminex Corporation, Tanaka Precious Metals, AMETEK, Inc., Strem Chemicals, Inc., Nanopartz Inc., Meliorum Technologies, Inc., and Goldsol, Inc. Companies in the Global Gold Nanoparticles Market are strengthening their positions by expanding product portfolios with varied particle sizes and shapes to meet diverse research and diagnostic needs. R&D investments ensure improved reproducibility, stability, and bioconjugation performance. Firms are also emphasizing ISO-compliant quality systems, certificates of analysis, and traceable documentation to enhance trust with buyers.
Table of Contents
Chapter 1 Methodology & Scope
- 1.1 Market scope and definition
- 1.2 Research design
- 1.2.1 Research approach
- 1.2.2 Data collection methods
- 1.3 Data mining sources
- 1.3.1 Global
- 1.3.2 Regional/Country
- 1.4 Base estimates and calculations
- 1.4.1 Base year calculation
- 1.4.2 Key trends for market estimation
- 1.5 Primary research and validation
- 1.5.1 Primary sources
- 1.6 Forecast model
- 1.7 Research assumptions and limitations
Chapter 2 Executive Summary
- 2.1 Industry 3600 synopsis
- 2.2 Key market trends
- 2.2.1 Regional
- 2.2.2 Product
- 2.2.3 Size Range
- 2.2.4 End use Industry
- 2.3 TAM Analysis, 2026-2035
- 2.4 CXO perspectives: Strategic imperatives
- 2.4.1 Executive decision points
- 2.4.2 Critical success factors
- 2.5 Future Outlook and Strategic Recommendations
Chapter 3 Industry Insights
- 3.1 Industry ecosystem analysis
- 3.1.1 Supplier landscape
- 3.1.2 Profit margin
- 3.1.3 Value addition at each stage
- 3.1.4 Factor affecting the value chain
- 3.1.5 Disruptions
- 3.2 Industry impact forces
- 3.2.1 Growth drivers
- 3.2.1.1 Expansion of rapid diagnostics and biosensors
- 3.2.1.2 Rising nanomedicine research and translational pipelines
- 3.2.1.3 Growth in plasmonics and advanced optical devices
- 3.2.2 Industry pitfalls and challenges
- 3.2.2.1 High cost and price volatility of gold
- 3.2.2.2 Regulatory and safety validation burden
- 3.2.3 Market opportunities
- 3.2.3.1 Targeted drug delivery and photothermal therapy
- 3.2.3.2 Scalable green synthesis and surface functionalization
- 3.2.1 Growth drivers
- 3.3 Growth potential analysis
- 3.4 Regulatory landscape
- 3.4.1 North America
- 3.4.2 Europe
- 3.4.3 Asia Pacific
- 3.4.4 Latin America
- 3.4.5 Middle East & Africa
- 3.5 Porter';s analysis
- 3.6 PESTEL analysis
- 3.7 Price trends
- 3.7.1 By region
- 3.7.2 By Product type
- 3.8 Future market trends
- 3.9 Technology and Innovation landscape
- 3.9.1 Current technological trends
- 3.9.2 Emerging technologies
- 3.10 Patent Landscape
- 3.11 Trade statistics (HS code) (Note: the trade statistics will be provided for key countries only)
- 3.11.1 Major importing countries
- 3.11.2 Major exporting countries
- 3.12 Sustainability and environmental aspects
- 3.12.1 Sustainable practices
- 3.12.2 Waste reduction strategies
- 3.12.3 Energy efficiency in production
- 3.12.4 Eco-friendly initiatives
- 3.13 Carbon footprint consideration
Chapter 4 Competitive Landscape, 2025
- 4.1 Introduction
- 4.2 Company market share analysis
- 4.2.1 By region
- 4.2.1.1 North America
- 4.2.1.2 Europe
- 4.2.1.3 Asia Pacific
- 4.2.1.4 LATAM
- 4.2.1.5 MEA
- 4.2.1 By region
- 4.3 Company matrix analysis
- 4.4 Competitive analysis of major market players
- 4.5 Competitive positioning matrix
- 4.6 Key developments
- 4.6.1 Mergers & acquisitions
- 4.6.2 Partnerships & collaborations
- 4.6.3 New Product Launches
- 4.6.4 Expansion Plans
Chapter 5 Market Estimates and Forecast, By Product, 2022-2035 (USD Billion) (Kilo Tons)
- 5.1 Key trends
- 5.2 Spheres
- 5.3 Rods
- 5.4 Shells
- 5.5 Cages
- 5.6 Stars
- 5.7 Triangles and prisms
- 5.8 Other
Chapter 6 Market Estimates and Forecast, By Size Range, 2022-2035 (USD Billion) (Kilo Tons)
- 6.1 Key trends
- 6.2 Less than 10 nm
- 6.3 10 nm to 30 nm
- 6.4 31 nm to 50 nm
- 6.5 51 nm to 100 nm
- 6.6 More than 100 nm
Chapter 7 Market Estimates and Forecast, By End Use Industry, 2022-2035 (USD Billion) (Kilo Tons)
- 7.1 Key trends
- 7.2 Healthcare and life sciences
- 7.2.1 In vitro diagnostics
- 7.2.2 Imaging and contrast agents
- 7.2.3 Drug delivery and therapeutics
- 7.2.4 Biosensors
- 7.2.5 Research and laboratory use
- 7.3 Electronics and photonics
- 7.3.1 Conductive inks
- 7.3.2 Displays and optoelectronics
- 7.3.3 Plasmonic devices
- 7.3.4 Photothermal and optical components
- 7.4 Chemicals and materials
- 7.4.1 Catalysts
- 7.4.2 Coatings and composites
- 7.5 Energy and environment
- 7.5.1 Solar and fuel cell applications
- 7.5.2 Water treatment and environmental sensing
- 7.6 Other end use
Chapter 8 Market Estimates and Forecast, By Region, 2022-2035 (USD Billion) (Kilo Tons)
- 8.1 Key trends
- 8.2 North America
- 8.2.1 U.S.
- 8.2.2 Canada
- 8.3 Europe
- 8.3.1 Germany
- 8.3.2 UK
- 8.3.3 France
- 8.3.4 Spain
- 8.3.5 Italy
- 8.3.6 Rest of Europe
- 8.4 Asia Pacific
- 8.4.1 China
- 8.4.2 India
- 8.4.3 Japan
- 8.4.4 Australia
- 8.4.5 South Korea
- 8.4.6 Rest of Asia Pacific
- 8.5 Latin America
- 8.5.1 Brazil
- 8.5.2 Mexico
- 8.5.3 Argentina
- 8.5.4 Rest of Latin America
- 8.6 Middle East and Africa
- 8.6.1 Saudi Arabia
- 8.6.2 South Africa
- 8.6.3 UAE
- 8.6.4 Rest of Middle East and Africa
Chapter 9 Company Profiles
- 9.1 Cytodiagnostics Inc.
- 9.2 nanoComposix
- 9.3 BBI Solutions
- 9.4 Merck KGaA
- 9.5 Thermo Fisher Scientific Inc.
- 9.6 Danaher Corporation
- 9.7 Sartorius AG
- 9.8 Agilent Technologies Inc.
- 9.9 PerkinElmer Inc.
- 9.10 Luminex Corporation
- 9.11 Tanaka Precious Metals
- 9.12 AMETEK Inc.
- 9.13 Strem Chemicals Inc.
- 9.14 Nanopartz Inc.
- 9.15 Meliorum Technologies Inc.
- 9.16 Goldsol Inc.
 金奈米顆粒市場:依製造流程、應用、最終用途、國家及地區分類-全球產業分析、市場規模、市場佔有率及2026年至2033年預測
 金奈米顆粒市場:按類型、尺寸、合成方法、應用和最終用戶分類-2026-2032年全球市場預測
 金奈米顆粒市場規模、佔有率、趨勢和預測:按類型、應用、終端用戶產業和地區分類,2026-2034年導電金顆粒市場按產品類型、粒徑、合成方法和應用分類-全球預測,2026-2032年螢光標記金奈米球市場:按產品類型、粒徑、表面化學性質、銷售管道、應用和最終用途產業分類-全球預測(2026-2032 年)超均勻金奈米球市場:按粒徑、合成方法、表面塗層、應用和最終用戶分類,全球預測(2026-2032年)
 金奈米顆粒市場規模、佔有率及成長分析(按類型、應用、終端用戶產業及地區分類)-2026-2033年產業預測
 金奈米粒子:市場佔有率分析、行業趨勢、統計數據和成長預測(2025-2030 年)
 金奈米粒子市場按製程、應用、最終用途產業和地區分類 - 預測至 2029 年
 金奈米顆粒市場規模、佔有率和趨勢分析報告:按最終用途、按地區、細分市場預測,2024-2030 年