


 |
市場調查報告書
商品編碼
1928941
家禽益生菌配料市場機會、成長要素、產業趨勢分析及2026年至2035年預測Poultry Probiotic Ingredients Market Opportunity, Growth Drivers, Industry Trend Analysis, and Forecast 2026 - 2035 |
||||||
全球家禽益生菌成分市場預計到 2025 年將達到 1.263 億美元,到 2035 年將達到 2.302 億美元,年複合成長率為 6.3%。
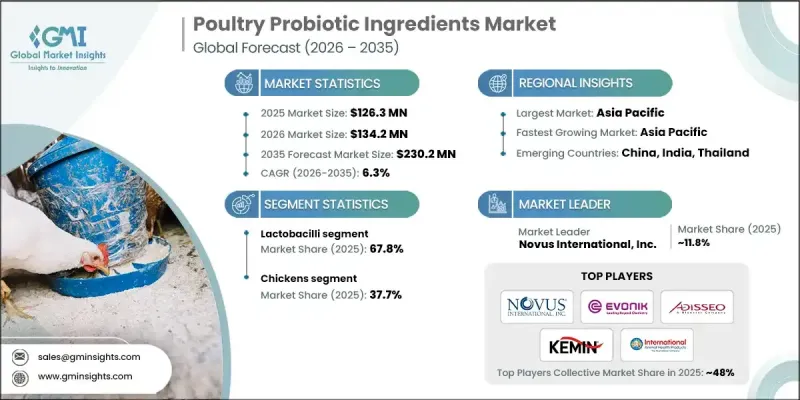
家禽益生菌成分經過精心配製,富含多種有益微生物,有助於維持腸道健康、提高飼料轉換率、增強免疫力,並提升商業化養殖中家禽的整體表現。這些成分包含芽孢桿菌、鏈球菌、雙叉桿菌、乳酸桿菌等多種益生菌菌株,它們在抑制病原體、促進營養吸收、最佳化消化功能和增強抗病能力方面發揮關鍵作用,是抗生素的天然替代品。全球家禽產量的成長、無抗生素養殖方式的廣泛應用以及益生菌技術的進步正在推動這一市場的發展。對多菌株配方、先進菌株研發以及針對不同家禽品種的生產力最佳化方面的持續投入,正在推動全球市場的強勁需求,為養殖戶帶來諸多益處,例如改善腸道菌群定植、增強病原體抑制、提高飼料轉化率以及最佳化商業化家禽養殖系統的免疫反應。
| 市場覆蓋範圍 | |
|---|---|
| 開始年份 | 2025 |
| 預測年份 | 2026-2035 |
| 起始值 | 1.263億美元 |
| 預測金額 | 2.302億美元 |
| 複合年成長率 | 6.3% |
乳酸菌市佔率比高達67.8%,預計到2035年將以6.2%的複合年成長率成長。其市場主導地位歸功於其卓越的腸道定植能力、有效的病原體抑製作用以及在肉雞、蛋雞和種雞中經證實的優異性能。乳酸菌透過產生乳酸來維持腸道健康,並能有效抑制有害細菌的生長,使其成為商業性家禽養殖中首選的益生菌菌株。
家禽業務佔市場佔有率的37.7%,預計到2035年將以6.6%的複合年成長率成長。這主要歸功於雞肉在全球家禽生產(包括肉雞和蛋雞)中的主導地位。該業務受益於成熟的益生菌通訊協定、貫穿生產各個階段的檢驗研究,以及透過提高飼料轉換率、降低死亡率和提升整體生產力而實現的可衡量的投資收益率(ROI)。
2025 年,美國全國家禽益生菌原料市場價值 3,120 萬美元。北美市場的成長動力來自商業肉雞養殖中對腸道環境最佳化的強勁需求、無抗生素水產養殖中對多菌株益生菌的需求,以及為提高生產效率而實施先進益生菌方案的綜合雞蛋生產企業的需求。
目錄
第1章調查方法和範圍
第2章執行摘要
第3章業界考察
- 生態系分析
- 供應商情況
- 利潤率
- 每個階段的附加價值
- 影響價值鏈的因素
- 中斷
- 產業影響因素
- 促進要素
- 產業潛在風險與挑戰
- 市場機遇
- 成長潛力分析
- 監管環境
- 北美洲
- 歐洲
- 亞太地區
- 拉丁美洲
- 中東和非洲
- 波特分析
- PESTEL 分析
- 科技與創新趨勢
- 當前技術趨勢
- 新興技術
- 價格趨勢
- 按地區
- 按產品等級
- 未來市場趨勢
- 科技與創新趨勢
- 當前技術趨勢
- 新興技術
- 專利趨勢
- 貿易統計(HS編碼)(註:僅提供主要國家的貿易統計)
- 主要進口國
- 主要出口國
- 永續性和環境方面
- 永續努力
- 減少廢棄物策略
- 生產中的能源效率
- 環保舉措
- 考慮到碳足跡
第4章 競爭情勢
- 介紹
- 公司市佔率分析
- 按地區
- 北美洲
- 歐洲
- 亞太地區
- 拉丁美洲
- 中東和非洲
- 按地區
- 企業矩陣分析
- 主要市場公司的競爭分析
- 競爭定位矩陣
- 重大進展
- 併購
- 夥伴關係與合作
- 新產品發布
- 擴張計劃
第5章 2022-2035年按產品分類的市場估算與預測
- 乳酸菌 乳酸桿菌屬
- 嗜酸乳桿菌
- 植物乳桿菌
- L. reuteri
- L. salivarius
- 其他
- 雙歧桿菌
- 雙叉桿菌/雙叉桿菌/ 長雙叉桿菌
- 長雙歧桿菌
- 動物雙歧桿菌
- 其他
- 鏈球菌
- S. thermophilus
- 糞腸球菌
- 芽孢桿菌
- 枯草桿菌
- B. licheniformis
- 枯草桿菌
- 其他
- 其他
第6章 按應用領域分類的市場估算與預測,2022-2035年
- 雞
- 肉雞
- 產蛋母雞
- 種雞
- 土耳其
- 鴨子
- 鵝
- 其他
第7章 2022-2035年各地區市場估算與預測
- 北美洲
- 美國
- 加拿大
- 歐洲
- 德國
- 英國
- 法國
- 西班牙
- 義大利
- 其他歐洲地區
- 亞太地區
- 中國
- 印度
- 日本
- 澳洲
- 韓國
- 亞太其他地區
- 拉丁美洲
- 巴西
- 墨西哥
- 阿根廷
- 其他拉丁美洲地區
- 中東和非洲
- 沙烏地阿拉伯
- 南非
- 阿拉伯聯合大公國
- 其他中東和非洲地區
第8章:公司簡介
- Novonesis(formerly Chr. Hansen)
- Novus International
- Biomin Holding GmbH
- Evonik Industries AG
- Adisseo France SAS
- Huvepharma AD
- Kemin Industries
- International Animal Health Products
- Pic-Bio, Inc.
- Neospark
- Lallemand Animal Nutrition
- Alltech
- Arm &Hammer Animal Nutrition
The Global Poultry Probiotic Ingredients Market was valued at USD 126.3 million in 2025 and is estimated to grow at a CAGR of 6.3% to reach USD 230.2 million by 2035.
Poultry probiotic ingredients consist of carefully formulated beneficial microorganisms that support gut health, enhance feed conversion efficiency, strengthen immunity, and improve overall bird performance in commercial operations. These ingredients include strains such as Bacillus, Streptococcus, Bifidobacterium, Lactobacilli, and other probiotic microbes that play critical roles in pathogen suppression, nutrient absorption, digestive optimization, and disease resistance, and serve as natural alternatives to antibiotics. Increasing global poultry production, the rise of antibiotic-free farming practices, and advancements in probiotic technologies are driving growth in this market. Continuous investment in multi-strain formulations, advanced strain development, and performance optimization across different poultry species ensures robust global demand, providing producers with improved gut colonization, stronger pathogen inhibition, enhanced feed conversion ratios, and optimized immune responses across commercial poultry systems.
| Market Scope | |
|---|---|
| Start Year | 2025 |
| Forecast Year | 2026-2035 |
| Start Value | $126.3 Million |
| Forecast Value | $230.2 Million |
| CAGR | 6.3% |
The lactobacilli segment held a 67.8% share and is expected to grow at a CAGR of 6.2% through 2035. Its dominance stems from superior gut colonization, effective pathogen inhibition, and proven performance across broilers, layers, and breeding stock. Lactobacilli support intestinal health through lactic acid production and provide competitive exclusion against harmful bacteria, making them the preferred probiotic strain for commercial poultry operations.
The chickens segment held a 37.7% share and is anticipated to grow at a CAGR of 6.6% through 2035. This is driven by chickens' overwhelming presence in global poultry production, covering both meat and egg production. The segment benefits from established probiotic protocols, validated research across production stages, and measurable ROI through improved feed conversion, reduced mortality, and increased overall productivity.
U.S. Poultry Probiotic Ingredients Market accounted for USD 31.2 million in 2025. Growth in North America is fueled by strong demand from commercial broiler operations for gut health optimization, multi-strain probiotics for antibiotic-free farming, and integrated layer operations employing advanced probiotic programs to improve production efficiency.
Key players operating in the Global Poultry Probiotic Ingredients Market include Novus International, Novonesis (formerly Chr. Hansen), Biomin Holding GmbH, Evonik Industries AG, Adisseo France SAS, Kemin Industries, Huvepharma AD, International Animal Health Products, Pic-Bio, Inc., Neospark, Lallemand Animal Nutrition, Alltech, and Arm & Hammer Animal Nutrition. Companies in the Poultry Probiotic Ingredients Market strengthen their foothold by investing in research and development for novel strains, multi-strain formulations, and advanced delivery systems. Expanding production capacities, establishing strategic partnerships with feed producers, and entering emerging geographic markets help enhance reach and distribution. Firms also emphasize quality assurance, regulatory compliance, and scientifically validated performance data to build customer trust.
Table of Contents
Chapter 1 Methodology & Scope
- 1.1 Market scope and definition
- 1.2 Research design
- 1.2.1 Research approach
- 1.2.2 Data collection methods
- 1.3 Data mining sources
- 1.3.1 Global
- 1.3.2 Regional/Country
- 1.4 Base estimates and calculations
- 1.4.1 Base year calculation
- 1.4.2 Key trends for market estimation
- 1.5 Primary research and validation
- 1.5.1 Primary sources
- 1.6 Forecast model
- 1.7 Research assumptions and limitations
Chapter 2 Executive Summary
- 2.1 Industry 360° synopsis
- 2.2 Key market trends
- 2.2.1 Product
- 2.2.2 Application
- 2.2.3 Regional
- 2.3 TAM Analysis, 2025-2035
- 2.4 CXO perspectives: Strategic imperatives
- 2.4.1 Executive decision points
- 2.4.2 Critical success factors
- 2.5 Future outlook and strategic recommendations
Chapter 3 Industry Insights
- 3.1 Industry ecosystem analysis
- 3.1.1 Supplier landscape
- 3.1.2 Profit margin
- 3.1.3 Value addition at each stage
- 3.1.4 Factor affecting the value chain
- 3.1.5 Disruptions
- 3.2 Industry impact forces
- 3.2.1 Growth drivers
- 3.2.2 Industry pitfalls and challenges
- 3.2.3 Market opportunities
- 3.3 Growth potential analysis
- 3.4 Regulatory landscape
- 3.4.1 North America
- 3.4.2 Europe
- 3.4.3 Asia Pacific
- 3.4.4 Latin America
- 3.4.5 Middle East & Africa
- 3.5 Porter';s analysis
- 3.6 PESTEL analysis
- 3.7 Technology and innovation landscape
- 3.7.1 Current technological trends
- 3.7.2 Emerging technologies
- 3.8 Price trends
- 3.8.1 By region
- 3.8.2 By product grade
- 3.9 Future market trends
- 3.10 Technology and innovation landscape
- 3.10.1 Current technological trends
- 3.10.2 Emerging technologies
- 3.11 Patent landscape
- 3.12 Trade statistics (HS code) (Note: the trade statistics will be provided for key countries only)
- 3.12.1 Major importing countries
- 3.12.2 Major exporting countries
- 3.13 Sustainability and environmental aspects
- 3.13.1 Sustainable practices
- 3.13.2 Waste reduction strategies
- 3.13.3 Energy efficiency in production
- 3.13.4 Eco-friendly initiatives
- 3.14 Carbon footprint consideration
Chapter 4 Competitive Landscape, 2025
- 4.1 Introduction
- 4.2 Company market share analysis
- 4.2.1 By region
- 4.2.1.1 North America
- 4.2.1.2 Europe
- 4.2.1.3 Asia Pacific
- 4.2.1.4 LATAM
- 4.2.1.5 MEA
- 4.2.1 By region
- 4.3 Company matrix analysis
- 4.4 Competitive analysis of major market players
- 4.5 Competitive positioning matrix
- 4.6 Key developments
- 4.6.1 Mergers & acquisitions
- 4.6.2 Partnerships & collaborations
- 4.6.3 New product launches
- 4.6.4 Expansion plans
Chapter 5 Market Estimates and Forecast, By Product, 2022-2035 (USD Million) (Kilo Tons)
- 5.1 Key trends
- 5.2 Lactobacilli
- 5.2.1 L. acidophilus
- 5.2.2 L. plantarum
- 5.2.3 L. reuteri
- 5.2.4 L. salivarius
- 5.2.5 Others
- 5.3 Bifidobacterium
- 5.4 B. bifidum
- 5.4.1 B. longum
- 5.4.2 B. animalis
- 5.4.3 Others
- 5.5 Streptococcus
- 5.5.1 S. thermophilus
- 5.5.2 Enterococcus faecium
- 5.6 Bacillus
- 5.6.1 B. subtilis
- 5.6.2 B. licheniformis
- 5.6.3 B. amyloliquefaciens
- 5.6.4 Others
- 5.7 Others
Chapter 6 Market Estimates and Forecast, By Application, 2022-2035 (USD Million) (Kilo Tons)
- 6.1 Key trends
- 6.2 Chickens
- 6.2.1 Broilers
- 6.2.2 Layers
- 6.2.3 Breeders
- 6.3 Turkeys
- 6.4 Ducks
- 6.5 Geese
- 6.6 Others
Chapter 7 Market Estimates and Forecast, By Region, 2022-2035 (USD Million) (Kilo Tons)
- 7.1 Key trends
- 7.2 North America
- 7.2.1 U.S.
- 7.2.2 Canada
- 7.3 Europe
- 7.3.1 Germany
- 7.3.2 UK
- 7.3.3 France
- 7.3.4 Spain
- 7.3.5 Italy
- 7.3.6 Rest of Europe
- 7.4 Asia Pacific
- 7.4.1 China
- 7.4.2 India
- 7.4.3 Japan
- 7.4.4 Australia
- 7.4.5 South Korea
- 7.4.6 Rest of Asia Pacific
- 7.5 Latin America
- 7.5.1 Brazil
- 7.5.2 Mexico
- 7.5.3 Argentina
- 7.5.4 Rest of Latin America
- 7.6 Middle East and Africa
- 7.6.1 Saudi Arabia
- 7.6.2 South Africa
- 7.6.3 UAE
- 7.6.4 Rest of Middle East and Africa
Chapter 8 Company Profiles
- 8.1 Novonesis (formerly Chr. Hansen)
- 8.2 Novus International
- 8.3 Biomin Holding GmbH
- 8.4 Evonik Industries AG
- 8.5 Adisseo France SAS
- 8.6 Huvepharma AD
- 8.7 Kemin Industries
- 8.8 International Animal Health Products
- 8.9 Pic-Bio, Inc.
- 8.10 Neospark
- 8.11 Lallemand Animal Nutrition
- 8.12 Alltech
- 8.13 Arm & Hammer Animal Nutrition


