


 |
市場調查報告書
商品編碼
1928929
低速車輛市場機會、成長要素、產業趨勢分析及2026年至2035年預測Low Speed Vehicle Market Opportunity, Growth Drivers, Industry Trend Analysis, and Forecast 2026 - 2035 |
||||||
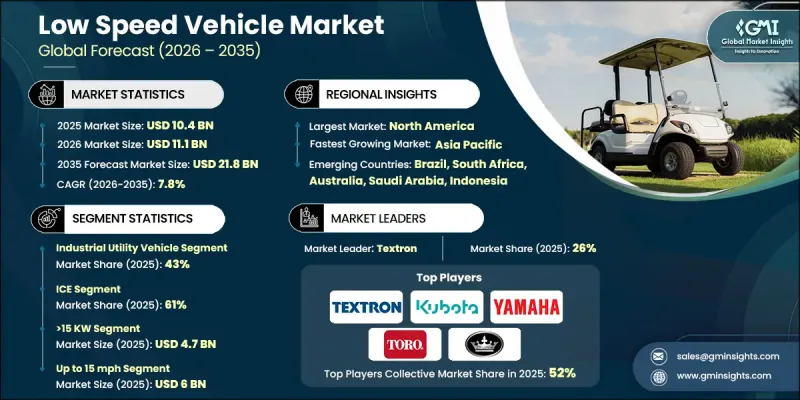
全球低速車輛市場預計到 2025 年將達到 104 億美元,到 2035 年將達到 218 億美元,年複合成長率為 7.8%。
隨著世界都市化,交通堵塞、空氣污染和噪音污染日益嚴重,對永續、高效的替代交通途徑的需求也日益迫切。低速車輛(LSV)正逐漸成為人口密集都市區、封閉式社區、度假村、校園和工業設施等短途出行的實用解決方案。這些車輛採用電力或替代燃料驅動,排放氣體極低,有助於改善空氣質量,減少對環境的影響。其緊湊的設計和限速使其在堵塞環境中安全靈活。電動車電池技術的進步(例如,更高的能量密度、更快的充電速度和更長的電池壽命)顯著提升了低速車輛的效率和吸引力。這些改進降低了營運成本,提高了性能,從而推動了個人交通、商業物流和工業應用領域對低速車輛的需求。儘管新冠疫情對市場產生了複雜的影響,但全球對低排放、經濟高效的交通解決方案的需求仍在持續成長。
| 市場覆蓋範圍 | |
|---|---|
| 開始年份 | 2025 |
| 預測年份 | 2026-2035 |
| 起始值 | 104億美元 |
| 預測金額 | 218億美元 |
| 複合年成長率 | 7.8% |
2025年,工業多用途車輛細分市場佔43%的市場佔有率,預計從2026年到2035年將以8.9%的複合年成長率成長。工業低速車輛(LSV)因其堅固耐用的設計、較長的運作週期以及1500至2500磅的有效載荷能力,在製造業、建築業、物流業和其他商業應用中至關重要。
預計到2025年,內燃機(ICE)汽車市佔率將達到61%,並在2035年之前以7.1%的複合年成長率成長。內燃機低速商用車(ICE LSV)憑藉其續航里程優勢、便捷的運作以及對特定應用的適用性,仍佔有重要的市場佔有率。這類車輛通常配備3至10馬力的引擎,並搭載自動變速箱或無段變速箱(CVT)。
2025 年,美國低速車輛市場價值將達到 38 億美元。需求成長的促進因素包括封閉式社區、休閒設施、校園和工業設施中低速車輛的日益普及,以及允許低速車輛在某些公共道路上行駛的法規,還有物流和物料搬運作業中電氣化程度的提高。
目錄
第1章調查方法和範圍
第2章執行摘要
第3章業界考察
- 生態系分析
- 供應商情況
- 原物料供應商
- 零件供應商
- 製造商
- 技術提供者
- 分銷管道
- 最終用途
- 成本結構
- 利潤率
- 每個階段的附加價值
- 垂直整合趨勢
- 顛覆者
- 供應商情況
- 影響因素
- 促進要素
- 封閉/管制區域內的城市交通
- 拓展旅遊、飯店和休閒產業的業務
- 電氣化和永續性要求
- 降低營運成本
- 產業潛在風險與挑戰
- 範圍和性能限制
- 道路通行限制和監管不一致
- 市場機遇
- 用鋰離子電池取代鉛酸電池
- 具備互聯/遠端資訊處理功能的低速車隊
- 可客製化模組化實用車身
- 住宅高級生活低速車 (LSV)
- 促進要素
- 技術趨勢與創新生態系統
- 目前技術
- 新興技術
- 成長潛力分析
- 監管環境
- 北美洲
- 美國國家公路交通安全管理局低速車輛(LSV)標準(FMVSS 500)
- 美國各州有關合法上路低速車輛(LSV)的法規
- 加拿大運輸部輕型商用車法規
- 歐洲
- 歐盟四輪輕型車輛類別 L6e/L7e
- 聯合國歐洲經濟委員會(UNECE)車輛安全法規
- 歐盟電池法規
- 歐盟報廢車輛指令
- 亞太地區
- 中國新能源車與低速車GB標準
- 印度電動車的CMVR法規
- 國土運輸省微型交通工具管理條例
- 拉丁美洲
- 巴西 CONTRAN 標準
- 阿根廷 IRAM 標準
- 墨西哥NOM車輛標準
- 中東和非洲
- 沙烏地阿拉伯 SASO 標準
- 阿拉伯聯合大公國證券及市場管理局 (ESMA) 法規
- 墨西哥灣沿岸地區GSO電動車標準
- 南非SANS法規
- 北美洲
- 波特分析
- PESTEL 分析
- 價格趨勢
- 按地區
- 依產品
- 專利分析
- 生產統計
- 生產基地
- 消費基礎
- 出口和進口
- 永續性和環境方面
- 永續實踐
- 減少廢棄物策略
- 生產中的能源效率
- 環保舉措
- 碳足跡考量
- 車輛架構和平台策略
- 底盤和滑板平台
- 模組化車身與實用附件策略
- 跨應用程式的平台重複使用
- OEM廠商與本地組裝
- 本地組裝vs. 品牌OEM廠商
- 白牌/自有品牌生產
- CKD/SKD組裝趨勢
- 車隊所有權和採購行為分析
- 車隊買家與個人買家
- 購買、租賃與車隊管理模式
- 更新周期和運轉率
- 低速車輛可行性及實施評估
- 總擁有成本 (TCO) 基準
- 電池、充電系統和動力傳動系統實用性
- 道路通行核准和合規的經濟學
- 應用層級的投資收益報酬率 (ROI) 與投資回收期
- 基礎設施發展現狀與營運風險
- 分銷和市場進入模式
第4章 競爭情勢
- 介紹
- 公司市佔率分析
- 北美洲
- 歐洲
- 亞太地區
- 拉丁美洲
- 中東和非洲
- 競爭定位矩陣
- 戰略展望矩陣
- 重大進展
- 併購
- 夥伴關係與合作
- 新產品發布
- 企業擴張計畫和資金籌措
第5章 依車輛類型分類的市場估計與預測,2022-2035年
- 高爾夫球車
- 商用多用途車輛
- 工業多用途車輛
- 個人代步車
6. 2022-2035年按推進方式分類的市場估計與預測
- 內燃機(ICE)
- 電的
第7章 按產量分類的市場估計與預測,2022-2035年
- 大於15千瓦
- 6-15kW
- <15kW
第8章 依速度等級分類的市場估算與預測,2022-2035年
- 時速15英里或更低
- 每小時 15-25 英里
- 超過25英里/小時
第9章 按應用領域分類的市場估算與預測,2022-2035年
- 高爾夫球場
- 飯店和度假村
- 飛機場
- 工業設施
- 其他
第10章 2022-2035年各地區市場估計與預測
- 北美洲
- 美國
- 加拿大
- 歐洲
- 英國
- 德國
- 法國
- 義大利
- 西班牙
- 比利時
- 荷蘭
- 瑞典
- 俄羅斯
- 亞太地區
- 中國
- 印度
- 日本
- 澳洲
- 新加坡
- 韓國
- 越南
- 印尼
- 拉丁美洲
- 巴西
- 墨西哥
- 阿根廷
- 中東和非洲
- 南非
- 沙烏地阿拉伯
- 阿拉伯聯合大公國
第11章 公司簡介
- 世界玩家
- Columbia Vehicle
- Deere &Company
- Garia
- ICON Electric Vehicles
- Kandi Technologies
- KUBOTA
- Polaris GEM
- Star EV
- Textron
- The Toro Company
- Tomberlin
- Yamaha Motor
- 區域玩家
- American Landmaster
- Bradshaw EV
- Moto Electric Vehicles
- Motrec International
- Suzhou Eagle Electric Vehicle Manufacturing
- EVolution Electric Vehicles
- Melex
- Bintelli
- 新興企業
- Stealth
- Tropos Motors
- Marshell
- Durable EV
- Eco Vehicle brands
The Global Low Speed Vehicle Market was valued at USD 10.4 billion in 2025 and is estimated to grow at a CAGR of 7.8% to reach USD 21.8 billion by 2035.
Rising urbanization worldwide is intensifying traffic congestion, air pollution, and noise, creating an urgent demand for sustainable, efficient transportation alternatives. LSVs are emerging as a practical solution for short-distance travel in densely populated urban areas, gated communities, resorts, campuses, and industrial facilities. These vehicles, powered by electricity or alternative fuels, produce minimal emissions, supporting cleaner air and reduced environmental impact. Their compact design and speed limitations make them safe and maneuverable in crowded settings. Advances in EV battery technology, including higher energy density, faster charging, and longer lifecycle, have significantly increased LSV efficiency and appeal. These improvements lower operating costs and enhance performance, making LSVs attractive for personal mobility, commercial logistics, and industrial applications. While the COVID-19 pandemic created mixed market effects, demand for low-emission and cost-effective transportation solutions continues to grow globally.
| Market Scope | |
|---|---|
| Start Year | 2025 |
| Forecast Year | 2026-2035 |
| Start Value | $10.4 Billion |
| Forecast Value | $21.8 Billion |
| CAGR | 7.8% |
The industrial utility vehicle segment held a 43% share in 2025 and is projected to grow at a CAGR of 8.9% from 2026 to 2035. Industrial LSVs are essential in manufacturing, construction, logistics, and other commercial applications due to their rugged design, extended duty cycles, and payload capacities of 1,500-2,500 lbs.
The internal Combustion Engine (ICE) vehicles segment held a 61% share in 2025, expected to grow at a CAGR of 7.1% through 2035. ICE LSVs retain a significant market presence because of operational range advantages, ease of refueling, and suitability for specific applications, typically powered by 3-10 horsepower engines with automated or continuously variable transmissions.
United States Low Speed Vehicle Market generated USD 3.8 billion in 2025. The demand is driven by widespread adoption in gated communities, recreational spaces, campuses, and industrial facilities, supported by regulations permitting LSVs on select public roads and increasing electrification efforts in logistics and materials handling operations.
Key players in the Global Low Speed Vehicle Market include Bradshaw EV, Columbia Vehicle, Polaris GEM, EVolution Electric Vehicles, Yamaha Motor, Textron, Deere & Company, Star EV, The Toro Company, and KUBOTA. Companies in the Global Low Speed Vehicle Market are strengthening their positions through continuous innovation in battery technology, enhancing vehicle efficiency, and extending lifecycle performance. Manufacturers are expanding product lines to target industrial, commercial, and personal mobility sectors. Strategic partnerships, acquisitions, and collaborations enable faster market penetration and global reach. Firms are also investing in digital marketing, e-commerce channels, and localized distribution to increase brand visibility. Electrification initiatives, after-sales support, and customized solutions for logistics and gated communities further solidify market foothold and long-term competitiveness.
Table of Contents
Chapter 1 Methodology & Scope
- 1.1 Market scope and definition
- 1.2 Research design
- 1.2.1 Research approach
- 1.2.2 Data collection methods
- 1.3 Data mining sources
- 1.3.1 Global
- 1.3.2 Regional/Country
- 1.4 Base estimates and calculations
- 1.4.1 Base year calculation
- 1.4.2 Key trends for market estimation
- 1.5 Primary research and validation
- 1.5.1 Primary sources
- 1.6 Forecast model
- 1.7 Research assumptions and limitations
Chapter 2 Executive Summary
- 2.1 Industry 3600 synopsis
- 2.2 Key market trends
- 2.2.1 Regional
- 2.2.2 Vehicle
- 2.2.3 Propulsion
- 2.2.4 Power Output
- 2.2.5 Speed Class
- 2.2.6 Application
- 2.3 TAM Analysis, 2026-2035
- 2.4 CXO perspectives: Strategic imperatives
- 2.4.1 Key decision points for industry executives
- 2.4.2 Critical success factors for market players
- 2.5 Future outlook and strategic recommendations
Chapter 3 Industry Insights
- 3.1 Industry ecosystem analysis
- 3.1.1 Supplier landscape
- 3.1.1.1 Raw material suppliers
- 3.1.1.2 Component suppliers
- 3.1.1.3 Manufacturers
- 3.1.1.4 Technology providers
- 3.1.1.5 Distribution channel
- 3.1.1.6 End Use
- 3.1.2 Cost structure
- 3.1.3 Profit margin
- 3.1.4 Value addition at each stage
- 3.1.5 Vertical integration trends
- 3.1.6 Disruptors
- 3.1.1 Supplier landscape
- 3.2 Impact on forces
- 3.2.1 Growth drivers
- 3.2.1.1 Urban mobility inside gated/controlled areas
- 3.2.1.2 Tourism, hospitality & leisure expansion
- 3.2.1.3 Electrification push & sustainability mandates
- 3.2.1.4 Operational cost savings
- 3.2.2 Industry pitfalls & challenges
- 3.2.2.1 Range & performance limitations
- 3.2.2.2 Limited road access & regulatory inconsistencies
- 3.2.3 Market opportunities
- 3.2.3.1 Lithium-ion replacing lead-acid
- 3.2.3.2 Connected / telematics-enabled LSV fleets
- 3.2.3.3 Customization & modular utility bodies
- 3.2.3.4 Premium & lifestyle LSVs for residential use
- 3.2.1 Growth drivers
- 3.3 Technology trends & innovation ecosystem
- 3.3.1 Current technologies
- 3.3.2 Emerging technologies
- 3.4 Growth potential analysis
- 3.5 Regulatory landscape
- 3.5.1 North America
- 3.5.1.1 U.S. NHTSA Low-Speed Vehicle (LSV) Standards (FMVSS 500)
- 3.5.1.2 U.S. State-Level Street-Legal LSV Rules
- 3.5.1.3 Canada Transport Canada LSV Regulations
- 3.5.2 Europe
- 3.5.2.1 EU Quadricycle Category L6e / L7e
- 3.5.2.2 UNECE Vehicle Safety Regulations
- 3.5.2.3 EU Battery Regulation
- 3.5.2.4 EU End-of-Life Vehicle Directive
- 3.5.3 Asia-Pacific
- 3.5.3.1 China GB Standards for NEVs and LSVs
- 3.5.3.2 India CMVR Rules for Electric Vehicles
- 3.5.3.3 Japan MLIT Micro-Mobility Regulations
- 3.5.4 Latin America
- 3.5.4.1 Brazil CONTRAN Standards
- 3.5.4.2 Argentina IRAM Standards
- 3.5.4.3 Mexico NOM Vehicle Standards
- 3.5.5 Middle East & Africa
- 3.5.5.1 Saudi Arabia SASO Standards
- 3.5.5.2 UAE ESMA Regulations
- 3.5.5.3 GSO Gulf Standards for Electric Vehicles
- 3.5.5.4 South Africa SANS Regulations
- 3.5.1 North America
- 3.6 Porter';s analysis
- 3.7 PESTEL analysis
- 3.8 Price trends
- 3.8.1 By region
- 3.8.2 By product
- 3.9 Patent analysis
- 3.10 Production statistics
- 3.10.1 Production hubs
- 3.10.2 Consumption hubs
- 3.10.3 Export and import
- 3.11 Sustainability and environmental aspects
- 3.11.1 Sustainable practices
- 3.11.2 Waste reduction strategies
- 3.11.3 Energy efficiency in production
- 3.11.4 Eco-friendly initiatives
- 3.11.5 Carbon footprint considerations
- 3.12 Vehicle Architecture & Platform Strategy
- 3.12.1 Chassis & skateboard platforms
- 3.12.2 Modular body & utility attachment strategy
- 3.12.3 Platform reuse across applications
- 3.13 OEM vs Regional Assembler Landscape
- 3.13.1 Local assemblers vs branded OEMs
- 3.13.2 White-label / private-label manufacturing
- 3.13.3 CKD/SKD assembly trends
- 3.14 Fleet Ownership & Buying Behavior Analysis
- 3.14.1 Fleet buyers vs individual buyers
- 3.14.2 Purchase vs lease vs managed fleet models
- 3.14.3 Replacement cycles and utilization rates
- 3.15 Feasibility & adoption of low-speed vehicles assessment
- 3.15.1 Total Cost of Ownership (TCO) benchmarking
- 3.15.2 Battery, charging & powertrain viability
- 3.15.3 Street-legality & compliance economics
- 3.15.4 Application-level ROI & payback
- 3.15.5 Infrastructure readiness & operating risk
- 3.16 Distribution & Go-To-Market Models
Chapter 4 Competitive Landscape, 2025
- 4.1 Introduction
- 4.2 Company market share analysis
- 4.2.1 North America
- 4.2.2 Europe
- 4.2.3 Asia-Pacific
- 4.2.4 Latin America
- 4.2.5 Middle East & Africa
- 4.3 Competitive positioning matrix
- 4.4 Strategic outlook matrix
- 4.5 Key developments
- 4.5.1 Mergers & acquisitions
- 4.5.2 Partnerships & collaborations
- 4.5.3 New product launches
- 4.5.4 Expansion plans and funding
Chapter 5 Market Estimates & Forecast, By Vehicle, 2022 - 2035 ($Bn, Units)
- 5.1 Key trends
- 5.2 Golf Cart
- 5.3 Commercial utility vehicle
- 5.4 Industrial utility vehicle
- 5.5 Personal mobility vehicle
Chapter 6 Market Estimates & Forecast, By Propulsion, 2022 - 2035 ($Bn, units)
- 6.1 Key trends
- 6.2 ICE
- 6.3 Electric
Chapter 7 Market Estimates & Forecast, By Power Output, 2022 - 2035 ($Bn, Units)
- 7.1 Key trends
- 7.2 >15 KW
- 7.3 6-15KW
- 7.4 <15KW
Chapter 8 Market Estimates & Forecast, By Speed Class, 2022 - 2035 ($Bn, Units)
- 8.1 Key trends
- 8.2 Up to 15 mph
- 8.3 15-25 mph
- 8.4 Above 25 mph
Chapter 9 Market Estimates & Forecast, By Application, 2022 - 2035 ($Bn, Units)
- 9.1 Key trends
- 9.2 Golf courses
- 9.3 Hotels & resorts
- 9.4 Airports
- 9.5 Industrial facilities
- 9.6 Others
Chapter 10 Market Estimates & Forecast, By Region, 2022 - 2035 ($Bn, Units)
- 10.1 North America
- 10.1.1 US
- 10.1.2 Canada
- 10.2 Europe
- 10.2.1 UK
- 10.2.2 Germany
- 10.2.3 France
- 10.2.4 Italy
- 10.2.5 Spain
- 10.2.6 Belgium
- 10.2.7 Netherlands
- 10.2.8 Sweden
- 10.2.9 Russia
- 10.3 Asia Pacific
- 10.3.1 China
- 10.3.2 India
- 10.3.3 Japan
- 10.3.4 Australia
- 10.3.5 Singapore
- 10.3.6 South Korea
- 10.3.7 Vietnam
- 10.3.8 Indonesia
- 10.4 Latin America
- 10.4.1 Brazil
- 10.4.2 Mexico
- 10.4.3 Argentina
- 10.5 MEA
- 10.5.1 South Africa
- 10.5.2 Saudi Arabia
- 10.5.3 UAE
Chapter 11 Company Profiles
- 11.1 Global players
- 11.1.1 Columbia Vehicle
- 11.1.2 Deere & Company
- 11.1.3 Garia
- 11.1.4 ICON Electric Vehicles
- 11.1.5 Kandi Technologies
- 11.1.6 KUBOTA
- 11.1.7 Polaris GEM
- 11.1.8 Star EV
- 11.1.9 Textron
- 11.1.10 The Toro Company
- 11.1.11 Tomberlin
- 11.1.12 Yamaha Motor
- 11.2 Regional players
- 11.2.1 American Landmaster
- 11.2.2 Bradshaw EV
- 11.2.3 Moto Electric Vehicles
- 11.2.4 Motrec International
- 11.2.5 Suzhou Eagle Electric Vehicle Manufacturing
- 11.2.6 EVolution Electric Vehicles
- 11.2.7 Melex
- 11.2.8 Bintelli
- 11.3 Emerging players
- 11.3.1 Stealth
- 11.3.2 Tropos Motors
- 11.3.3 Marshell
- 11.3.4 Durable EV
- 11.3.5 Eco Vehicle brands
 低速車輛市場規模、佔有率、成長及全球產業分析:按類型、應用和地區分類的洞察,2026-2034 年預測全球低速車輛市場規模、佔有率、趨勢和成長分析報告(2026-2034年)
 低速車輛市場-全球產業規模、佔有率、趨勢、機會與預測:按推進系統、車輛類型、應用、地區和競爭格局分類,2021-2031年
 低速電動汽車電池市場:按化學成分、車輛類型、容量範圍、銷售管道、應用和最終用戶分類 - 全球預測 2026-2032
 低速車輛市場規模、佔有率和成長分析(按車輛類型、功率輸出、電池類型、應用、推進方式、類別和地區分類)-2026-2033年產業預測
 L5級電動車市場:按類型、最高速度、馬達功率、總車輛重量(GVW)、應用、國家及地區分類-全球產業分析、市場規模、市場佔有率及2025-2032年預測
 低速卡車市場(按推進方式和地區分類)
 電動 L5 車輛市場 - 馬達容量:小於 4 kW、4.1 kW 至 7.5 kW、7.6 kW 至 10 kW 和大於 10 kW;最高速度 - 全球產業分析、規模、佔有率、成長、趨勢和預測,2025 年至 2035 年
 低速車輛(LSV)的全球市場的評估:各車輛類型,各用途,不同速度,推動因素,各地區,機會,預測(2018年~2032年)
 到 2030 年低速汽車市場預測:按類型、動力來源、輸出、電池類型、座椅數量、應用、最終用戶和地區進行的全球分析