


 |
市場調查報告書
商品編碼
1928914
氮氣市場機會、成長要素、產業趨勢分析及2026年至2035年預測Nitrogen Gas Market Opportunity, Growth Drivers, Industry Trend Analysis, and Forecast 2026 - 2035 |
||||||
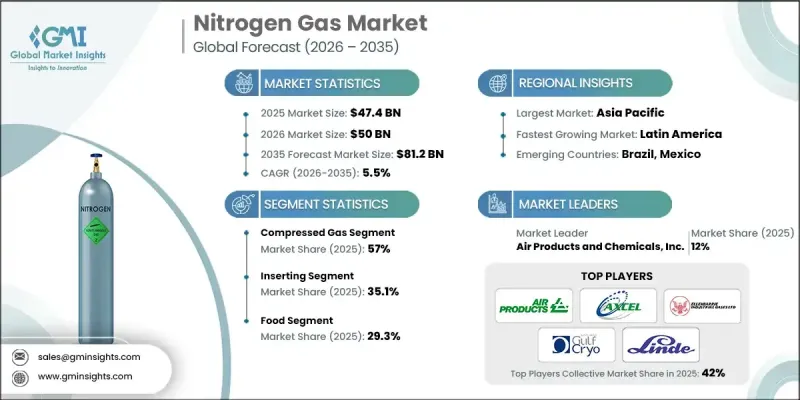
全球氮氣市場預計到 2025 年價值 474 億美元,到 2035 年達到 812 億美元,年複合成長率為 5.5%。
這一成長主要受能源密集產業生產活動的增加所驅動,這些活動推動了氮氣在惰性保護、覆蓋和製程保護等領域的應用。先進生命科學製造業的生產擴張也支撐了需求,氮氣被廣泛用於受控環境、保存和穩定化製程。高純度氮氣在敏感生物材料的保存和先進治療藥物的生產中應用日益廣泛。電子和半導體生產的快速成長也促進了氮氣消費量的成長,氮氣在維持生產過程中的受控氣氛方面發揮關鍵作用。同時,生產商正優先考慮透過改進空氣分離技術以及整合綠能和熱源來提高能源效率和減少排放。重工業終端用戶正在加速向現場發電系統和管道供應模式轉型,這提高了供應可靠性並減少了運輸相關的排放。這些因素共同推動了多個產業部門的長期市場擴張。
| 市場覆蓋範圍 | |
|---|---|
| 開始年份 | 2025 |
| 預測年份 | 2026-2035 |
| 起始值 | 474億美元 |
| 預測金額 | 812億美元 |
| 複合年成長率 | 5.5% |
2025年,壓縮氮氣市佔率達到57%,預計到2035年將以5.3%的複合年成長率成長。供應商受益於同時提供壓縮氮氣和液態氮氣,這兩種形式分別滿足不同的運作需求。壓縮氮氣廣泛應用於常規工業製程,通常透過氣瓶、氣束或散裝系統輸送。而液態氮對需要快速、高強度冷卻和低溫性能的應用至關重要。
預計到 2025 年,插入式氣體處理市佔率將達到 35.1%,2026 年至 2035 年的複合年成長率將達到 14.8%。氮氣解決方案以及覆蓋、吹掃和相關功能正在成為多個工業領域的標準配置,以提高操作安全性、降低污染風險並滿足日益嚴格的品質和安全標準。
預計到 2025 年,北美氮氣市場規模將達到 119 億美元。這一成長得益於多元化的工業基礎、成熟的管道輸送和現場製氮基礎設施,以及先進製造業的蓬勃發展。
目錄
第1章調查方法和範圍
第2章執行摘要
第3章業界考察
- 生態系分析
- 供應商情況
- 利潤率
- 每個階段的附加價值
- 影響價值鏈的因素
- 中斷
- 產業影響因素
- 促進要素
- 工業和製造業產出增加
- 食品加工和低溫運輸物流的成長
- 製藥、生物技術和半導體產業的擴張
- 產業潛在風險與挑戰
- 空氣分離裝置的高能耗
- 透過現場發電減少大宗貨物運輸
- 市場機遇
- 引入環境友善、低碳氮生產流程
- 新興市場的工業化與基礎設施發展
- 促進要素
- 成長潛力分析
- 監管環境
- 北美洲
- 歐洲
- 亞太地區
- 拉丁美洲
- 中東和非洲
- 波特分析
- PESTEL 分析
- 價格趨勢
- 按地區
- 按形式
- 未來市場趨勢
- 科技與創新趨勢
- 當前技術趨勢
- 新興技術
- 專利狀態
- 貿易統計(HS編碼)
(註:貿易統計數據僅涵蓋主要國家。)
- 主要進口國
- 主要出口國
- 永續性和環境方面
- 永續努力
- 減少廢棄物策略
- 生產中的能源效率
- 環保舉措
- 考慮到碳足跡
第4章 競爭情勢
- 介紹
- 公司市佔率分析
- 按地區
- 北美洲
- 歐洲
- 亞太地區
- 拉丁美洲
- 中東和非洲
- 按地區
- 企業矩陣分析
- 主要市場公司的競爭分析
- 競爭定位矩陣
- 重大進展
- 併購
- 夥伴關係與合作
- 新產品發布
- 業務拓展計劃
第5章 按類型分類的市場估算與預測,2022-2035年
- 壓縮氣體
- 高壓汽缸
- 大宗/管式拖車
- 現場生成的壓縮氮氣
- 液態氮體
- 散裝儲存槽
- 杜瓦瓶/攜帶式容器
- 現場低溫設備
第6章 按應用領域分類的市場估算與預測,2022-2035年
- 惰性
- 反應器和容器惰性
- 儲存槽惰性
- 管道惰性
- 毯子
- 食品飲料頭部空間覆蓋
- 化學品和溶劑儲罐的覆蓋層
- 石油和燃料儲存的覆蓋層
- 焊接和切割
- 金屬焊接保護氣體混合物
- 雷射和等離子切割支持
- 熱處理和硬焊氣氛
- 清除
- 管道和工藝管線的清洗
- 設備啟動和關閉期間的吹掃
- 維護和安全操作的吹掃
- 其他
7. 2022-2035年按最終用途產業分類的市場估算與預測
- 化妝品
- 食物
- 車
- 製藥
- 其他
第8章 2022-2035年各地區市場估算與預測
- 北美洲
- 美國
- 加拿大
- 歐洲
- 德國
- 英國
- 法國
- 西班牙
- 義大利
- 其他歐洲地區
- 亞太地區
- 中國
- 印度
- 日本
- 澳洲
- 韓國
- 亞太其他地區
- 拉丁美洲
- 巴西
- 墨西哥
- 阿根廷
- 其他拉丁美洲地區
- 中東和非洲
- 沙烏地阿拉伯
- 南非
- 阿拉伯聯合大公國
- 其他中東和非洲地區
第9章:公司簡介
- Air Products and Chemicals, Inc.
- Axcel Gases
- Ellenbarrie industrial Gases.
- Gulfcryo
- Linde PLC
- Messer Group
- Omega Air
- PARKER HANNIFIN CORP
- Praxair Technology, Inc.
- Southern Industrial Gas
- Universal Industrial Gases, Inc.
- Yingde Gases Group
The Global Nitrogen Gas Market was valued at USD 47.4 billion in 2025 and is estimated to grow at a CAGR of 5.5% to reach USD 81.2 billion by 2035.
Growth is driven by rising production activity across energy-intensive industries, which has increased the use of nitrogen for inerting, blanketing, and process protection applications. Expanding output in advanced life science manufacturing has further supported demand, as nitrogen is widely used for controlled environments, preservation, and stabilization processes. High-purity nitrogen continues to see increased adoption in the storage of sensitive biological materials and in advanced therapeutic manufacturing workflows. The rapid expansion of electronics and semiconductor production has also contributed to higher consumption, as nitrogen plays a critical role in maintaining controlled atmospheres during fabrication. At the same time, producers are prioritizing improvements in energy efficiency and emissions reduction by enhancing air separation technologies and integrating cleaner power and heat sources. End users across heavy industries are increasingly shifting toward on-site generation systems and pipeline-based supply models, which improve supply reliability while lowering transportation-related emissions. These combined factors are reinforcing long-term market expansion across multiple industrial sectors.
| Market Scope | |
|---|---|
| Start Year | 2025 |
| Forecast Year | 2026-2035 |
| Start Value | $47.4 Billion |
| Forecast Value | $81.2 Billion |
| CAGR | 5.5% |
The compressed nitrogen segment accounted for 57% share in 2025 and is forecast to grow at a CAGR of 5.3% through 2035. Suppliers benefit from offering both compressed and liquid formats, as each supports different operational requirements. Compressed nitrogen is widely used in routine industrial processes delivered via cylinders, bundles, or bulk systems, while liquid nitrogen is essential for applications requiring rapid and high-intensity cooling and cryogenic performance.
The inserting segment held a 35.1% share in 2025 and is expected to grow at a CAGR of 14.8% from 2026 to 2035. Along with blanketing, purging, and related functions, nitrogen-based solutions are becoming standardized across multiple industries to enhance operational safety, reduce contamination risks, and meet increasingly strict quality and safety standards.
North America Nitrogen Gas Market segment reached USD 11.9 billion in 2025. This growth is supported by a diverse industrial base and mature infrastructure for pipeline distribution and on-site nitrogen generation, alongside rising activity in advanced manufacturing sectors.
Key companies active in the Global Nitrogen Gas Market include Linde PLC, Air Products and Chemicals, Inc., Praxair Technology, Inc., Messer Group, Yingde Gases Group, PARKER HANNIFIN CORP, Gulfcryo, Omega Air, Ellenbarrie Industrial Gases, Universal Industrial Gases, Inc., Southern Industrial Gas, and Axcel Gases. Companies operating in the Global Nitrogen Gas Market are strengthening their market positions through capacity expansion, infrastructure investment, and technology optimization. Many players are focusing on on-site generation solutions and long-term supply agreements to secure stable demand and improve customer retention. Investments in advanced air separation systems are helping reduce operating costs and environmental impact. Strategic partnerships and geographic expansion are used to improve market reach, while portfolio diversification across purity levels and delivery modes allows suppliers to address a broader range of industrial requirements and maintain competitive differentiation.
Table of Contents
Chapter 1 Methodology & Scope
- 1.1 Market scope and definition
- 1.2 Research design
- 1.2.1 Research approach
- 1.2.2 Data collection methods
- 1.3 Data mining sources
- 1.3.1 Global
- 1.3.2 Regional/Country
- 1.4 Base estimates and calculations
- 1.4.1 Base year calculation
- 1.4.2 Key trends for market estimation
- 1.5 Primary research and validation
- 1.5.1 Primary sources
- 1.6 Forecast model
- 1.7 Research assumptions and limitations
Chapter 2 Executive Summary
- 2.1 Industry 360° synopsis
- 2.2 Key market trends
- 2.2.1 Regional
- 2.2.2 Form
- 2.2.3 Application
- 2.2.4 End Use Industry
- 2.3 TAM Analysis, 2026-2035
- 2.4 CXO perspectives: Strategic imperatives
- 2.4.1 Executive decision points
- 2.4.2 Critical success factors
- 2.5 Future Outlook and Strategic Recommendations
Chapter 3 Industry Insights
- 3.1 Industry ecosystem analysis
- 3.1.1 Supplier landscape
- 3.1.2 Profit margin
- 3.1.3 Value addition at each stage
- 3.1.4 Factor affecting the value chain
- 3.1.5 Disruptions
- 3.2 Industry impact forces
- 3.2.1 Growth drivers
- 3.2.1.1 Rising industrial production and manufacturing output
- 3.2.1.2 Growth in food processing and cold-chain logistics
- 3.2.1.3 Expansion of pharma, biotech and semiconductor sectors
- 3.2.2 Industry pitfalls and challenges
- 3.2.2.1 High energy costs for air separation plants
- 3.2.2.2 On-site generation reducing bulk delivery volumes
- 3.2.3 Market opportunities
- 3.2.3.1 Adoption of green, low-carbon nitrogen production
- 3.2.3.2 Emerging market industrialisation and infrastructure
- 3.2.1 Growth drivers
- 3.3 Growth potential analysis
- 3.4 Regulatory landscape
- 3.4.1 North America
- 3.4.2 Europe
- 3.4.3 Asia Pacific
- 3.4.4 Latin America
- 3.4.5 Middle East & Africa
- 3.5 Porter';s analysis
- 3.6 PESTEL analysis
- 3.7 Price trends
- 3.7.1 By region
- 3.7.2 By form
- 3.8 Future market trends
- 3.9 Technology and Innovation landscape
- 3.9.1 Current technological trends
- 3.9.2 Emerging technologies
- 3.10 Patent Landscape
- 3.11 Trade statistics (HS code)
( Note: the trade statistics will be provided for key countries only)
- 3.11.1 Major importing countries
- 3.11.2 Major exporting countries
- 3.12 Sustainability and environmental aspects
- 3.12.1 Sustainable practices
- 3.12.2 Waste reduction strategies
- 3.12.3 Energy efficiency in production
- 3.12.4 Eco-friendly initiatives
- 3.13 Carbon footprint consideration
Chapter 4 Competitive Landscape, 2025
- 4.1 Introduction
- 4.2 Company market share analysis
- 4.2.1 By region
- 4.2.1.1 North America
- 4.2.1.2 Europe
- 4.2.1.3 Asia Pacific
- 4.2.1.4 LATAM
- 4.2.1.5 MEA
- 4.2.1 By region
- 4.3 Company matrix analysis
- 4.4 Competitive analysis of major market players
- 4.5 Competitive positioning matrix
- 4.6 Key developments
- 4.6.1 Mergers & acquisitions
- 4.6.2 Partnerships & collaborations
- 4.6.3 New Product Launches
- 4.6.4 Expansion Plans
Chapter 5 Market Estimates and Forecast, By Form, 2022-2035 (USD Billion) (Kilo Tons)
- 5.1 Key trends
- 5.2 Compressed gas
- 5.2.1 High-pressure cylinders
- 5.2.2 Bulk / tube trailers
- 5.2.3 On-site generated compressed nitrogen
- 5.3 Liquid nitrogen gas
- 5.3.1 Bulk storage tanks
- 5.3.2 Dewars / portable containers
- 5.3.3 On-site cryogenic plants
Chapter 6 Market Estimates and Forecast, By Application, 2022-2035 (USD Billion) (Kilo Tons)
- 6.1 Key trends
- 6.2 Inerting
- 6.2.1 Reactor and vessel inerting
- 6.2.2 Storage tank inerting
- 6.2.3 Pipeline inerting
- 6.3 Blanketing
- 6.3.1 Food and beverage headspace blanketing
- 6.3.2 Chemical and solvent tank blanketing
- 6.3.3 Oil and fuel storage blanketing
- 6.4 Welding & cutting
- 6.4.1 Metal welding shielding gas blends
- 6.4.2 Laser cutting and plasma cutting support
- 6.4.3 Heat treatment and brazing atmospheres
- 6.5 Purging
- 6.5.1 Pipeline and process line purging
- 6.5.2 Start-up and shutdown purging of equipment
- 6.5.3 Purging for maintenance and safety operations
- 6.6 Others
Chapter 7 Market Estimates and Forecast, By End Use Industry, 2022-2035 (USD Billion) (Kilo Tons)
- 7.1 Key trends
- 7.2 Cosmetics
- 7.3 Food
- 7.4 Automotive
- 7.5 Pharmaceutical
- 7.6 Others
Chapter 8 Market Estimates and Forecast, By Region, 2022-2035 (USD Billion) (Kilo Tons)
- 8.1 Key trends
- 8.2 North America
- 8.2.1 U.S.
- 8.2.2 Canada
- 8.3 Europe
- 8.3.1 Germany
- 8.3.2 UK
- 8.3.3 France
- 8.3.4 Spain
- 8.3.5 Italy
- 8.3.6 Rest of Europe
- 8.4 Asia Pacific
- 8.4.1 China
- 8.4.2 India
- 8.4.3 Japan
- 8.4.4 Australia
- 8.4.5 South Korea
- 8.4.6 Rest of Asia Pacific
- 8.5 Latin America
- 8.5.1 Brazil
- 8.5.2 Mexico
- 8.5.3 Argentina
- 8.5.4 Rest of Latin America
- 8.6 Middle East and Africa
- 8.6.1 Saudi Arabia
- 8.6.2 South Africa
- 8.6.3 UAE
- 8.6.4 Rest of Middle East and Africa
Chapter 9 Company Profiles
- 9.1 Air Products and Chemicals, Inc.
- 9.2 Axcel Gases
- 9.3 Ellenbarrie industrial Gases.
- 9.4 Gulfcryo
- 9.5 Linde PLC
- 9.6 Messer Group
- 9.7 Omega Air
- 9.8 PARKER HANNIFIN CORP
- 9.9 Praxair Technology, Inc.
- 9.10 Southern Industrial Gas
- 9.11 Universal Industrial Gases, Inc.
- 9.12 Yingde Gases Group


