

 |
市場調查報告書
商品編碼
1928898
儲水式熱水器市場機會、成長要素、產業趨勢分析及2026年至2035年預測Storage Water Heater Market Opportunity, Growth Drivers, Industry Trend Analysis, and Forecast 2026 - 2035 |
||||||
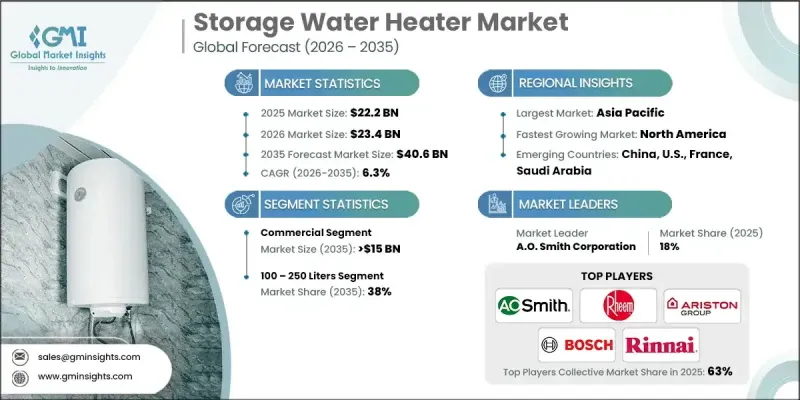
全球儲水式熱水器市場預計到 2025 年將達到 222 億美元,到 2035 年將達到 406 億美元,年複合成長率為 6.3%。
技術進步,例如更優良的隔熱材料、更智慧的控制系統和高效的熱交換器設計,提升了大容量熱水器的性能和易用性,從而推動了熱水器市場的成長。更嚴格的國家和國際能源效率標準,以及對永續熱水解決方案的持續投入,進一步促進了熱水器的普及。企業正優先考慮節能環保熱水器,以實現其永續性目標。同時,政府的獎勵、補貼和稅額扣抵也推動了商業和住宅熱水器的升級改造。與智慧電網和太陽能、地熱系統等再生能源來源的整合,可以最佳化能源利用、降低成本並減少對石化燃料的依賴。新興市場的都市化、生活水準的提高以及電氣化程度的提升,進一步推動了熱水器的普及,使其成為住宅和商業應用中不可或缺的組件。
| 市場覆蓋範圍 | |
|---|---|
| 開始年份 | 2025 |
| 預測年份 | 2026-2035 |
| 起始值 | 222億美元 |
| 預測金額 | 406億美元 |
| 複合年成長率 | 6.3% |
受家庭能源需求成長和日常可靠熱水需求的推動,預計到2035年,住宅市場將以5.5%的複合年成長率成長。節能型熱水器採用增強型隔熱材料、智慧溫控器,並與家庭能源系統整合,在降低能源費用的同時,也提升了便利性和性能。
預計到2035年,30公升容量的熱水器市場規模將達到40億美元,主要得益於小規模家庭、公寓和空間有限的場所對這類熱水器的青睞。這類熱水器非常適合廚房和浴室等即用即熱的場所,這些場所通常需要快速加熱且熱水需求量不大。新興經濟體的都市化加快、緊湊型住宅趨勢、價格可負擔性提高以及電氣化程度的提高,都推動了這個市場的成長。
預計到2025年,美國儲水式熱水器市場規模將達到30億美元,其成長主要得益於儲能技術的普及和對可再生能源計劃的大力投資。對可靠且永續的熱水解決方案的需求正在推動太陽能光電與儲能系統結合的應用。
目錄
第1章調查方法和範圍
第2章執行摘要
第3章業界考察
- 產業生態系統
- 原物料供應及採購分析
- 製造能力評估
- 供應鏈韌性與風險因素
- 配電網路分析
- 監管環境
- 產業影響因素
- 促進要素
- 產業潛在風險與挑戰
- 成長潛力分析
- 價格趨勢分析
- 按產能
- 按地區
- 成本結構分析
- 波特分析
- 供應商的議價能力
- 買方的議價能力
- 新進入者的威脅
- 替代品的威脅
- PESTEL 分析
- 新的機會與趨勢
- 數位化和物聯網整合
- 拓展新興市場
- 投資分析及未來展望
第4章 競爭情勢
- 介紹
- 公司市佔率分析
- 北美洲
- 歐洲
- 亞太地區
- 歐亞大陸
- CIS
- 中東和非洲
- 拉丁美洲
- 戰略儀錶板
- 策略舉措
- 創新與科技趨勢
第5章 依產能分類的市場規模及預測(2023-2035年)
- 少於30公升
- 30至100公升
- 100至250升
- 250至400升
- 超過400公升
第6章 依能源來源分類的市場規模及預測(2023-2035年)
- 電
- 氣體
第7章 依應用領域分類的市場規模及預測(2023-2035年)
- 住宅
- 商業的
- 學院和高等教育機構
- 辦公室
- 政府/軍隊
- 其他
第8章 2023-2035年各地區市場規模及預測
- 北美洲
- 美國
- 加拿大
- 歐洲
- 英國
- 法國
- 德國
- 義大利
- 奧地利
- 西班牙
- 荷蘭
- 丹麥
- 芬蘭
- 瑞典
- 挪威
- 亞太地區
- 中國
- 日本
- 韓國
- 印度
- 澳洲
- 印尼
- 馬來西亞
- 新加坡
- 泰國
- 紐西蘭
- 菲律賓
- 越南
- 歐亞大陸
- 俄羅斯
- 白俄羅斯
- 哈薩克
- 吉爾吉斯斯坦
- 亞美尼亞
- CIS
- 亞塞拜然
- 莫耳多瓦
- 塔吉克
- 土庫曼
- 烏茲別克
- 中東和非洲
- 沙烏地阿拉伯
- 阿拉伯聯合大公國
- 卡達
- 科威特
- 阿曼
- 土耳其
- 南非
- 奈及利亞
- 埃及
- 以色列
- 伊拉克
- 拉丁美洲
- 巴西
- 阿根廷
- 智利
- 墨西哥
第9章:公司簡介
- AO Smith
- Ariston Holding NV
- Bosch Thermotechnology Ltd.
- Bradford White Corporation, USA
- Essency
- Ferroli SpA
- Groupe Atlantic
- Havells India Ltd.
- Hubbell Heaters
- Haier Inc.
- Jaquar India
- Linuo Ritter International Co., Ltd.
- Nihon Itomic Co., Ltd.
- Rheem Manufacturing Company
- Rinnai America Corporation
- State Industries.
- Saudi Ceramics Company
- Viessmann
- Vaillant
- Whirlpool Corporation
The Global Storage Water Heater Market was valued at USD 22.2 billion in 2025 and is estimated to grow at a CAGR of 6.3% to reach USD 40.6 billion by 2035.
Growth is driven by technological advancements, including superior insulation materials, smarter control systems, and more efficient heat exchanger designs that enhance the performance and usability of large-capacity units. Rising adoption is further supported by stricter domestic and international energy efficiency standards, as well as increasing investments in sustainable water heating solutions. Businesses are prioritizing energy-efficient, environmentally friendly water heaters to meet corporate sustainability targets, while government incentives, rebates, and tax credits are motivating commercial and residential upgrades. Integration with smart grids and renewable energy sources, such as solar thermal and geothermal systems, enables optimized energy use, lower costs, and reduced reliance on fossil fuels. Urbanization, rising living standards, and electrification in emerging markets further bolster adoption, positioning storage water heaters as essential in both residential and commercial applications.
| Market Scope | |
|---|---|
| Start Year | 2025 |
| Forecast Year | 2026-2035 |
| Start Value | $22.2 Billion |
| Forecast Value | $40.6 Billion |
| CAGR | 6.3% |
The residential segment is expected to grow at a CAGR of 5.5% by 2035, driven by increased household energy demand and a need for reliable hot water for daily use. Energy-efficient models, equipped with enhanced insulation, smart thermostats, and home energy system integration, are reducing utility costs while improving convenience and performance.
The 30-liter category is projected to reach USD 4 billion by 2035, favored in smaller households, apartments, and space-constrained areas. These units are ideal for point-of-use applications, including kitchens and bathrooms, where quick heating and limited hot water requirements are common. Growth is supported by rising urbanization, compact housing trends, affordability, and expanding electrification in emerging economies.
U.S. Storage Water Heater Market reached USD 3 billion in 2025, with growth fueled by energy storage integration and strong investments in renewable energy projects. Solar-plus-storage adoption is increasing, driven by the demand for reliable, sustainable hot water solutions.
Key companies in the Global Storage Water Heater Market include Rheem Manufacturing Company, A.O. Smith, Ariston Holding N.V., Viessmann, Bosch Thermotechnology, Bradford White Corporation, Whirlpool Corporation, Linuo Ritter International Co., Jaquar India, Havells India Ltd., Nihon Itomic Co., Rinnai America Corporation, Ferroli S.p.A, Groupe Atlantic, Haier Inc., Essency, Hubbell Heaters, State Industries, Vaillant, and Saudi Ceramics Company. Industry players strengthen their presence by prioritizing innovation, sustainability, and energy efficiency. Companies invest heavily in R&D to develop high-performance, low-energy water heaters with smart controls and renewable integration. Expanding distribution networks across emerging and developed markets improves accessibility. Strategic collaborations with utility providers and government programs enable them to leverage incentives, rebates, and tax benefits. Enhanced after-sales services, predictive maintenance solutions, and digital monitoring systems improve customer satisfaction and loyalty.
Table of Contents
Chapter 1 Methodology & Scope
- 1.1 Research design
- 1.1.1 Research approach
- 1.1.2 Data collection methods
- 1.2 Base estimates and calculations
- 1.2.1 Base year calculation
- 1.2.2 Key trends for market estimates
- 1.3 Forecast model
- 1.3.1 Key trends for market estimates
- 1.3.1.1 Quantified market impact analysis
- 1.3.1.2 Mathematical impact of growth parameters on forecast
- 1.3.2 Scenario analysis framework
- 1.3.1 Key trends for market estimates
- 1.4 Primary research and validation
- 1.4.1 Some of the primary sources (but not limited to)
- 1.5 Data mining sources
- 1.5.1 Paid Sources
- 1.5.2 Sources, by region
- 1.6 Research trail & scoring components
- 1.6.1 Research trail components
- 1.6.2 Scoring components
- 1.7 Research transparency addendum
- 1.7.1 Source attribution framework
- 1.7.2 Quality assurance metrics
- 1.7.3 Our commitment to trust
- 1.8 Market definitions
Chapter 2 Executive Summary
- 2.1 Industry 360-degree synopsis, 2023 - 2035
- 2.2 Business trends
- 2.3 Capacity trends
- 2.4 Energy source trends
- 2.5 Application trends
- 2.6 Regional trends
Chapter 3 Industry Insights
- 3.1 Industry ecosystem
- 3.1.1 Raw material availability & sourcing analysis
- 3.1.2 Manufacturing capacity assessment
- 3.1.3 Supply chain resilience & risk factors
- 3.1.4 Distribution network analysis
- 3.2 Regulatory landscape
- 3.3 Industry impact forces
- 3.3.1 Growth drivers
- 3.3.2 Industry pitfalls & challenges
- 3.4 Growth potential analysis
- 3.5 Price trend analysis
- 3.5.1 By capacity
- 3.5.2 By region
- 3.6 Cost structure analysis
- 3.7 Porter';s analysis
- 3.7.1 Bargaining power of suppliers
- 3.7.2 Bargaining power of buyers
- 3.7.3 Threat of new entrants
- 3.7.4 Threat of substitutes
- 3.8 PESTEL analysis
- 3.8.1 Political factors
- 3.8.2 Economic factors
- 3.8.3 Social factors
- 3.8.4 Technological factors
- 3.8.5 Legal factors
- 3.8.6 Environmental factors
- 3.9 Emerging opportunities & trends
- 3.9.1 Digitalization & IoT integration
- 3.9.2 Emerging market penetration
- 3.10 Investment analysis and future outlook
Chapter 4 Competitive landscape, 2025
- 4.1 Introduction
- 4.2 Company market share analysis, 2024
- 4.2.1 North America
- 4.2.2 Europe
- 4.2.3 Asia Pacific
- 4.2.4 Eurasia
- 4.2.5 CIS
- 4.2.6 Middle East & Africa
- 4.2.7 Latin America
- 4.3 Strategic dashboard
- 4.4 Strategic initiatives
- 4.5 Innovation & technology landscape
Chapter 5 Market Size and Forecast, By Capacity, 2023 - 2035 (USD Billion & ‘000 Units)
- 5.1 Key trends
- 5.2 < 30 liters
- 5.3 30 -100 liters
- 5.4 100 - 250 liters
- 5.5 250 - 400 liters
- 5.6 > 400 liters
Chapter 6 Market Size and Forecast, By Energy Source, 2023 - 2035 (USD Billion & ‘000 Units)
- 6.1 Key trends
- 6.2 Electric
- 6.3 Gas
Chapter 7 Market Size and Forecast, By Application, 2023 - 2035 (USD Billion & ‘000 Units)
- 7.1 Key trends
- 7.2 Residential
- 7.3 Commercial
- 7.3.1 College/University
- 7.3.2 Offices
- 7.3.3 Government/Military
- 7.3.4 Others
Chapter 8 Market Size and Forecast, By Region, 2023 - 2035 (USD Billion & ‘000 Units)
- 8.1 Key trends
- 8.2 North America
- 8.2.1 U.S.
- 8.2.2 Canada
- 8.3 Europe
- 8.3.1 UK
- 8.3.2 France
- 8.3.3 Germany
- 8.3.4 Italy
- 8.3.5 Austria
- 8.3.6 Spain
- 8.3.7 Netherlands
- 8.3.8 Denmark
- 8.3.9 Finland
- 8.3.10 Sweden
- 8.3.11 Norway
- 8.4 Asia Pacific
- 8.4.1 China
- 8.4.2 Japan
- 8.4.3 South Korea
- 8.4.4 India
- 8.4.5 Australia
- 8.4.6 Indonesia
- 8.4.7 Malaysia
- 8.4.8 Singapore
- 8.4.9 Thailand
- 8.4.10 New Zealand
- 8.4.11 Philippines
- 8.4.12 Vietnam
- 8.5 Eurasia
- 8.5.1 Russia
- 8.5.2 Belarus
- 8.5.3 Kazakhstan
- 8.5.4 Kyrgyzstan
- 8.5.5 Armenia
- 8.6 CIS
- 8.6.1 Azerbaijan
- 8.6.2 Moldova
- 8.6.3 Tajikistan
- 8.6.4 Turkmenistan
- 8.6.5 Uzbekistan
- 8.7 Middle East & Africa
- 8.7.1 Saudi Arabia
- 8.7.2 UAE
- 8.7.3 Qatar
- 8.7.4 Kuwait
- 8.7.5 Oman
- 8.7.6 Turkey
- 8.7.7 South Africa
- 8.7.8 Nigeria
- 8.7.9 Egypt
- 8.7.10 Israel
- 8.7.11 Iraq
- 8.8 Latin America
- 8.8.1 Brazil
- 8.8.2 Argentina
- 8.8.3 Chile
- 8.8.4 Mexico
Chapter 9 Company Profiles
- 9.1 A.O. Smith
- 9.2 Ariston Holding N.V.
- 9.3 Bosch Thermotechnology Ltd.
- 9.4 Bradford White Corporation, USA
- 9.5 Essency
- 9.6 Ferroli S.p.A
- 9.7 Groupe Atlantic
- 9.8 Havells India Ltd.
- 9.9 Hubbell Heaters
- 9.10 Haier Inc.
- 9.11 Jaquar India
- 9.12 Linuo Ritter International Co., Ltd.
- 9.13 Nihon Itomic Co., Ltd.
- 9.14 Rheem Manufacturing Company
- 9.15 Rinnai America Corporation
- 9.16 State Industries.
- 9.17 Saudi Ceramics Company
- 9.18 Viessmann
- 9.19 Vaillant
- 9.20 Whirlpool Corporation
 熱水器市場:按產品類型、類型、應用和地區分類
 熱水器市場:2026-2032年全球市場預測(依能源來源、安裝類型、容量、應用、銷售管道及安裝類型分類)瓦斯熱水器市場:依產品類型、技術、燃料類型、安裝類型、容量、應用、通路分類,全球預測(2026-2032年)房車無水箱熱水器市場按燃料類型、房車類型、安裝類型、容量範圍、技術類型、銷售管道和最終用戶分類,全球預測,2026-2032年
 工業熱水器市場分析及預測(至2035年):依類型、產品類型、服務、技術、組件、應用、最終用戶、功能、安裝類型分類房車熱水器市場按類型、燃料類型、車輛類型和分銷管道分類-2026-2032年全球預測
 全球熱水器市場(2025 年)
 日本熱水器市場規模、佔有率、趨勢及預測(按產品類型、應用和地區分類,2026-2034年)
 熱水器市場規模、佔有率和成長分析(按類型、技術、產品類型、容量、應用和地區分類)-2026-2033年產業預測
 儲水式熱水器市場規模、佔有率和成長分析(按能源來源、水箱容量、材質、最終用戶和地區分類)—2026-2033年產業預測