

 |
市場調查報告書
商品編碼
1928877
環境感測器市場機會、成長要素、產業趨勢分析及2026年至2035年預測Environmental Sensors Market Opportunity, Growth Drivers, Industry Trend Analysis, and Forecast 2026 - 2035 |
||||||
全球環境感測器市場預計到 2025 年將達到 22 億美元,到 2035 年將達到 63 億美元,年複合成長率為 11.1%。
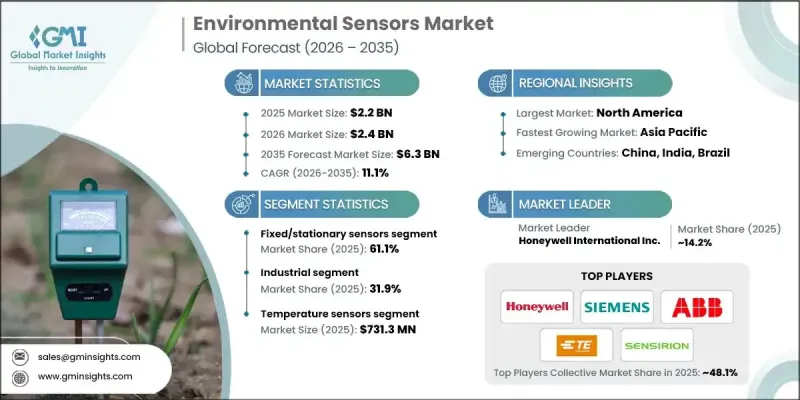
市場成長的促進因素包括:日益嚴格的工業排放法規、無線和互聯感測平台的普及、農業領域環境監測的日益廣泛應用,以及智慧城市計劃和物聯網基礎設施的加速部署。環境感測器在永續城市管理、工業安全和精密農業中正變得至關重要,能夠即時監測空氣品質、水資源、土壤健康和生物多樣性。這推動了對互聯感測器網路的需求,這些網路能夠實現預測分析、最佳化營運和數據驅動的決策。預計到2030年,大多數城市和工業設施將依靠完全整合的感測器網路來提高多個領域的效率、安全性和永續性。
| 市場覆蓋範圍 | |
|---|---|
| 開始年份 | 2025 |
| 預測年份 | 2026-2035 |
| 起始值 | 22億美元 |
| 預測金額 | 63億美元 |
| 複合年成長率 | 11.1% |
預計到2025年,固定式感測器市場佔有率將達到61.1%。這些感測器廣泛應用於工業工廠、市政系統以及用水和污水處理廠,用於提供連續、精確的監測。它們對於合規性、環境管理和製程控制至關重要,能夠確保可靠運作並與自動化系統無縫整合。
預計到2025年,工業領域將佔31.9%的市場佔有率。工業領域高度依賴環境感測器進行流程管理、排放控制、遵守安全標準、降低營運風險。嚴格的監管要求以及製造業、加工業和重工業等產業對高效安全營運的需求,是推動這項需求的主要因素。
預計到2025年,北美環境感測器市場佔有率將達到29.8%。該地區的成長主要得益於嚴格的法規結構以及對空氣品質、職場安全和排放控制日益成長的關注。在先進的智慧城市計畫和監管合規要求的支持下,物聯網無線感測器在城市規劃、交通運輸和工業應用中的普及速度正在加快。
目錄
第1章調查方法和範圍
第2章執行摘要
第3章業界考察
- 生態系分析
- 供應商情況
- 利潤率
- 成本結構
- 每個階段的附加價值
- 影響價值鏈的因素
- 中斷
- 產業影響因素
- 促進要素
- 不斷擴大的工業排放和安全法規
- 互聯/無線工業感測平台的發展
- 農業領域環境感測技術的日益普及
- 對空氣和水質合規性監測的需求日益成長
- 智慧城市和物聯網基礎設施應用成長
- 產業潛在風險與挑戰
- 高精度、多參數感測解決方案高成本
- 互通性限制和校準複雜性
- 市場機遇
- 將人工智慧驅動的預測分析整合到環境感測中
- 攜帶式和穿戴式感測設備的興起
- 促進要素
- 成長潛力分析
- 監管環境
- 北美洲
- 歐洲
- 亞太地區
- 拉丁美洲
- 中東和非洲
- 波特分析
- PESTEL 分析
- 科技與創新趨勢
- 當前技術趨勢
- 新興技術
- 價格趨勢
- 按地區
- 依產品
- 定價策略
- 新興經營模式
- 合規要求
- 專利和智慧財產權分析
- 地緣政治和貿易趨勢
第4章 競爭情勢
- 介紹
- 公司市佔率分析
- 按地區
- 北美洲
- 歐洲
- 亞太地區
- 拉丁美洲
- 中東和非洲
- 市場集中度分析
- 按地區
- 主要企業的競爭標竿分析
- 財務績效比較
- 收入
- 利潤率
- 研究與開發
- 產品系列比較
- 產品線的廣度
- 科技
- 創新
- 地理分佈比較
- 全球擴張分析
- 服務網路覆蓋
- 按地區分類的市場滲透率
- 競爭定位矩陣
- 領導企業
- 受讓人
- 追蹤者
- 小眾玩家
- 戰略展望矩陣
- 財務績效比較
- 重大進展
- 併購
- 夥伴關係與合作
- 技術進步
- 擴張與投資策略
- 數位轉型計劃
- 新興/Start-Ups競賽的趨勢
第5章 依感測器類型分類的市場估算與預測,2022-2035年
- 壓力感測器
- 溫度感測器
- 濕度感測器
- 氣體感測器
- 噪音和聲波感測器
- 震動和地震感測器
- 其他
第6章 按類型分類的市場估算與預測,2022-2035年
- 固定/靜止感測器
- 攜帶式/移動式感應器
第7章 依連接方式分類的市場估計與預測,2022-2035年
- 有線感應器
- 無線感測器
第8章 按應用領域分類的市場估算與預測,2022-2035年
- 空氣品質監測
- 水質監測
- 土壤和土地監測
- 噪音和振動監測
- 天氣和氣象監測
- 其他
9. 2022-2035年按最終用途產業分類的市場估算與預測
- 產業
- 化學製造
- 食品/飲料加工
- 製藥生產
- 金屬和採礦
- 紙漿和造紙
- 石油和天然氣
- 其他
- 能源與公共產業
- 發電
- 水和污水處理
- 可再生能源設施
- 其他
- 智慧城市基礎設施
- 城市空氣品質網路
- 智慧水系統
- 交通/運輸監控
- 其他
- 建築自動化
- 商業大樓和辦公大樓
- 住宅
- 醫院和醫療設施
- 資料中心
- 其他
- 農業
- 精密農業
- 溫室栽培可控農業
- 畜牧管理
- 水產養殖
- 其他
第10章 2022-2035年各地區市場估計與預測
- 北美洲
- 美國
- 加拿大
- 歐洲
- 德國
- 英國
- 法國
- 西班牙
- 義大利
- 荷蘭
- 亞太地區
- 中國
- 印度
- 日本
- 澳洲
- 韓國
- 拉丁美洲
- 巴西
- 墨西哥
- 阿根廷
- 中東和非洲
- 南非
- 沙烏地阿拉伯
- 阿拉伯聯合大公國
第11章 公司簡介
- 主要企業
- ABB Ltd.
- Honeywell International Inc.
- Siemens AG
- Texas Instruments Incorporated
- 按地區分類的主要企業
- 北美洲
- Analog Devices, Inc.
- Emerson Electric Co.
- TE Connectivity Ltd.
- NXP Semiconductors
- 亞太地區
- Murata Manufacturing Co., Ltd.
- Omron Corporation
- Renesas Electronics Corporation
- 歐洲
- ams-OSRAM AG
- Bosch Sensortec GmbH
- STMicroelectronics NV
- Sensirion AG
- 北美洲
- 小眾玩家/顛覆者
- Amphenol Advanced Sensors
- Hach Company
- Vaisala
- Zebra Technologies
The Global Environmental Sensors Market was valued at USD 2.2 billion in 2025 and is estimated to grow at a CAGR of 11.1% to reach USD 6.3 billion by 2035.
Market expansion is fueled by increasing industrial emission regulations, the rise of wireless and connected sensing platforms, greater adoption of environmental monitoring in agriculture, and the accelerated implementation of smart city projects and IoT-enabled infrastructure. Environmental sensors are becoming essential for sustainable urban management, industrial safety, and precision agriculture, allowing real-time monitoring of air quality, water resources, soil health, and biodiversity. The demand for connected sensor networks is growing, enabling predictive analytics, optimized operations, and data-driven decision-making. By 2030, most cities and industrial facilities are expected to rely on fully integrated sensor networks for enhanced efficiency, safety, and sustainability across multiple sectors.
| Market Scope | |
|---|---|
| Start Year | 2025 |
| Forecast Year | 2026-2035 |
| Start Value | $2.2 Billion |
| Forecast Value | $6.3 Billion |
| CAGR | 11.1% |
The fixed and stationary sensors segment accounted for 61.1% share in 2025. These sensors are widely used because they provide continuous, accurate monitoring in industrial plants, urban systems, and water and wastewater facilities. They are critical for regulatory compliance, environmental management, and process control, enabling reliable operations and seamless integration with automated systems.
The industrial sector held 31.9% share in 2025. Industries rely heavily on environmental sensors to manage processes, control emissions, comply with safety standards, and mitigate operational risks. Sectors such as manufacturing, processing, and heavy industry drive demand due to strict regulatory requirements and the need for efficient, safe operations.
North America Environmental Sensors Market held a 29.8% share in 2025. Growth in the region is driven by stringent regulatory frameworks, rising concern for air quality, workplace safety, and emissions control. Adoption of IoT-enabled and wireless sensors across urban planning, transportation, and industrial applications is accelerating, supported by advanced smart city initiatives and regulatory compliance requirements.
Leading companies in the Global Environmental Sensors Market include Honeywell International Inc., Siemens AG, Bosch Sensortec GmbH, Murata Manufacturing Co., Ltd., STMicroelectronics N.V., TE Connectivity Ltd., ABB Ltd., ams OSRAM AG, Analog Devices, Inc., NXP Semiconductors, Sensirion AG, Omron Corporation, Renesas Electronics Corporation, Emerson Electric Co., Hach Company, Zebra Technologies, Vaisala, and Texas Instruments Incorporated. Companies in the Global Environmental Sensors Market are strengthening their market position by focusing on product innovation, developing sensors with enhanced accuracy, wireless capabilities, and IoT integration. Many are investing in strategic partnerships with smart city planners and industrial operators to expand adoption. Geographic expansion into emerging regions with rising urbanization and industrialization is a key strategy. Firms are also emphasizing sustainable and energy-efficient sensor technologies to meet regulatory requirements and corporate ESG goals.
Table of Contents
Chapter 1 Methodology and Scope
- 1.1 Market scope and definition
- 1.2 Research design
- 1.2.1 Research approach
- 1.2.2 Data collection methods
- 1.3 Data mining sources
- 1.3.1 Global
- 1.3.2 Regional/Country
- 1.4 Base estimates and calculations
- 1.4.1 Base year calculation
- 1.4.2 Key trends for market estimation
- 1.5 Primary research and validation
- 1.5.1 Primary sources
- 1.6 Forecast model
- 1.7 Research assumptions and limitations
Chapter 2 Executive Summary
- 2.1 Industry 360° synopsis, 2022 - 2035
- 2.2 Key market trends
- 2.2.1 Sensor type trends
- 2.2.2 Type trends
- 2.2.3 Connectivity trends
- 2.2.4 Application trends
- 2.2.5 End Use industry trends
- 2.2.6 Regional trends
- 2.3 TAM Analysis, 2026-2035
- 2.4 CXO perspectives: Strategic imperatives
- 2.4.1 Executive decision points
- 2.4.2 critical success factors
- 2.5 Future outlook and strategic recommendations
Chapter 3 Industry Insights
- 3.1 Industry ecosystem analysis
- 3.1.1 Supplier Landscape
- 3.1.2 Profit Margin
- 3.1.3 Cost structure
- 3.1.4 Value addition at each stage
- 3.1.5 Factor affecting the value chain
- 3.1.6 Disruptions
- 3.2 Industry impact forces
- 3.2.1 Growth drivers
- 3.2.1.1 Expansion of industrial emissions and safety regulations
- 3.2.1.2 Growth of connected/wireless industrial sensing platforms
- 3.2.1.3 Increasing adoption of environmental sensing in agriculture
- 3.2.1.4 Rising demand for air and water quality compliance monitoring
- 3.2.1.5 Smart city and IoT infrastructure deployment growth
- 3.2.2 Industry pitfalls and challenges
- 3.2.2.1 High cost of precision and multi-parameter sensing solutions
- 3.2.2.2 Limited interoperability and calibration complexities
- 3.2.3 Market opportunities
- 3.2.3.1 Integration of AI-driven predictive analytics in environmental sensing
- 3.2.3.2 Expansion of portable and wearable sensing devices
- 3.2.1 Growth drivers
- 3.3 Growth potential analysis
- 3.4 Regulatory landscape
- 3.4.1 North America
- 3.4.2 Europe
- 3.4.3 Asia Pacific
- 3.4.4 Latin America
- 3.4.5 Middle East & Africa
- 3.5 Porter';s analysis
- 3.6 PESTEL analysis
- 3.7 Technology and Innovation landscape
- 3.7.1 Current technological trends
- 3.7.2 Emerging technologies
- 3.8 Price trends
- 3.8.1 By region
- 3.8.2 By product
- 3.9 Pricing Strategies
- 3.10 Emerging Business Models
- 3.11 Compliance Requirements
- 3.12 Patent and IP analysis
- 3.13 Geopolitical and trade dynamics
Chapter 4 Competitive Landscape, 2025
- 4.1 Introduction
- 4.2 Company market share analysis
- 4.2.1 By region
- 4.2.1.1 North America
- 4.2.1.2 Europe
- 4.2.1.3 Asia Pacific
- 4.2.1.4 Latin America
- 4.2.1.5 Middle East & Africa
- 4.2.2 Market concentration analysis
- 4.2.1 By region
- 4.3 Competitive benchmarking of key players
- 4.3.1 Financial performance comparison
- 4.3.1.1 Revenue
- 4.3.1.2 Profit margin
- 4.3.1.3 R&D
- 4.3.2 Product portfolio comparison
- 4.3.2.1 Product range breadth
- 4.3.2.2 Technology
- 4.3.2.3 Innovation
- 4.3.3 Geographic presence comparison
- 4.3.3.1 Global footprint analysis
- 4.3.3.2 Service network coverage
- 4.3.3.3 Market penetration by region
- 4.3.4 Competitive positioning matrix
- 4.3.4.1 Leaders
- 4.3.4.2 Challengers
- 4.3.4.3 Followers
- 4.3.4.4 Niche players
- 4.3.5 Strategic outlook matrix
- 4.3.1 Financial performance comparison
- 4.4 Key developments
- 4.4.1 Mergers and acquisitions
- 4.4.2 Partnerships and collaborations
- 4.4.3 Technological advancements
- 4.4.4 Expansion and investment strategies
- 4.4.5 Digital transformation initiatives
- 4.5 Emerging/ startup competitors landscape
Chapter 5 Market Estimates and Forecast, By Sensor Type, 2022 - 2035 (USD Million & Units)
- 5.1 Key trends
- 5.2 Pressure sensors
- 5.3 Temperature sensors
- 5.4 Humidity sensors
- 5.5 Gas sensors
- 5.6 Noise & acoustic sensors
- 5.7 Vibration & seismic sensors
- 5.8 Others
Chapter 6 Market Estimates and Forecast, By Type, 2022 - 2035 (USD Million & Units)
- 6.1 Key trends
- 6.2 Fixed/stationary sensors
- 6.3 Portable/mobile sensors
Chapter 7 Market Estimates and Forecast, By Connectivity, 2022 - 2035 (USD Million & Units)
- 7.1 Key trends
- 7.2 Wired sensors
- 7.3 Wireless sensors
Chapter 8 Market Estimates and Forecast, By Application, 2022 - 2035 (USD Million & Units)
- 8.1 Key trends
- 8.2 Air quality monitoring
- 8.3 Water quality monitoring
- 8.4 Soil & land monitoring
- 8.5 Noise & vibration monitoring
- 8.6 Weather & meteorological monitoring
- 8.7 Others
Chapter 9 Market Estimates and Forecast, By End Use Industry, 2022 - 2035 (USD Million & Units)
- 9.1 Key trends
- 9.2 Industrial
- 9.2.1 Chemical manufacturing
- 9.2.2 Food & beverage processing
- 9.2.3 Pharmaceutical manufacturing
- 9.2.4 Metals & mining
- 9.2.5 Pulp & paper
- 9.2.6 Oil & gas
- 9.2.7 Others
- 9.3 Energy & utilities
- 9.3.1 Power generation
- 9.3.2 Water & wastewater treatment
- 9.3.3 Renewable energy facilities
- 9.3.4 Others
- 9.4 Smart cities & infrastructure
- 9.4.1 Urban air quality networks
- 9.4.2 Smart water systems
- 9.4.3 Traffic & transportation monitoring
- 9.4.4 Others
- 9.5 Building automation
- 9.5.1 Commercial buildings & offices
- 9.5.2 Residential buildings
- 9.5.3 Hospitals & healthcare facilities
- 9.5.4 Data centers
- 9.5.5 Others
- 9.6 Agriculture
- 9.6.1 Precision farming
- 9.6.2 Greenhouse & controlled agriculture
- 9.6.3 Livestock management
- 9.6.4 Aquaculture
- 9.7 Others
Chapter 10 Market Estimates and Forecast, By Region, 2022 - 2035 (USD Million & Units)
- 10.1 Key trends
- 10.2 North America
- 10.2.1 U.S.
- 10.2.2 Canada
- 10.3 Europe
- 10.3.1 Germany
- 10.3.2 UK
- 10.3.3 France
- 10.3.4 Spain
- 10.3.5 Italy
- 10.3.6 Netherlands
- 10.4 Asia Pacific
- 10.4.1 China
- 10.4.2 India
- 10.4.3 Japan
- 10.4.4 Australia
- 10.4.5 South Korea
- 10.5 Latin America
- 10.5.1 Brazil
- 10.5.2 Mexico
- 10.5.3 Argentina
- 10.6 Middle East and Africa
- 10.6.1 South Africa
- 10.6.2 Saudi Arabia
- 10.6.3 UAE
Chapter 11 Company Profiles
- 11.1 Global Key Players
- 11.1.1 ABB Ltd.
- 11.1.2 Honeywell International Inc.
- 11.1.3 Siemens AG
- 11.1.4 Texas Instruments Incorporated
- 11.2 Regional key players
- 11.2.1 North America
- 11.2.1.1 Analog Devices, Inc.
- 11.2.1.2 Emerson Electric Co.
- 11.2.1.3 TE Connectivity Ltd.
- 11.2.1.4 NXP Semiconductors
- 11.2.2 Asia Pacific
- 11.2.2.1 Murata Manufacturing Co., Ltd.
- 11.2.2.2 Omron Corporation
- 11.2.2.3 Renesas Electronics Corporation
- 11.2.3 Europe
- 11.2.3.1 ams-OSRAM AG
- 11.2.3.2 Bosch Sensortec GmbH
- 11.2.3.3 STMicroelectronics N.V.
- 11.2.3.4 Sensirion AG
- 11.2.1 North America
- 11.3 Niche Players/Disruptors
- 11.3.1 Amphenol Advanced Sensors
- 11.3.2 Hach Company
- 11.3.3 Vaisala
- 11.3.4 Zebra Technologies
 環境感測器市場:類型、功能、連接方式、部署方法、應用和最終用途 - 全球市場預測 2026-2032
 2026年全球氣球環境感測器和顯示器市場報告
 工業IoT感測器市場預測至2034年:按感測器類型、連接方式、部署模式、應用、最終用戶和地區分類的全球分析2026年全球環境感測器市場報告
 太陽能感測器市場規模、佔有率和成長分析:按組件類型、感測器類型、技術、終端用戶產業、地區分類 - 2026-2033 年產業預測
 環境感測器市場分析及預測(至2035年):依類型、產品類型、技術、組件、應用、最終用戶、功能、安裝類型、設備及解決方案分類全球儲能安全與監控系統市場:預測(至2034年)-按電池類型、技術、應用和地區分類的分析2026年全球被動式空氣監測感測器市場報告Wi-Fi 雨量計市場按產品類型、安裝類型、分銷管道、應用和最終用戶分類,全球預測,2026-2032 年熱敏電阻器感測器市場按感測器類型、材料體系、銷售管道、電阻範圍、應用和最終用戶產業分類-2026-2032年全球預測