


 |
市場調查報告書
商品編碼
1913472
乾散貨航運市場機會、成長要素、產業趨勢分析及預測(2026年至2035年)Dry Bulk Shipping Market Opportunity, Growth Drivers, Industry Trend Analysis, and Forecast 2026 - 2035 |
||||||
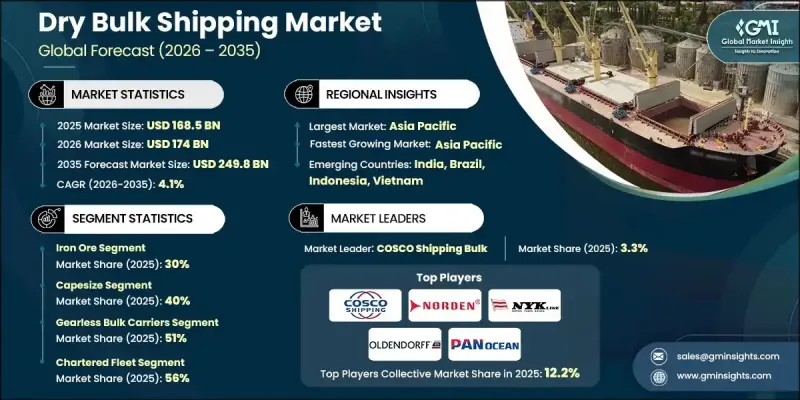
全球乾散貨航運市場預計到 2025 年將達到 1,685 億美元,到 2035 年將達到 2,498 億美元,年複合成長率為 4.1%。
市場發展與全球貿易活動和不斷演變的法規結構密切相關,這些因素正在重塑船隊營運和租船趨勢。船舶能源效率和排放性能方面的合規要求正日益影響船舶部署決策和營運成本。據報道,全球幹散裝貨船隊中很大一部分的能源效率低於推薦基準,這促使船東加快投資,以提高燃油效率和實現船隊現代化。針對能源效率和碳排放強度的監管措施正在推動環保船舶的引入,從而顯著降低燃油消費量和排放。此外,支援更高效船隊營運的數位化海事技術的整合正在提升行業績效。先進的分析和管理平台有助於最佳化航線、維護計劃和燃油管理,並有助於應對擁塞挑戰和運費波動。這些因素共同作用,使效率、合規性和數位化能力成為塑造乾散貨航運市場長期發展的核心驅動力。
| 市場覆蓋範圍 | |
|---|---|
| 開始年份 | 2025 |
| 預測年份 | 2026-2035 |
| 起始值 | 1685億美元 |
| 預測金額 | 2498億美元 |
| 複合年成長率 | 4.1% |
2025年,大型乾散貨航運將佔據45%的市場佔有率,並將採用船隊管理和預測分析解決方案進行營運。據悉,這些系統能夠幫助航運公司改善航程規劃、減少非計畫性停機時間、高效管理燃油消耗,並減輕港口擁塞和運費波動造成的損失。
預計到2025年,好望角型散裝貨船市佔率將達到40%,2026年至2035年的複合年成長率將達到4.3%。就載貨量而言,好望角型散裝貨船是乾散貨船隊中最大的船型。根據業內估計,到2024年,這類船舶將佔全球乾散貨船隊總載重噸位的約40%,主要用於支持主要國際貿易走廊的長途運輸。
預計到2025年,無齒輪傳動散裝貨船市場佔有率將達到51%。這類船舶的特色是船上沒有貨物裝卸設施,2024年其載重噸位佔全球乾散貨總載重噸位的55%。它們的廣泛應用歸功於其高營運效率和與現代港口基礎設施的兼容性。
預計到 2025 年,中國乾散貨航運市場將佔全球市場的 66%,創造 538 億美元的收入。中國的主導地位源自於其作為關鍵原料進口大國的地位:官方貿易數據顯示,中國 2024 年將進口超過 12 億噸鐵礦石,約佔全球海運量的 70%。
目錄
第1章調查方法
第2章執行摘要
第3章業界考察
- 生態系分析
- 供應商情況
- 利潤率分析
- 成本結構
- 每個階段的附加價值
- 影響價值鏈的因素
- 中斷
- 產業影響因素
- 促進要素
- 全球海上貿易日益成長
- 工業和鋼鐵生產成長
- 擴大農業貿易
- 艦隊現代化和效率
- 產業潛在風險與挑戰
- 港口擁擠和基礎設施瓶頸
- 包機費率波動
- 市場機遇
- 船隊更新環保高效船舶
- 貿易路線多元化
- 與數位化航運解決方案整合
- 成長潛力分析
- 監管環境
- 北美洲
- 美國海岸警衛隊防衛隊(USCG)海上安全條例
- 美國環保署(EPA)船舶排放標準
- 瓊斯法案合規性和沿海航運規則
- 歐洲
- 歐洲海事安全局 (EMSA) 指南
- 歐盟硫排放法規及《國際防止船舶造成污染公約》附則六標準
- 歐盟船舶安全認證條例
- 歐盟型式核准和船旗國要求
- 遵守壓艙水管理公約
- 港口國調查(PSC)
- 亞太地區
- 中國船舶排放標準與MARPOL合規性
- 印度航運總局規章
- 日本船舶安全與燃油效率標準
- 東協海事法規和區域準則
- 大型船舶作業安全標準
- 拉丁美洲
- 巴西國家水路運輸局 (ANTAQ) 標準
- 阿根廷船舶安全與環境法規
- 墨西哥交通運輸部部(SCT)船舶標準
- 南方共同市場海運法規的一致性
- 中東和非洲
- 阿拉伯聯合大公國聯邦海事法
- 沙烏地阿拉伯港務局和海事法規
- 南非海事安全局 (SAMSA) 條例
- 東非共同體(EAC)海事和航運標準
- 北美洲
- 波特五力分析
- PESTEL 分析
- 科技與創新趨勢
- 當前技術趨勢
- 新興技術
- 價格趨勢
- 按地區
- 依產品
- 成本細分分析
- 船舶購置成本
- 船員和人員配備成本
- 營運和維護成本
- 監理和合規成本
- 燃料和船用燃料成本
- 專利分析
- 永續性和環境方面
- 永續實踐
- 減少廢棄物策略
- 生產中的能源效率
- 環保舉措
- 碳足跡考量
- 乾散貨航運脫碳之路
- 國際海事組織(IMO)2030/2050目標的影響
- 燃料選擇:液化天然氣、甲醇、氨、生質燃料
- 改造與新建建築脫碳的經濟比較
- 碳定價及其對排放權交易體系(ETS)的影響
- 艦隊供需平衡與訂單分析
- 平衡車隊運作和需求成長
- 按船舶等級分析訂單
- 拆除和處置趨勢
- 淨船隊成長預測(2026-2035 年)
- 運費和租船合約分析
- 定期租船和單次航次合約的趨勢
- 現貨和合約市場分析
- 波羅的海乾散貨指數(BDI)歷史資料及預測
- 票價波動及風險緩解策略
- 租船人和船東之間的談判動態
- 新船和造船廠現狀
- 按船廠和國家訂單狀態
- 新船價趨勢
- 船廠產能受限
- 交貨延誤及延誤風險
第4章 競爭情勢
- 介紹
- 公司市佔率分析
- 北美洲
- 歐洲
- 亞太地區
- 拉丁美洲
- 中東和非洲
- 主要市場公司的競爭分析
- 競爭定位矩陣
- 戰略展望矩陣
- 重大進展
- 併購
- 夥伴關係與合作
- 新產品發布
- 企業擴張計畫和資金籌措
第5章 2022-2035年按產品分類的市場估算與預測
- 鐵礦石
- 煤炭
- 糧食
- 礬土
- 鎳
- 鋼
- 肥料
- 其他
第6章 按船舶類型分類的市場估算與預測,2022-2035年
- 好望角型
- 尺寸方便攜帶
- 巴拿馬型
- 輕便極限型型
- 其他
7. 2022-2035年按設計分類的市場估算與預測
- 無齒輪傳動散貨船
- 傳統散裝貨船
- 複合散貨船
- 自排放
- 布爾克湖人隊
- 其他
第8章 2022-2035年各細分市場的估計與預測
- 自有車輛
- 包租船隊
第9章 依貿易路線分類的市場估計與預測,2022-2035年
- 長途貿易
- 近海貿易
第10章 2022-2035年各地區市場估計與預測
- 北美洲
- 美國
- 加拿大
- 歐洲
- 德國
- 英國
- 法國
- 義大利
- 西班牙
- 俄羅斯
- 北歐國家
- 荷蘭
- 瑞典
- 亞太地區
- 中國
- 印度
- 日本
- 澳洲
- 韓國
- 新加坡
- 泰國
- 印尼
- 越南
- 拉丁美洲
- 巴西
- 墨西哥
- 阿根廷
- 中東和非洲
- 南非
- 沙烏地阿拉伯
- 阿拉伯聯合大公國
- 土耳其
第11章 公司簡介
- 世界玩家
- COSCO Shipping Bulk
- Oldendorff Carriers
- Pacific Basin
- Star Bulk
- Golden Ocean
- Diana Shipping
- Genco Shipping &Trading
- Bahri Dry Bulk
- Polsteam
- Eastern Bulk
- 區域玩家
- Eagle Bulk Shipping
- Navios Maritime Partners
- Safe Bulkers
- Fednav
- Belships
- 新興企業/顛覆者
- Scorpio Bulkers
- Ultrabulk
- Western Bulk
- Wilson Shipping
- VARAMAR
The Global Dry Bulk Shipping Market was valued at USD 168.5 billion in 2025 and is estimated to grow at a CAGR of 4.1% to reach USD 249.8 billion by 2035.
Market development is closely tied to global trade activity and evolving regulatory frameworks that are reshaping fleet operations and charter dynamics. Compliance requirements related to vessel efficiency and emissions performance are increasingly influencing deployment decisions and operating costs. A large share of the global dry bulk fleet is reported to fall below preferred efficiency ratings, prompting shipowners to accelerate investments aimed at improving fuel performance and modernizing fleets. Regulatory measures targeting energy efficiency and carbon intensity have driven higher adoption of environmentally optimized vessels, contributing to measurable reductions in fuel consumption and emissions. Industry performance is further being enhanced through the integration of digital shipping technologies that support more efficient fleet utilization. Advanced analytics and management platforms are improving route optimization, maintenance planning, and fuel management, while also helping operators respond to congestion challenges and fluctuating freight conditions. These combined factors are positioning efficiency, compliance, and digital capability as central drivers shaping the long-term evolution of the dry bulk shipping market.
| Market Scope | |
|---|---|
| Start Year | 2025 |
| Forecast Year | 2026-2035 |
| Start Value | $168.5 Billion |
| Forecast Value | $249.8 Billion |
| CAGR | 4.1% |
The large dry bulk vessels segment held 45% share in 2025, operating with fleet management and predictive analytics solutions. These systems are described as enabling shipping companies to enhance voyage planning, reduce unplanned downtime, manage fuel usage more effectively, and limit disruptions caused by congestion at merchant ports and volatile freight rates.
The capesize segment held 40% share in 2025 and is projected to grow at a CAGR of 4.3% from 2026 to 2035. Capesize vessels are identified as the largest category within the dry bulk fleet by carrying capacity. Industry assessments indicate that these vessels represented approximately 40% of global dry bulk fleet deadweight tonnage in 2024, primarily supporting long-haul transportation along major international trade corridors.
The gearless bulk carriers segment held a 51% share in 2025. These vessels are characterized by the absence of onboard cargo-handling equipment and represented 55% of total global dry bulk cargo deadweight tonnage in 2024. Their widespread use is attributed to operational efficiency and compatibility with modern port infrastructure.
China Dry Bulk Shipping Market held 66% share, generating USD 53.8 billion in 2025. The country's dominance is linked to its role as a major importer of key raw materials. Official trade data indicate that more than 1.2 billion tons of iron ore were imported in 2024, representing close to 70% of global seaborne volumes.
Key participants active in the Global Dry Bulk Shipping Market include COSCO Shipping Bulk, Star Bulk, Pacific Basin, Oldendorff Carriers, Golden Ocean, Diana Shipping, Genco Shipping & Trading, Polsteam, Bahri, and Eastern Bulk. Companies operating in the Global Dry Bulk Shipping Market are strengthening their market position by prioritizing fleet efficiency, regulatory compliance, and digital transformation. Many operators are investing in newer vessels and retrofitting existing fleets to improve energy performance and meet evolving environmental standards. Adoption of data-driven fleet management platforms is being used to enhance operational visibility and cost control. Strategic fleet renewal programs and long-term charter agreements are helping stabilize earnings and reduce exposure to market volatility. Geographic diversification of trade routes is also being pursued to balance demand fluctuations.
Table of Contents
Chapter 1 Methodology
- 1.1 Research approach
- 1.2 Quality Commitments
- 1.2.1 GMI AI policy & data integrity commitment
- 1.2.1.1 Source consistency protocol
- 1.2.1 GMI AI policy & data integrity commitment
- 1.3 Research Trail & Confidence Scoring
- 1.3.1 Research Trail Components
- 1.3.2 Scoring Components
- 1.4 Data Collection
- 1.4.1 Partial list of primary sources
- 1.5 Data mining sources
- 1.5.1 Paid sources
- 1.5.1.1 Sources, by region
- 1.5.1 Paid sources
- 1.6 Base estimates and calculations
- 1.6.1 Base year calculation for any one approach
- 1.7 Forecast model
- 1.7.1 Quantified market impact analysis
- 1.7.1.1 Mathematical impact of growth parameters on forecast
- 1.7.1 Quantified market impact analysis
- 1.8 Research transparency addendum
- 1.8.1 Source attribution framework
- 1.8.2 Quality assurance metrics
- 1.8.3 Our commitment to trust
Chapter 2 Executive Summary
- 2.1 Industry 360° synopsis, 2022 - 2035
- 2.2 Key market trends
- 2.2.1 Regional
- 2.2.2 Commodity
- 2.2.3 Vessel
- 2.2.4 Design
- 2.2.5 Operation
- 2.2.6 Trade Route
- 2.3 TAM Analysis, 2026-2035
- 2.4 CXO perspectives: Strategic imperatives
- 2.4.1 Executive decision points
- 2.4.2 Critical success factors
- 2.5 Future outlook and strategic recommendations
Chapter 3 Industry Insights
- 3.1 Industry ecosystem analysis
- 3.1.1 Supplier landscape
- 3.1.2 Profit margin analysis
- 3.1.3 Cost structure
- 3.1.4 Value addition at each stage
- 3.1.5 Factor affecting the value chain
- 3.1.6 Disruptions
- 3.2 Industry impact forces
- 3.2.1.1 Growth drivers
- 3.2.1.2 Increasing global seaborne trade
- 3.2.1.3 Industrial and steel production growth
- 3.2.1.4 Expanding agricultural trade
- 3.2.1.5 Fleet modernization and efficiency
- 3.2.2 Industry pitfalls and challenges
- 3.2.2.1 Port congestion and infrastructure bottlenecks
- 3.2.2.2 Volatility in charter rates
- 3.2.3 Market opportunities
- 3.2.3.1 Fleet renewal and eco-efficient vessels
- 3.2.3.2 Trade route diversification
- 3.2.3.3 Integration with digital shipping solutions
- 3.3 Growth potential analysis
- 3.4 Regulatory landscape
- 3.4.1 North America
- 3.4.1.1 US Coast Guard (USCG) Maritime Safety Regulations
- 3.4.1.2 Environmental Protection Agency (EPA) Vessel Emission Standards
- 3.4.1.3 Jones Act Compliance and Cabotage Rules
- 3.4.2 Europe
- 3.4.2.1 European Maritime Safety Agency (EMSA) Guidelines
- 3.4.2.2 EU Sulphur Directive and MARPOL Annex VI Standards
- 3.4.2.3 EU Ship Safety Certification Regulations
- 3.4.2.4 EU Type Approval and Flag State Requirements
- 3.4.2.5 Ballast Water Management Convention Compliance
- 3.4.2.6 Port State Control (PSC) Inspections
- 3.4.3 Asia Pacific
- 3.4.3.1 China Ship Emission Standards and MARPOL Compliance
- 3.4.3.2 India Directorate General of Shipping Regulations
- 3.4.3.3 Japan Ship Safety and Fuel Efficiency Standards
- 3.4.3.4 ASEAN Maritime Regulations and Regional Guidelines
- 3.4.3.5 Heavy and Large Vessel Operational Safety Standards
- 3.4.4 Latin America
- 3.4.4.1 Brazil National Agency for Waterway Transportation (ANTAQ) Standards
- 3.4.4.2 Argentina Ship Safety and Environmental Regulations
- 3.4.4.3 Mexico Secretariat of Communications and Transport (SCT) Vessel Standards
- 3.4.4.4 MERCOSUR Maritime Transport Regulatory Alignment
- 3.4.5 Middle East & Africa
- 3.4.5.1 UAE Federal Maritime Law
- 3.4.5.2 Saudi Ports Authority and Shipping Regulations
- 3.4.5.3 South African Maritime Safety Authority (SAMSA) Regulations
- 3.4.5.4 East African Community (EAC) Maritime and Vessel Standards
- 3.4.1 North America
- 3.5 Porter's analysis
- 3.6 PESTEL analysis
- 3.7 Technology and innovation landscape
- 3.7.1 Current technological trends
- 3.7.2 Emerging technologies
- 3.8 Price trends
- 3.8.1 By region
- 3.8.2 By product
- 3.9 Cost breakdown analysis
- 3.9.1 Vessel acquisition costs
- 3.9.2 Crew and staffing costs
- 3.9.3 Operational and maintenance costs
- 3.9.4 Regulatory and compliance costs
- 3.9.5 Fuel and bunker costs
- 3.10 Patent analysis
- 3.11 Sustainability and environmental aspects
- 3.11.1 Sustainable practices
- 3.11.2 Waste reduction strategies
- 3.11.3 Energy efficiency in production
- 3.11.4 Eco-friendly Initiatives
- 3.11.5 Carbon footprint considerations
- 3.12 Decarbonization pathways for dry bulk shipping
- 3.12.1 IMO 2030 / 2050 targets impact
- 3.12.2 Fuel options: LNG, methanol, ammonia, biofuels
- 3.12.3 Retrofit vs newbuild decarbonization economics
- 3.12.4 Carbon pricing and ETS exposure
- 3.13 Fleet Supply-Demand Balance & Orderbook Analysis
- 3.13.1 Active fleet vs demand growth balance
- 3.13.2 Orderbook analysis by vessel class
- 3.13.3 Scrapping and demolition trends
- 3.13.4 Net fleet growth outlook (2026-2035)
- 3.14 Freight Rate & Chartering Analysis
- 3.14.1 Time charter vs. voyage charter trends
- 3.14.2 Spot market and contract market analysis
- 3.14.3 Historical Baltic Dry Index (BDI) trends and projections
- 3.14.4 Freight rate volatility and risk mitigation strategies
- 3.14.5 Charterer-shipowner bargaining dynamics
- 3.15 Newbuilding and shipyard landscape
- 3.15.1 Orderbook by shipyard and country
- 3.15.2 Newbuilding price trends
- 3.15.3 Shipyard capacity constraints
- 3.15.4 Delivery slippage and delay risks
Chapter 4 Competitive Landscape, 2025
- 4.1 Introduction
- 4.2 Company market share analysis
- 4.2.1 North America
- 4.2.2 Europe
- 4.2.3 Asia Pacific
- 4.2.4 LATAM
- 4.2.5 MEA
- 4.3 Competitive analysis of major market players
- 4.4 Competitive positioning matrix
- 4.5 Strategic outlook matrix
- 4.6 Key developments
- 4.6.1 Mergers & acquisitions
- 4.6.2 Partnerships & collaborations
- 4.6.3 New Product Launches
- 4.6.4 Expansion Plans and funding
Chapter 5 Market Estimates & Forecast, By Commodity, 2022 - 2035 (USD Mn, Tons)
- 5.1 Key trends
- 5.2 Iron Ore
- 5.3 Coal
- 5.4 Grains
- 5.5 Bauxite
- 5.6 Nickel
- 5.7 Steel
- 5.8 Fertilizers
- 5.9 Others
Chapter 6 Market Estimates & Forecast, By Vessel, 2022 - 2035 (USD Mn, Tons)
- 6.1 Key trends
- 6.2 Capesize
- 6.3 Handysize
- 6.4 Panamax
- 6.5 Handymax
- 6.6 Others
Chapter 7 Market Estimates & Forecast, By Design, 2022 - 2035 (USD Mn, Tons)
- 7.1 Key trends
- 7.2 Gearless Bulk Carriers
- 7.3 Conventional Bulkers
- 7.4 Combined Bulk Carriers
- 7.5 Self-Dischargers
- 7.6 Bulker Lakers
- 7.7 Others
Chapter 8 Market Estimates & Forecast, By Operation, 2022 - 2035 (USD Mn, Tons)
- 8.1 Key trends
- 8.2 Owned Fleet
- 8.3 Chartered Fleet
Chapter 9 Market Estimates & Forecast, By Trade Route, 2022 - 2035 (USD Mn, Tons)
- 9.1 Key trends
- 9.2 Long-Haul Trade
- 9.3 Short-Sea Trade
Chapter 10 Market Estimates & Forecast, By Region, 2022 - 2035 (USD Mn, Tons)
- 10.1 Key trends
- 10.2 North America
- 10.2.1 US
- 10.2.2 Canada
- 10.3 Europe
- 10.3.1 Germany
- 10.3.2 UK
- 10.3.3 France
- 10.3.4 Italy
- 10.3.5 Spain
- 10.3.6 Russia
- 10.3.7 Nordics
- 10.3.8 Netherlands
- 10.3.9 Sweden
- 10.4 Asia Pacific
- 10.4.1 China
- 10.4.2 India
- 10.4.3 Japan
- 10.4.4 Australia
- 10.4.5 South Korea
- 10.4.6 Singapore
- 10.4.7 Thailand
- 10.4.8 Indonesia
- 10.4.9 Vietnam
- 10.5 Latin America
- 10.5.1 Brazil
- 10.5.2 Mexico
- 10.5.3 Argentina
- 10.6 MEA
- 10.6.1 South Africa
- 10.6.2 Saudi Arabia
- 10.6.3 UAE
- 10.6.4 Turkey
Chapter 11 Company Profiles
- 11.1 Global Players
- 11.1.1 COSCO Shipping Bulk
- 11.1.2 Oldendorff Carriers
- 11.1.3 Pacific Basin
- 11.1.4 Star Bulk
- 11.1.5 Golden Ocean
- 11.1.6 Diana Shipping
- 11.1.7 Genco Shipping & Trading
- 11.1.8 Bahri Dry Bulk
- 11.1.9 Polsteam
- 11.1.10 Eastern Bulk
- 11.2 Regional Players
- 11.2.1 Eagle Bulk Shipping
- 11.2.2 Navios Maritime Partners
- 11.2.3 Safe Bulkers
- 11.2.4 Fednav
- 11.2.5 Belships
- 11.3 Emerging Players / Disruptors
- 11.3.1 Scorpio Bulkers
- 11.3.2 Ultrabulk
- 11.3.3 Western Bulk
- 11.3.4 Wilson Shipping
- 11.3.5 VARAMAR


