


 |
市場調查報告書
商品編碼
1913458
抗解澱粉市場機會、成長要素、產業趨勢分析及2026年至2035年預測Resistant Starch Market Opportunity, Growth Drivers, Industry Trend Analysis, and Forecast 2026 - 2035 |
||||||
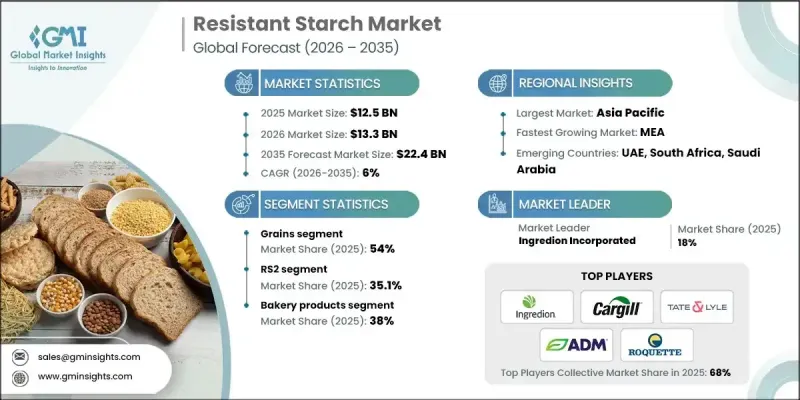
全球抗解澱粉市場預計到 2025 年將達到 125 億美元,到 2035 年將達到 224 億美元,年複合成長率為 6%。
代謝性疾病的日益普遍對市場成長產生了顯著影響,迫使食品生產商重新設計配方以改善營養成分。抗解澱粉因其能夠提高膳食纖維含量、降低血糖值指數,同時保持日常食品熟悉的口感和質地而備受關注。其功能性益處,例如維持消化系統健康、延長飽足感和穩定血糖值的大規模生產,尤其是在廣泛種植的作物上。同時,生產商也在探索替代原料來源,以符合永續性目標和潔淨標示策略。各種類型的抗解澱粉因其功能適用性而受到關注,其中天然存在的和重結晶的抗性澱粉比化學改性的抗性澱粉更受市場歡迎。這些趨勢共同推動了抗性澱粉在全球食品和營養市場的廣泛應用。
| 市場覆蓋範圍 | |
|---|---|
| 開始年份 | 2025 |
| 預測年份 | 2026-2035 |
| 起始值 | 125億美元 |
| 預測金額 | 224億美元 |
| 複合年成長率 | 6% |
預計到2025年,穀物類產品將佔市場佔有率的54%,並在2035年之前以5.1%的複合年成長率成長。需求成長主要受消費者對熟悉作物原料的偏好以及區域供應的便利性所驅動,尤其是在亞太市場。源自穀物和蔬菜的抗解澱粉也因其潔淨標示、非基因改造特性以及適用於機能性食品應用而備受關注。
預計到 2025 年,烘焙產品市佔率將達到 38%,到 2035 年將以 6% 的複合年成長率成長。抗解澱粉正擴大被添加到日常食品中,以在不改變消費者體驗的前提下,透過減少淨碳水化合物和增加消化器官系統益處來微妙地提高營養價值。
預計到 2025 年,美國抗解澱粉市場規模將達到 32 億美元。強大的創新能力、先進的研究基礎設施和高效的零售分銷網路支持富含纖維和低血糖指數食品的快速商業化。
目錄
第1章調查方法和範圍
第2章執行摘要
第3章業界考察
- 生態系分析
- 供應商情況
- 利潤率
- 每個階段的附加價值
- 影響價值鏈的因素
- 中斷
- 產業影響因素
- 促進要素
- 糖尿病和肥胖症盛行率不斷上升
- 偏好潔淨標示和天然成分。
- 提高人們對腸道環境和益生元的認知
- 產業潛在風險與挑戰
- 與傳統澱粉相比,高成本
- 消費者意識和理解力低下
- 市場機遇
- 拓展至植物來源及純素食品領域
- 在醫學和臨床營養領域的應用
- 促進要素
- 成長潛力分析
- 監管環境
- 北美洲
- 歐洲
- 亞太地區
- 拉丁美洲
- 中東和非洲
- 波特五力分析
- PESTEL 分析
- 價格趨勢
- 按地區
- 依產品
- 未來市場趨勢
- 科技與創新趨勢
- 當前技術趨勢
- 新興技術
- 專利狀態
- 貿易統計(HS編碼)(註:僅提供主要國家的貿易統計)
- 主要進口國
- 主要出口國
- 永續性和環境方面
- 永續努力
- 減少廢棄物策略
- 生產中的能源效率
- 環保舉措
- 考慮到碳足跡
第4章 競爭情勢
- 介紹
- 公司市佔率分析
- 按地區
- 北美洲
- 歐洲
- 亞太地區
- 拉丁美洲
- 中東和非洲
- 按地區
- 企業矩陣分析
- 主要市場公司的競爭分析
- 競爭定位矩陣
- 重大進展
- 併購
- 夥伴關係與合作
- 新產品發布
- 業務拓展計劃
第5章 市場估計與預測:依來源/生物物種分類,2022-2035年
- 糧食
- 米
- 小麥
- 高粱
- 西米
- 其他穀物
- 蔬菜
- 糯玉米
- 木薯
- 豌豆
- 其他蔬菜
- 其他成分
第6章 2022-2035年按產品分類的市場估算與預測
- RS1
- RS2
- RS3
- RS4
- RS5
第7章 按應用領域分類的市場估算與預測,2022-2035年
- 乳製品
- 烘焙產品
- 麵包
- 餅乾
- 餅乾
- 其他
- 糖果甜點
- 營養棒
- 其他
- 速食食品
- 麵條
- 義式麵食
- 穀物
- 餅乾
- 湯
- 其他
第8章 2022-2035年各地區市場估算與預測
- 北美洲
- 美國
- 加拿大
- 歐洲
- 德國
- 英國
- 法國
- 西班牙
- 義大利
- 其他歐洲地區
- 亞太地區
- 中國
- 印度
- 日本
- 澳洲
- 韓國
- 亞太其他地區
- 拉丁美洲
- 巴西
- 墨西哥
- 阿根廷
- 其他拉丁美洲地區
- 中東和非洲
- 沙烏地阿拉伯
- 南非
- 阿拉伯聯合大公國
- 其他中東和非洲地區
第9章:公司簡介
- Xian Kono Chem
- SunOpta
- MSPrebiotics
- Sheekharr Starch Private Limited
- AGRANA Beteiligungs
- Natural Stacks
- Gut Garden
- ADM
- Roquette Freres
- Arcadia Biosciences
- Tate &Lyle
- MGP Ingredients Inc.
- Ingredion Incorporated
- Cargill
The Global Resistant Starch Market was valued at USD 12.5 billion in 2025 and is estimated to grow at a CAGR of 6% to reach USD 22.4 billion by 2035.
Market growth has been strongly influenced by rising rates of metabolic health conditions, which have prompted food producers to redesign formulations with improved nutritional profiles. Resistant starch has gained attention as it allows manufacturers to enhance fiber content and reduce glycemic impact while maintaining the familiar taste and texture of everyday food products. Its functional benefits related to digestive wellness, prolonged satiety, and blood sugar moderation have increased its use across multiple food categories. Between 2021 and 2025, raw material availability and processing efficiency supported large-scale production, particularly from widely cultivated crops. At the same time, producers explored alternative raw material streams to align with sustainability goals and clean-label positioning. Different types of resistant starch gained traction based on functional suitability, with naturally occurring and retrograded variants receiving stronger market acceptance compared to chemically modified options. These combined trends continue to support broad adoption across global food and nutrition markets.
| Market Scope | |
|---|---|
| Start Year | 2025 |
| Forecast Year | 2026-2035 |
| Start Value | $12.5 Billion |
| Forecast Value | $22.4 Billion |
| CAGR | 6% |
The grains segment accounted for 54% share in 2025 and is expected to grow at a CAGR of 5.1% through 2035. Demand is being driven by preference for familiar crop sources and regional availability, particularly in Asia Pacific markets. Grain- and vegetable-derived resistant starches are also gaining attention for their suitability in clean-label, non-GMO, and functional food applications.
The bakery products segment held 38% share in 2025 and is projected to grow at a CAGR of 6% through 2035. Resistant starch is increasingly incorporated into everyday food products to subtly improve nutritional value by lowering net carbohydrates and enhancing digestive benefits without altering consumer experience.
US Resistant Starch Market reached USD 3.2 billion in 2025. Strong innovation capabilities, advanced research infrastructure, and efficient retail distribution support the rapid commercialization of fiber-enriched and low-glycemic food products.
Key companies operating in the Global Resistant Starch Market include Cargill, Ingredion Incorporated, Tate & Lyle, Roquette Freres, ADM, SunOpta, AGRANA Beteiligungs, MGP Ingredients Inc., Arcadia Biosciences, Xian Kono Chem, MSPrebiotics, Sheikharr Starch Private Limited, Natural Stacks, and Gut Garden. Companies in the Global Resistant Starch Market are strengthening their competitive position through continuous investment in research, formulation science, and application-specific solutions. Many players are expanding portfolios with clean-label and naturally sourced resistant starches to meet evolving consumer expectations. Strategic collaborations with food manufacturers enable faster integration into mainstream products. Firms are also focusing on supply chain optimization and sustainable sourcing to improve efficiency and transparency.
Table of Contents
Chapter 1 Methodology & Scope
- 1.1 Market scope and definition
- 1.2 Research design
- 1.2.1 Research approach
- 1.2.2 Data collection methods
- 1.3 Data mining sources
- 1.3.1 Global
- 1.3.2 Regional/Country
- 1.4 Base estimates and calculations
- 1.4.1 Base year calculation
- 1.4.2 Key trends for market estimation
- 1.5 Primary research and validation
- 1.5.1 Primary sources
- 1.6 Forecast model
- 1.7 Research assumptions and limitations
Chapter 2 Executive Summary
- 2.1 Industry 3600 synopsis
- 2.2 Key market trends
- 2.2.1 Regional
- 2.2.2 Source / Organism Type
- 2.2.3 Product
- 2.2.4 Application
- 2.3 TAM Analysis, 2026-2035
- 2.4 CXO perspectives: Strategic imperatives
- 2.4.1 Executive decision points
- 2.4.2 Critical success factors
- 2.5 Future Outlook and Strategic Recommendations
Chapter 3 Industry Insights
- 3.1 Industry ecosystem analysis
- 3.1.1 Supplier landscape
- 3.1.2 Profit margin
- 3.1.3 Value addition at each stage
- 3.1.4 Factor affecting the value chain
- 3.1.5 Disruptions
- 3.2 Industry impact forces
- 3.2.1 Growth drivers
- 3.2.1.1 Rising diabetes and obesity prevalence
- 3.2.1.2 Clean-label and natural ingredient preference
- 3.2.1.3 Growing gut health and prebiotic awareness
- 3.2.2 Industry pitfalls and challenges
- 3.2.2.1 Higher cost versus conventional starches
- 3.2.2.2 Limited consumer awareness and understanding
- 3.2.3 Market opportunities
- 3.2.3.1 Expansion into plant-based and vegan foods
- 3.2.3.2 Use in medical and clinical nutrition
- 3.2.1 Growth drivers
- 3.3 Growth potential analysis
- 3.4 Regulatory landscape
- 3.4.1 North America
- 3.4.2 Europe
- 3.4.3 Asia Pacific
- 3.4.4 Latin America
- 3.4.5 Middle East & Africa
- 3.5 Porter's analysis
- 3.6 PESTEL analysis
- 3.7 Price trends
- 3.7.1 By region
- 3.7.2 By Product
- 3.8 Future market trends
- 3.9 Technology and Innovation landscape
- 3.9.1 Current technological trends
- 3.9.2 Emerging technologies
- 3.10 Patent Landscape
- 3.11 Trade statistics (HS code) ( Note: The trade statistics will be provided for key countries only)
- 3.11.1 Major importing countries
- 3.11.2 Major exporting countries
- 3.12 Sustainability and environmental aspects
- 3.12.1 Sustainable practices
- 3.12.2 Waste reduction strategies
- 3.12.3 Energy efficiency in production
- 3.12.4 Eco-friendly initiatives
- 3.13 Carbon footprint consideration
Chapter 4 Competitive Landscape, 2025
- 4.1 Introduction
- 4.2 Company market share analysis
- 4.2.1 By region
- 4.2.1.1 North America
- 4.2.1.2 Europe
- 4.2.1.3 Asia Pacific
- 4.2.1.4 LATAM
- 4.2.1.5 MEA
- 4.2.1 By region
- 4.3 Company matrix analysis
- 4.4 Competitive analysis of major market players
- 4.5 Competitive positioning matrix
- 4.6 Key developments
- 4.6.1 Mergers & acquisitions
- 4.6.2 Partnerships & collaborations
- 4.6.3 New Product Launches
- 4.6.4 Expansion Plans
Chapter 5 Market Estimates and Forecast, By Source / Organism Type, 2022-2035 (USD Billion) (Kilo Tons)
- 5.1 Key trends
- 5.2 Grains
- 5.2.1 Rice
- 5.2.2 Wheat
- 5.2.3 Sorghum
- 5.2.4 Sago
- 5.2.5 Other grains
- 5.3 Vegetables
- 5.3.1 Waxy corn
- 5.3.2 Tapioca
- 5.3.3 Pea
- 5.3.4 Other vegetables
- 5.4 Other sources
Chapter 6 Market Estimates and Forecast, By Product, 2022-2035 (USD Billion) (Kilo Tons)
- 6.1 Key trends
- 6.2 RS1
- 6.3 RS2
- 6.4 RS3
- 6.5 RS4
- 6.6 RS5
Chapter 7 Market Estimates and Forecast, By Application, 2022-2035 (USD Billion) (Kilo Tons)
- 7.1 Key trends
- 7.2 Dairy products
- 7.3 Bakery products
- 7.3.1 Bread
- 7.3.2 Cookies
- 7.3.3 Biscuits
- 7.3.4 Others
- 7.4 Sugar confections
- 7.4.1 Nutrition Bars
- 7.4.2 Others
- 7.5 Convenience foods
- 7.5.1 Noodles
- 7.5.2 Pasta
- 7.5.3 Breakfast Cereals
- 7.5.4 Crackers
- 7.5.5 Soup
- 7.5.6 Others
Chapter 8 Market Estimates and Forecast, By Region, 2022-2035 (USD Billion) (Kilo Tons)
- 8.1 Key trends
- 8.2 North America
- 8.2.1 U.S.
- 8.2.2 Canada
- 8.3 Europe
- 8.3.1 Germany
- 8.3.2 UK
- 8.3.3 France
- 8.3.4 Spain
- 8.3.5 Italy
- 8.3.6 Rest of Europe
- 8.4 Asia Pacific
- 8.4.1 China
- 8.4.2 India
- 8.4.3 Japan
- 8.4.4 Australia
- 8.4.5 South Korea
- 8.4.6 Rest of Asia Pacific
- 8.5 Latin America
- 8.5.1 Brazil
- 8.5.2 Mexico
- 8.5.3 Argentina
- 8.5.4 Rest of Latin America
- 8.6 Middle East and Africa
- 8.6.1 Saudi Arabia
- 8.6.2 South Africa
- 8.6.3 UAE
- 8.6.4 Rest of Middle East and Africa
Chapter 9 Company Profiles
- 9.1 Xian Kono Chem
- 9.2 SunOpta
- 9.3 MSPrebiotics
- 9.4 Sheekharr Starch Private Limited
- 9.5 AGRANA Beteiligungs
- 9.6 Natural Stacks
- 9.7 Gut Garden
- 9.8 ADM
- 9.9 Roquette Freres
- 9.10 Arcadia Biosciences
- 9.11 Tate & Lyle
- 9.12 MGP Ingredients Inc.
- 9.13 Ingredion Incorporated
- 9.14 Cargill


