


 |
市場調查報告書
商品編碼
1913442
硫酸軟骨素市場機會、成長要素、產業趨勢分析及預測(2026年至2035年)Chondroitin Sulphate Market Opportunity, Growth Drivers, Industry Trend Analysis, and Forecast 2026 - 2035 |
||||||
全球硫酸軟骨素市場預計到 2025 年將達到 15 億美元,到 2035 年將達到 24 億美元,年複合成長率為 5.3%。
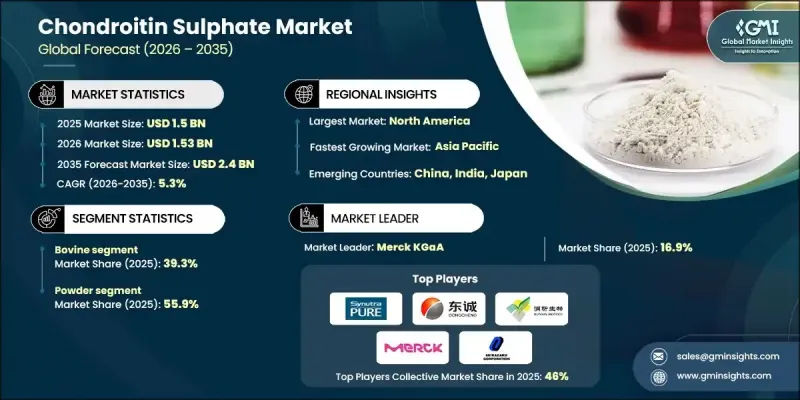
隨著全球老化人口和健康意識增強的消費者對關節健康的關注度不斷提高,市場正經歷穩定成長。關節不適和活動障礙症狀的日益增多,推動了含硫酸軟骨素的膳食補充劑和功能性產品的消費成長。消費者對天然和來源可靠的成分的偏好不斷變化,也推動了市場發展,增強了對高品質配方的需求。生產流程的進步提高了產品的純度、均一性和規模化生產能力,同時也有助於實現永續性目標。寵物和牲畜健康領域的成長進一步擴大了應用範圍,因為關節支持配方在寵物營養中變得越來越重要。數位化零售通路增強了市場進入,使品牌能夠觸及更廣泛的消費群體,同時提供產品透明度和便利性。這些趨勢共同增強了硫酸軟骨素在人類營養、獸醫應用和健康產品類型中的長期需求。
| 市場覆蓋範圍 | |
|---|---|
| 開始年份 | 2025 |
| 預測年份 | 2026-2035 |
| 起始值 | 15億美元 |
| 預測金額 | 24億美元 |
| 複合年成長率 | 5.3% |
2025年,牛硫酸軟骨素市佔率為39.3%。由於其在關節保健品中的卓越功效以及在保健品製造業的強勢地位,該成分將繼續被廣泛使用。
到 2025 年,粉狀硫酸軟骨素市佔率將達到 55.9%。這種形式的主導地位得益於其配方柔軟性、易於添加到補充劑中以及與潔淨標示和可自訂營養趨勢的兼容性。
預計到2025年,北美硫酸軟骨素市佔率將達到38.2%。該地區需求持續強勁,主要得益於消費者對關節健康的高度重視、膳食補充劑的廣泛使用以及成熟的膳食補充劑行業。美國仍然是主要市場貢獻者,這主要源於消費者對透明採購和高品質配方產品的強烈偏好。
目錄
第1章調查方法和範圍
第2章執行摘要
第3章業界考察
- 生態系分析
- 供應商情況
- 利潤率
- 每個階段的附加價值
- 影響價值鏈的因素
- 中斷
- 產業影響因素
- 促進要素
- 產業潛在風險與挑戰
- 市場機遇
- 成長潛力分析
- 監管環境
- 北美洲
- 歐洲
- 亞太地區
- 拉丁美洲
- 中東和非洲
- 波特五力分析
- PESTEL 分析
- 價格趨勢
- 未來市場趨勢
- 科技與創新趨勢
- 當前技術趨勢
- 新興技術
- 專利狀態
- 貿易統計(HS編碼)(註:僅提供主要國家的貿易統計)
- 主要進口國
- 主要出口國
第4章 競爭情勢
- 介紹
- 公司市佔率分析
- 按地區
- 北美洲
- 歐洲
- 亞太地區
- 拉丁美洲
- 中東和非洲
- 按地區
- 企業矩陣分析
- 主要市場公司的競爭分析
- 競爭定位矩陣
- 重大進展
- 併購
- 夥伴關係與合作
- 新產品發布
- 業務拓展計劃
5. 2022-2035年按來源分類的市場估計與預測
- 牛
- 豬肉
- 鳥類
- 雞肉
- 土耳其
- 其他
- 魚貝類
- 鮪魚
- 鮭魚
- 其他
- 其他
第6章 按類型分類的市場估算與預測,2022-2035年
- 粉末
- 膠囊/片劑
- 液體
第7章 按應用領域分類的市場估算與預測,2022-2035年
- 營養補充品
- 膠囊
- 藥片
- 軟糖
- 製藥
- 骨關節炎治療藥物
- 關節健康產品
- 化妝品和個人護理
- 抗衰老霜
- 皮膚保濕產品
- 食品/飲料
- 其他
第8章 按分銷管道分類的市場估算與預測,2022-2035年
- 直銷
- 經銷商
- 線上零售
- 藥局
第9章 2022-2035年各地區市場估算與預測
- 北美洲
- 美國
- 加拿大
- 歐洲
- 德國
- 英國
- 法國
- 西班牙
- 義大利
- 其他歐洲地區
- 亞太地區
- 中國
- 印度
- 日本
- 澳洲
- 韓國
- 亞太其他地區
- 拉丁美洲
- 巴西
- 墨西哥
- 阿根廷
- 其他拉丁美洲地區
- 中東和非洲
- 沙烏地阿拉伯
- 南非
- 阿拉伯聯合大公國
- 其他中東和非洲地區
第10章:公司簡介
- TSI Group Ltd.
- Synutra Ingredients(Shandong)Co., Ltd.
- Yantai Dongcheng Pharmaceutical Group Co., Ltd.
- Jiaxing Hengjie Biopharmaceutical Co., Ltd.
- Qufu Liyang Biochem Industrial Co., Ltd.
- Pacific Rainbow International, Inc.
- Shandong Runxin Biotechnology Co., Ltd.
- ZPD A/S
- Guangdong Hybribio Biotech Co., Ltd.
- Wanbury Limited
- Sierra Ingredients Pty Ltd.
- BGM Pharmaceuticals Co., Ltd.
- YBCC(Qingdao)Co., Ltd.
- Anhui Jintung Fine Chemical Corporation Ltd.
The Global Chondroitin Sulphate Market was valued at USD 1.5 billion in 2025 and is estimated to grow at a CAGR of 5.3% to reach USD 2.4 billion by 2035.
The market is gaining steady momentum as awareness around joint health continues to rise among aging populations and health-focused consumers worldwide. The increasing incidence of joint discomfort and mobility-related conditions is encouraging greater consumption of nutritional supplements and functional products formulated with chondroitin sulphate. The market is also benefiting from shifting consumer preferences toward naturally derived and responsibly sourced ingredients, reinforcing demand for high-quality formulations. Advancements in production methods are improving purity, consistency, and scalability while supporting sustainability goals. Growth in the companion animal and livestock wellness space is further expanding application scope, as joint-support formulations gain importance in pet nutrition. Digital retail channels are strengthening market access, enabling brands to reach a broader consumer base while offering product transparency and convenience. Collectively, these dynamics are reinforcing long-term demand for chondroitin sulphate across human nutrition, veterinary applications, and wellness-focused product categories.
| Market Scope | |
|---|---|
| Start Year | 2025 |
| Forecast Year | 2026-2035 |
| Start Value | $1.5 Billion |
| Forecast Value | $2.4 Billion |
| CAGR | 5.3% |
The bovine-based chondroitin sulphate segment accounted for 39.3% share in 2025. This source continues to see widespread use due to its strong functional performance in joint health formulations and its established presence across supplement manufacturing.
The powdered chondroitin sulphate segment held 55.9% share in 2025. The dominance of this form is supported by its formulation flexibility, ease of incorporation into supplements, and alignment with clean-label and customizable nutrition trends.
North America Chondroitin Sulphate Market held 38.2% share in 2025. The region continues to show strong demand driven by high consumer awareness of joint health, widespread supplement usage, and a mature nutraceutical industry. The United States remains the primary contributor, supported by a strong preference for transparent sourcing and quality-focused formulations.
Key companies active in the Global Chondroitin Sulphate Market include Wanbury Limited, TSI Group Ltd., ZPD A/S, Sierra Ingredients Pty Ltd., Synutra Ingredients (Shandong) Co., Ltd., Pacific Rainbow International, Inc., Guangdong Hybribio Biotech Co., Ltd., Yantai Dongcheng Pharmaceutical Group Co., Ltd., Shandong Runxin Biotechnology Co., Ltd., Jiaxing Hengjie Biopharmaceutical Co., Ltd., BGM Pharmaceuticals Co., Ltd., Qufu Liyang Biochem Industrial Co., Ltd., YBCC (Qingdao) Co., Ltd., and Anhui Jintung Fine Chemical Corporation Ltd. Companies operating in the Global Chondroitin Sulphate Market are focusing on quality enhancement, supply chain transparency, and product differentiation to strengthen their market position. Manufacturers are investing in advanced processing technologies to improve purity, consistency, and sustainability while meeting evolving regulatory standards. Strategic partnerships with supplement brands and distributors are expanding global reach and application diversity. Firms are also prioritizing clean-label positioning and traceability to align with consumer demand for ethically sourced ingredients.
Table of Contents
Chapter 1 Methodology & Scope
- 1.1 Market scope and definition
- 1.2 Research design
- 1.2.1 Research approach
- 1.2.2 Data collection methods
- 1.3 Data mining sources
- 1.3.1 Global
- 1.3.2 Regional/Country
- 1.4 Base estimates and calculations
- 1.4.1 Base year calculation
- 1.4.2 Key trends for market estimation
- 1.5 Primary research and validation
- 1.5.1 Primary sources
- 1.6 Forecast model
- 1.7 Research assumptions and limitations
Chapter 2 Executive Summary
- 2.1 Industry 3600 synopsis
- 2.2 Key market trends
- 2.2.1 Regional
- 2.2.2 Source
- 2.2.3 Form
- 2.2.4 Application
- 2.2.5 Distribution Channel
- 2.3 TAM Analysis, 2025-2034
- 2.4 CXO perspectives: Strategic imperatives
- 2.4.1 Executive decision points
- 2.4.2 Critical success factors
- 2.5 Future Outlook and Strategic Recommendations
Chapter 3 Industry Insights
- 3.1 Industry ecosystem analysis
- 3.1.1 Supplier landscape
- 3.1.2 Profit margin
- 3.1.3 Value addition at each stage
- 3.1.4 Factor affecting the value chain
- 3.1.5 Disruptions
- 3.2 Industry impact forces
- 3.2.1 Growth drivers
- 3.2.2 Industry pitfalls and challenges
- 3.2.3 Market opportunities
- 3.3 Growth potential analysis
- 3.4 Regulatory landscape
- 3.4.1 North America
- 3.4.2 Europe
- 3.4.3 Asia Pacific
- 3.4.4 Latin America
- 3.4.5 Middle East & Africa
- 3.5 Porter's analysis
- 3.6 PESTEL analysis
- 3.7 Price trends
- 3.8 Future market trends
- 3.9 Technology and Innovation landscape
- 3.9.1 Current technological trends
- 3.9.2 Emerging technologies
- 3.10 Patent Landscape
- 3.11 Trade statistics (HS code) ( Note: the trade statistics will be provided for key countries only)
- 3.11.1 Major importing countries
- 3.11.2 Major exporting countries
Chapter 4 Competitive Landscape, 2025
- 4.1 Introduction
- 4.2 Company market share analysis
- 4.2.1 By region
- 4.2.1.1 North America
- 4.2.1.2 Europe
- 4.2.1.3 Asia Pacific
- 4.2.1.4 LATAM
- 4.2.1.5 MEA
- 4.2.1 By region
- 4.3 Company matrix analysis
- 4.4 Competitive analysis of major market players
- 4.5 Competitive positioning matrix
- 4.6 Key developments
- 4.6.1 Mergers & acquisitions
- 4.6.2 Partnerships & collaborations
- 4.6.3 New Product Launches
- 4.6.4 Expansion Plans
Chapter 5 Market Estimates and Forecast, By Source, 2022-2035 (USD Million & Tons)
- 5.1 Key trends
- 5.2 Bovine
- 5.3 Porcine
- 5.4 Avian
- 5.4.1 Chicken
- 5.4.2 Turkey
- 5.4.3 Others
- 5.5 Marine
- 5.5.1 Tuna
- 5.5.2 Salmon
- 5.5.3 Others
- 5.6 Others
Chapter 6 Market Estimates and Forecast, By Form, 2022-2035 (USD Million & Tons)
- 6.1 Key trends
- 6.2 Powder
- 6.3 Capsule/Tablets
- 6.4 Liquid
Chapter 7 Market Estimates and Forecast, By Application, 2022-2035 (USD Million & Tons)
- 7.1 Key trends
- 7.2 Dietary Supplements
- 7.2.1 Capsules
- 7.2.2 Tablets
- 7.2.3 Gummies
- 7.3 Pharmaceuticals
- 7.3.1 Osteoarthritis treatment drugs
- 7.3.2 Joint health formulations
- 7.4 Cosmetic and Personal Care
- 7.4.1 Anti-aging creams
- 7.4.2 Skin hydration products
- 7.5 Food and Beverages
- 7.6 Others
Chapter 8 Market Estimates and Forecast, By Distribution Channel, 2022-2035 (USD Million & Tons)
- 8.1 Key trends
- 8.2 Direct Sales
- 8.3 Distributors
- 8.4 Online Retail
- 8.5 Pharmacies
Chapter 9 Market Estimates and Forecast, By Region, 2022-2035 (USD Million & Tons)
- 9.1 Key trends
- 9.2 North America
- 9.2.1 U.S.
- 9.2.2 Canada
- 9.3 Europe
- 9.3.1 Germany
- 9.3.2 UK
- 9.3.3 France
- 9.3.4 Spain
- 9.3.5 Italy
- 9.3.6 Rest of Europe
- 9.4 Asia Pacific
- 9.4.1 China
- 9.4.2 India
- 9.4.3 Japan
- 9.4.4 Australia
- 9.4.5 South Korea
- 9.4.6 Rest of Asia Pacific
- 9.5 Latin America
- 9.5.1 Brazil
- 9.5.2 Mexico
- 9.5.3 Argentina
- 9.5.4 Rest of Latin America
- 9.6 Middle East and Africa
- 9.6.1 Saudi Arabia
- 9.6.2 South Africa
- 9.6.3 UAE
- 9.6.4 Rest of Middle East and Africa
Chapter 10 Company Profiles
- 10.1 TSI Group Ltd.
- 10.2 Synutra Ingredients (Shandong) Co., Ltd.
- 10.3 Yantai Dongcheng Pharmaceutical Group Co., Ltd.
- 10.4 Jiaxing Hengjie Biopharmaceutical Co., Ltd.
- 10.5 Qufu Liyang Biochem Industrial Co., Ltd.
- 10.6 Pacific Rainbow International, Inc.
- 10.7 Shandong Runxin Biotechnology Co., Ltd.
- 10.8 ZPD A/S
- 10.9 Guangdong Hybribio Biotech Co., Ltd.
- 10.10 Wanbury Limited
- 10.11 Sierra Ingredients Pty Ltd.
- 10.12 BGM Pharmaceuticals Co., Ltd.
- 10.13 YBCC (Qingdao) Co., Ltd.
- 10.14 Anhui Jintung Fine Chemical Corporation Ltd.
 硫酸軟骨素市場:依形態、原料、生產流程、應用及通路分類-2026-2032年全球市場預測
 硫酸軟骨素:市場佔有率分析、產業趨勢與統計、成長預測(2026-2031)
 全球硫酸軟骨素市場規模、佔有率、趨勢和成長分析報告(2026-2034年)
 2026年全球硫酸軟骨素市場報告
 硫酸軟骨素市場-全球產業規模、佔有率、趨勢、機會、預測:按原料、應用、區域和競爭對手分類,2021-2031年犬用葡萄糖胺補充劑市場按劑型、成分類型、配方和分銷管道分類,全球預測(2026-2032年)
 硫酸軟骨素市場規模、佔有率和成長分析(按來源、形態、應用和地區分類)-2026-2033年產業預測
 2025-2033年硫酸軟骨素市場報告,依來源(牛、豬、家禽、鯊魚等)、形式(粉末、片劑等)、應用(藥品和保健品、動物飼料、個人護理和化妝品等)和地區分類
 硫酸軟骨素市場規模、佔有率和趨勢分析報告:按來源、應用、地區和細分市場預測,2025-2033 年
 硫酸軟骨素市場,規模,佔有率,趨勢,產業分析報告:供給來源,各用途,各地區,2025年~2034年的市場預測