


 |
市場調查報告書
商品編碼
1913412
汽車虛擬機器管理程序市場機會、成長要素、產業趨勢分析及預測(2026-2035年)Automotive Hypervisor Market Opportunity, Growth Drivers, Industry Trend Analysis, and Forecast 2026 - 2035 |
||||||
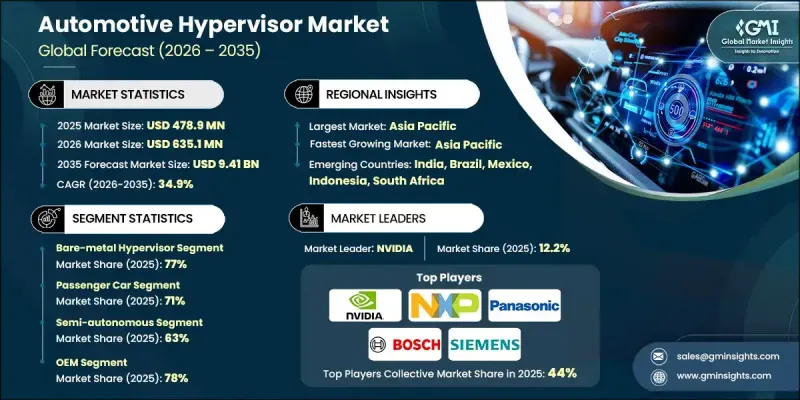
全球汽車虛擬機器管理程式市場預計到 2025 年將達到 4.789 億美元,到 2035 年將達到 94.1 億美元,年複合成長率為 34.9%。
汽車產業從以硬體為中心的車輛架構向基於集中式運算平台的軟體定義車輛進行結構性轉型,推動了市場成長。汽車製造商越來越依賴汽車虛擬機器管理程序,以在共用運算環境中支援多種作業系統和應用程式。這種轉變能夠加快軟體引進週期,提高可擴展性,並增強跨多個汽車平臺部署功能的柔軟性。向集中式運算的轉變也有助於簡化系統設計、降低複雜度並提高軟體生命週期管理的效率。隨著車輛變得更加互聯、智慧和軟體主導,虛擬機器管理程式正成為安全工作負載管理、效能最佳化和麵向未來的車輛架構的基礎技術。對數位汽車平臺和下一代移動出行解決方案的持續投資進一步加速了這一趨勢,使汽車虛擬機管理程序成為現代汽車創新的關鍵推動因素。
| 市場覆蓋範圍 | |
|---|---|
| 開始年份 | 2025 |
| 預測年份 | 2026-2035 |
| 起始值 | 4.789億美元 |
| 預測金額 | 94.1億美元 |
| 複合年成長率 | 34.9% |
隨著高級駕駛輔助系統 (ADAS) 的日益複雜和自動駕駛技術的不斷進步,嚴格分離安全關鍵型應用和非安全關鍵型應用的需求也日益成長。汽車虛擬機器管理程式平台據稱能夠實現工作負載的安全分離,確保系統行為的可預測性,同時滿足功能安全要求。製造商正在將多個電控系統整合到數量更少的網域控制器和中央控制器中,以簡化車輛架構、降低佈線複雜性、減少能耗並提高整體系統效率。
預計到 2025 年,裸金屬虛擬機管理程序市佔率將達到 77%,從 2026 年到 2035 年的複合年成長率將達到 34.3%。該細分市場之所以獲得發展動力,是因為它能夠直接與車輛硬體連接,最大限度地減少響應延遲,並支援對安全至關重要的汽車應用而言必不可少的即時系統性能。
預計到 2025 年,乘用車細分市場將佔市場佔有率的 71%,到 2035 年將以 35.5% 的複合年成長率成長。對互聯服務和虛擬化資訊娛樂環境的需求不斷成長,正在推動基於虛擬機器管理程式的平台的普及,這些平台可以在統一的車載運算系統中運行多個應用程式。
預計到 2025 年,美國汽車虛擬機器管理程式市場規模將達到 1.098 億美元。該國的成長得益於汽車製造商和技術提供商的大力投資,他們專注於開發聯網汽車、自動駕駛和軟體定義汽車。
目錄
第1章調查方法
第2章執行摘要
第3章業界考察
- 生態系分析
- 供應商情況
- 利潤率
- 成本結構
- 每個階段的附加價值
- 影響價值鏈的因素
- 中斷
- 產業影響因素
- 促進要素
- 向軟體定義車輛(SDV)的過渡
- ADAS和自動駕駛功能的日益融合
- ECU整合與成本最佳化
- 日益關注功能安全和網路安全
- 產業潛在風險與挑戰
- 高整合度和檢驗複雜性
- 售後市場接受度有限
- 市場機遇
- 擴展集中式和區域式車輛架構
- 電動車和自動駕駛汽車的發展
- OTA和互聯服務整合
- 商用車和車隊車輛的新需求
- 促進要素
- 成長潛力分析
- 監管環境
- 北美洲
- 美國運輸部(DOT) 標準
- 職業安全與健康管理局 (OSHA) 指南
- 美國環保署(EPA)
- 歐洲
- EN ISO 容器標準
- 歐盟海關和安全法規
- BS EN/CEN 標準
- 國家標準(UNE、DIN等)
- 亞太地區
- 中國國家標準(GB)
- 日本JIS標準要求
- 韓國KS認證
- 印度BIS標準
- 泰國工業標準協會(TISI)
- 拉丁美洲
- INMETRO(國家計量研究院)
- INTI認證(國家技術研究院)
- NOM 標準(墨西哥官方標準)
- 中東和非洲
- ESMA/阿拉伯聯合大公國合格評定計劃 (ECAS)
- 海灣合作理事會技術法規
- SABS認證
- 北美洲
- 波特五力分析
- PESTEL 分析
- 技術與創新展望
- 當前技術趨勢
- 新興技術
- 定價分析
- 產品定價
- 區域定價
- 成本細分分析
- 專利分析
- 永續性和環境方面
- 永續實踐
- 減少廢棄物策略
- 生產中的能源效率
- 環保舉措
- 碳足跡考量
- 用例
- 虛擬機器管理程式架構與部署模型
- 類型 1、類型 2 和混合臨界性架構
- 集中式和分區式ECU佈局
- 多領域整合策略(ADAS + IVI + 車身)
- 效能、延遲和確定性之間的權衡
- SoC相容性和硬體協同設計
- 開放原始碼與專有虛擬機器管理程式策略
- 功能安全和混合臨界性管理
第4章 競爭情勢
- 介紹
- 公司市佔率分析
- 北美洲
- 歐洲
- 亞太地區
- 拉丁美洲
- 中東和非洲
- 主要市場公司的競爭分析
- 競爭定位矩陣
- 戰略展望矩陣
- 重大進展
- 併購
- 夥伴關係與合作
- 新產品發布
- 企業擴張計畫和資金籌措
第5章 依虛擬機器管理程式分類的市場估算與預測,2022-2035年
- 裸機管理程序
- 託管虛擬機器管理程序
6. 依自主程度分類的市場估計與預測,2022-2035 年
- 半自主
- 完全自主
第7章 依車輛類型分類的市場估計與預測,2022-2035年
- 搭乘用車
- 掀背車
- 轎車
- SUV
- 商用車輛
- 輕型商用車
- 中型商用車(MCV)
- 重型商用車(HCV)
第8章 按應用領域分類的市場估算與預測,2022-2035年
- ADAS(進階駕駛輔助系統)
- 資訊娛樂和車載資訊系統
- 動力傳動系統和底盤控制系統
- 車聯網(V2X)
- 自動駕駛系統
第9章 依銷售管道分類的市場估計與預測,2022-2035年
- OEM
- 售後市場
第10章 2022-2035年各地區市場估計與預測
- 北美洲
- 美國
- 加拿大
- 歐洲
- 德國
- 英國
- 法國
- 義大利
- 西班牙
- 北歐國家
- 俄羅斯
- 波蘭
- 羅馬尼亞
- 亞太地區
- 中國
- 印度
- 日本
- 韓國
- ANZ
- 越南
- 印尼
- 拉丁美洲
- 巴西
- 墨西哥
- 阿根廷
- 中東和非洲
- 南非
- 沙烏地阿拉伯
- 阿拉伯聯合大公國
第11章 公司簡介
- 世界公司
- BlackBerry QNX
- Continental
- Green Hills Software
- NVIDIA
- NXP Semiconductors
- Panasonic
- Renesas Electronics
- Robert Bosch
- Siemens(Mentor Graphics)
- Wind River Systems
- 區域玩家
- Aptiv
- Infineon Technologies
- OpenSynergy
- Sasken Technologies
- STMicroelectronics
- Synopsys
- SYSGO
- Texas Instruments
- Vector Informatik
- VMware
- 新興企業
- Apex.AI
- Lynx Software Technologies
- OpenSynergy Ecosystem Partners
- SafeRide Technologies
- Virtual Open Systems
The Global Automotive Hypervisor Market was valued at USD 478.9 million in 2025 and is estimated to grow at a CAGR of 34.9% to reach USD 9.41 billion by 2035.
Market expansion is driven by the automotive industry's structural transition from hardware-focused vehicle architectures to software-defined vehicles built around centralized computing platforms. Vehicle manufacturers are increasingly relying on automotive hypervisors to support multiple operating systems and applications on a shared computing environment. This shift is enabling faster software deployment cycles, improved scalability, and greater flexibility in introducing features across multiple vehicle platforms. The move toward centralized computing is also supporting simplified system design, reduced complexity, and more efficient software lifecycle management. As vehicles become more connected, intelligent, and software-driven, hypervisors are emerging as a foundational technology that supports secure workload management, performance optimization, and future-ready vehicle architectures. Growing investment in digital vehicle platforms and next-generation mobility solutions is further accelerating adoption, positioning automotive hypervisors as a critical enabler of modern automotive innovation.
| Market Scope | |
|---|---|
| Start Year | 2025 |
| Forecast Year | 2026-2035 |
| Start Value | $478.9 Million |
| Forecast Value | $9.41 Billion |
| CAGR | 34.9% |
The increasing complexity of advanced driver assistance systems and the progression toward autonomous mobility have heightened the need for strict separation between safety-critical and non-critical applications. Automotive hypervisor platforms are described as enabling secure isolation of workloads, ensuring predictable system behavior while meeting functional safety requirements. Manufacturers are consolidating multiple electronic control units into fewer domain and central controllers to streamline vehicle architecture, reduce wiring complexity, lower energy consumption, and improve overall system efficiency.
The bare-metal hypervisor segment held 77% share in 2025 and is expected to grow at a CAGR of 34.3% from 2026 to 2035. This segment is gaining traction due to its ability to interact directly with vehicle hardware, minimizing response latency and supporting real-time system performance, which is essential for safety-focused automotive applications.
The passenger car segment accounted for 71% share in 2025 and is forecast to grow at a CAGR of 35.5% through 2035. Rising demand for connected services and virtualized infotainment environments is driving adoption of hypervisor-based platforms that allow multiple applications to operate within a unified vehicle computing system.
U.S. Automotive Hypervisor Market reached USD 109.8 million in 2025. Growth in the country is supported by strong investment from automakers and technology providers focused on connected, autonomous, and software-defined vehicle development.
Key companies active in the Global Automotive Hypervisor Market include NVIDIA, BlackBerry, Wind River Systems, NXP Semiconductors, Green Hills Software, Robert Bosch, Continental, Renesas Electronics, Siemens, and Panasonic. Companies operating in the Global Automotive Hypervisor Market are strengthening their competitive position through continuous innovation, ecosystem partnerships, and alignment with software-defined vehicle strategies. Many players are investing heavily in safety-certified hypervisor platforms that support mixed-critical workloads and centralized vehicle architectures. Strategic collaborations with automakers, semiconductor vendors, and software developers are accelerating integration into next-generation vehicle platforms. Firms are also focusing on scalability, cybersecurity, and compliance with functional safety standards to meet evolving regulatory and industry requirements.
Table of Contents
Chapter 1 Methodology
- 1.1 Research approach
- 1.2 Quality commitments
- 1.3 GMI AI policy & data integrity commitment
- 1.4 Research trail & confidence scoring
- 1.4.1 Research trail components
- 1.4.2 Scoring components
- 1.5 Data collection
- 1.5.1 Partial list of primary sources
- 1.6 Data mining sources
- 1.6.1 Paid sources
- 1.7 Base estimates and calculations
- 1.7.1 Base year calculation
- 1.8 Forecast model
- 1.9 Research transparency addendum
Chapter 2 Executive Summary
- 2.1 Industry 360° synopsis
- 2.2 Key market trends
- 2.2.1 Regional
- 2.2.2 Hypervisor
- 2.2.3 Vehicle
- 2.2.4 Level of autonomy
- 2.2.5 Sales channel
- 2.2.6 Application
- 2.3 TAM analysis, 2026-2035
- 2.4 CXO perspectives: Strategic imperatives
- 2.4.1 Executive decision points
- 2.4.2 Critical success factors
- 2.5 Future outlook
- 2.6 Strategic recommendations
Chapter 3 Industry Insights
- 3.1 Industry ecosystem analysis
- 3.1.1 Supplier landscape
- 3.1.2 Profit margin
- 3.1.3 Cost structure
- 3.1.4 Value addition at each stage
- 3.1.5 Factor affecting the value chain
- 3.1.6 Disruptions
- 3.2 Industry impact forces
- 3.2.1 Growth drivers
- 3.2.1.1 Shift toward software-defined vehicles (SDVs)
- 3.2.1.2 Rising ADAS and autonomous feature integration
- 3.2.1.3 ECU consolidation and cost optimization
- 3.2.1.4 Growing focus on functional safety and cybersecurity
- 3.2.2 Industry pitfalls and challenges
- 3.2.2.1 High integration and validation complexity
- 3.2.2.2 Limited aftermarket adoption
- 3.2.3 Market opportunities
- 3.2.3.1 Expansion of centralized and zonal vehicle architectures
- 3.2.3.2 Growth of electric and autonomous vehicles
- 3.2.3.3 Integration of OTA and connected services
- 3.2.3.4 Emerging demand from commercial and fleet vehicles
- 3.2.1 Growth drivers
- 3.3 Growth potential analysis
- 3.4 Regulatory landscape
- 3.4.1 North America
- 3.4.1.1 U.S. Department of Transportation (DOT) Standards
- 3.4.1.2 Occupational Safety and Health Administration (OSHA) Guidelines
- 3.4.1.3 U.S. Environmental Protection Agency (EPA)
- 3.4.2 Europe
- 3.4.2.1 EN ISO Container Standards
- 3.4.2.2 European Union Customs and Safety Regulations
- 3.4.2.3 BS EN / CEN Standards
- 3.4.2.4 National Standards (UNE, DIN, etc.)
- 3.4.3 Asia Pacific
- 3.4.3.1 China GB (Guobiao) Standards
- 3.4.3.2 Japan JIS Requirements
- 3.4.3.3 Korea KS Certification
- 3.4.3.4 Indian BIS Standards
- 3.4.3.5 Thai Industrial Standards Institute (TISI)
- 3.4.4 Latin America
- 3.4.4.1 INMETRO (National Institute of Metrology)
- 3.4.4.2 INTI certification (Instituto Nacional de Tecnologia Industrial)
- 3.4.4.3 NOM standards (Norma Official Mexicana)
- 3.4.5 Middle East & Africa
- 3.4.5.1 ESMA / Emirates Conformity Assessment Scheme (ECAS)
- 3.4.5.2 GCC technical regulations
- 3.4.5.3 SABS certification
- 3.4.1 North America
- 3.5 Porter's analysis
- 3.6 PESTEL analysis
- 3.7 Technology and innovation landscape
- 3.7.1 Current technological trends
- 3.7.2 Emerging technologies
- 3.8 Pricing analysis
- 3.8.1.1 Pricing by product
- 3.8.1.2 Pricing by region
- 3.9 Cost breakdown analysis
- 3.10 Patent analysis
- 3.11 Sustainability and environmental aspects
- 3.11.1 Sustainable practices
- 3.11.2 Waste reduction strategies
- 3.11.3 Energy efficiency in production
- 3.11.4 Eco-friendly initiatives
- 3.11.5 Carbon footprint considerations
- 3.12 Use cases
- 3.13 Hypervisor architecture & deployment models
- 3.13.1 Type-1 vs Type-2 vs mixed-criticality architecture
- 3.13.2 Centralized vs zonal ECU deployment
- 3.13.3 Multi-domain consolidation strategies (ADAS + IVI + body)
- 3.13.4 Performance, latency & determinism trade-offs
- 3.14 SoC compatibility and hardware co-design
- 3.15 Open-source vs proprietary hypervisor strategies
- 3.16 Functional safety and mixed-criticality management
Chapter 4 Competitive Landscape, 2025
- 4.1 Introduction
- 4.2 Company market share analysis
- 4.2.1 North America
- 4.2.2 Europe
- 4.2.3 Asia Pacific
- 4.2.4 LATAM
- 4.2.5 MEA
- 4.3 Competitive analysis of major market players
- 4.4 Competitive positioning matrix
- 4.5 Strategic outlook matrix
- 4.6 Key developments
- 4.6.1 Mergers & acquisitions
- 4.6.2 Partnerships & collaborations
- 4.6.3 New product launches
- 4.6.4 Expansion plans and funding
Chapter 5 Market Estimates & Forecast, By Hypervisor, 2022 - 2035 ($Mn)
- 5.1 Key trends
- 5.2 Bare-metal hypervisor
- 5.3 Hosted hypervisor
Chapter 6 Market Estimates & Forecast, By Level of Autonomy, 2022 - 2035 ($Mn)
- 6.1 Key trends
- 6.2 Semi-autonomous
- 6.3 Fully autonomous
Chapter 7 Market Estimates & Forecast, By Vehicle, 2022 - 2035 ($Mn)
- 7.1 Key trends
- 7.2 Passenger cars
- 7.2.1 Hatchback
- 7.2.2 Sedan
- 7.2.3 SUV
- 7.3 Commercial vehicle
- 7.3.1 LCV (Light commercial vehicle)
- 7.3.2 MCV (Medium commercial vehicle)
- 7.3.3 HCV (Heavy commercial vehicle)
Chapter 8 Market Estimates & Forecast, By Application, 2022 - 2035 ($Mn)
- 8.1 Key trends
- 8.2 ADAS (Advanced Driver Assistance Systems)
- 8.3 Infotainment & telematics
- 8.4 Powertrain & chassis control systems
- 8.5 Vehicle-to-everything (V2X) communication
- 8.6 Autonomous Driving Systems
Chapter 9 Market Estimates & Forecast, By Sales Channel, 2022 - 2035 ($Mn)
- 9.1 Key trends
- 9.2 OEM
- 9.3 Aftermarket
Chapter 10 Market Estimates & Forecast, By Region, 2022 - 2035 ($Mn)
- 10.1 Key trends
- 10.2 North America
- 10.2.1 US
- 10.2.2 Canada
- 10.3 Europe
- 10.3.1 Germany
- 10.3.2 UK
- 10.3.3 France
- 10.3.4 Italy
- 10.3.5 Spain
- 10.3.6 Nordics
- 10.3.7 Russia
- 10.3.8 Poland
- 10.3.9 Romania
- 10.4 Asia Pacific
- 10.4.1 China
- 10.4.2 India
- 10.4.3 Japan
- 10.4.4 South Korea
- 10.4.5 ANZ
- 10.4.6 Vietnam
- 10.4.7 Indonesia
- 10.5 Latin America
- 10.5.1 Brazil
- 10.5.2 Mexico
- 10.5.3 Argentina
- 10.6 MEA
- 10.6.1 South Africa
- 10.6.2 Saudi Arabia
- 10.6.3 UAE
Chapter 11 Company Profiles
- 11.1 Global companies
- 11.1.1 BlackBerry QNX
- 11.1.2 Continental
- 11.1.3 Green Hills Software
- 11.1.4 NVIDIA
- 11.1.5 NXP Semiconductors
- 11.1.6 Panasonic
- 11.1.7 Renesas Electronics
- 11.1.8 Robert Bosch
- 11.1.9 Siemens (Mentor Graphics)
- 11.1.10 Wind River Systems
- 11.2 Regional players
- 11.2.1 Aptiv
- 11.2.2 Infineon Technologies
- 11.2.3 OpenSynergy
- 11.2.4 Sasken Technologies
- 11.2.5 STMicroelectronics
- 11.2.6 Synopsys
- 11.2.7 SYSGO
- 11.2.8 Texas Instruments
- 11.2.9 Vector Informatik
- 11.2.10 VMware
- 11.3 Emerging players
- 11.3.1 Apex.AI
- 11.3.2 Lynx Software Technologies
- 11.3.3 OpenSynergy Ecosystem Partners
- 11.3.4 SafeRide Technologies
- 11.3.5 Virtual Open Systems
 汽車虛擬機器管理程序及混合重要性作業系統市場機會、成長要素、產業趨勢分析及2026-2035年預測
 汽車虛擬機器管理程序:市場佔有率分析、行業趨勢和統計數據、成長預測(2026-2031 年)
 汽車虛擬機器管理程式市場:按組件、應用、車輛類型、部署模式和最終用戶分類-2026-2032年全球市場預測
 2026年全球汽車虛擬機器管理程式市場報告
 嵌入式虛擬機器管理程式市場分析與預測(至2035年):類型、產品類型、服務、技術、元件、應用、部署模式、最終用戶、功能
 2026-2030年全球虛擬機器管理程式市場
 汽車虛擬管理程式市場規模、佔有率、成長及全球產業分析:按類型、應用和地區分類的洞察,2026-2034 年預測
 嵌入式虛擬機器管理程式市場,按組件、按類型、按技術、按最終用戶、按國家和地區 - 2025 年至 2032 年全球行業分析、市場規模、市場佔有率和預測
 2025-2029年全球汽車虛擬機器管理程式市場
 汽車用管理程序的全球市場:車輛類別,各產品類型,自動化類別,各地區,機會,預測,2018年~2032年