

 |
市場調查報告書
商品編碼
1913395
交通感測器市場:市場機會、成長促進因素、產業趨勢分析及預測(2026-2035)Traffic Sensors Market Opportunity, Growth Drivers, Industry Trend Analysis, and Forecast 2026 - 2035 |
||||||
全球交通感測器市場預計到 2025 年將達到 7.404 億美元,到 2035 年將達到 17 億美元,年複合成長率為 8.9%。
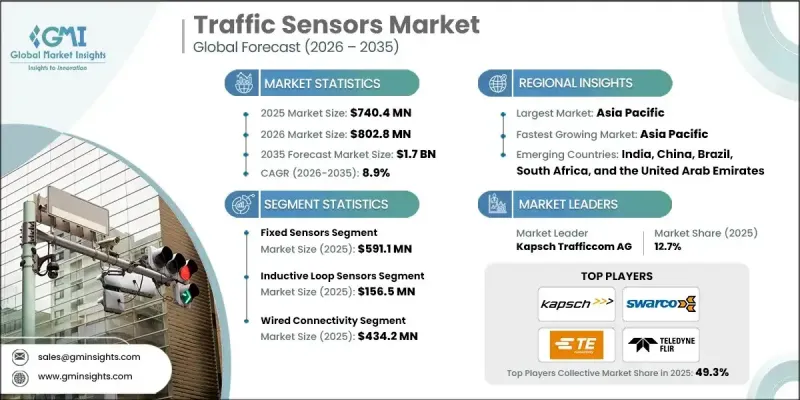
市場成長的促進因素包括:智慧城市計畫的加速推進、對即時交通監控需求的不斷成長、與互聯出行和自動駕駛生態系統更緊密的合作、公共部門對智慧交通項目的重視,以及感測器設計和物聯網連接技術的持續進步。交通管理部門正擴大採用即時交通管理平台,利用感測器和連網基礎設施的連續資料流來改善交通流量、緩解擁塞並提昇道路安全。這些系統能夠實現更快的營運響應、動態控制交通號誌燈,並提升城際和市內交通網路的整體效能。各國政府正優先考慮採用融合先進感測和監控技術的智慧出行系統,以支援更安全的道路使用和更高的法規。整合式交通智慧平台支援預測性交通分析、協同事件應變和高效的出行規劃,從而與更廣泛的城市交通和安全目標相契合。
| 市場覆蓋範圍 | |
|---|---|
| 開始年份 | 2025 |
| 預測期 | 2026-2035 |
| 初始市場規模 | 7.404億美元 |
| 市場規模預測 | 17億美元 |
| 複合年成長率 | 8.9% |
政府機構正加大對智慧交通網路的投資,這些網路融合了先進的感測技術,旨在提升營運效率和道路安全。這些措施著重於即時交通視覺化、事件預測偵測和協同應變機制,這些措施共同建構了更安全、更可靠的道路基礎設施,並推動了城市交通戰略的發展。
預計從 2026 年到 2035 年,攜帶式和行動感測器市場將以 11.6% 的複合年成長率成長。該市場的成長是由對靈活的交通監控解決方案的需求驅動的,這些解決方案不需要永久性基礎設施,可以快速部署和經濟高效地收集數據,從而支持在規劃和運營用例中廣泛採用。
預計到2025年,有線連接領域的市場規模將達到4.342億美元。有線感測器系統因其可靠性和高容量資料傳輸能力而被廣泛應用於集中式交通控制系統。對基於光纖的智慧型運輸系統(ITS)的持續投資,有助於實現自適應交通控制,並提高密集城區道路的安全性。
預計到2025年,北美交通感測器市場佔有率將達到28.7%。區域成長主要得益於美國和加拿大主導持續增加對智慧城市建設和智慧交通計畫的公共投資。人工智慧驅動的分析、物聯網連接和自適應交通控制技術的融合,正在提升即時交通運行和緊急管理能力。世界各國政府也積極推動現代化改造和維修舉措,將非侵入式感測器和邊緣運算分析技術融入其中。
目錄
第1章:分析方法和範圍
第2章執行摘要
第3章業界考察
- 產業生態系分析
- 供應商情況
- 利潤率
- 成本結構
- 每個階段的附加價值
- 影響價值鏈的因素
- 中斷
- 產業影響因素
- 促進要素
- 擴大智慧城市基礎設施的應用
- 對即時交通管理和監控的需求日益成長
- 與自動駕駛和聯網汽車系統的整合
- 政府在道路安全和智慧交通系統方面的舉措
- 感測器技術和物聯網連接技術的進步
- 潛在風險和挑戰
- 安裝和維護成本高昂
- 資料隱私和安全問題
- 促進要素
- 成長潛力分析
- 監管環境
- 北美洲
- 歐洲
- 亞太地區
- 拉丁美洲
- 中東和非洲
- 波特五力分析
- PESTEL 分析
- 科技與創新趨勢
- 當前技術趨勢
- 新興技術
- 新興經營模式
- 合規要求
- 對永續性的承諾
- 供應鏈韌性
- 地緣政治分析
- 數位轉型 (DX)
第4章 競爭情勢
- 介紹
- 公司市佔率分析
- 按地區
- 北美洲
- 歐洲
- 亞太地區
- 拉丁美洲
- 中東和非洲
- 市場集中度分析
- 按地區
- 主要企業的競爭分析
- 產品系列比較
- 產品線的廣度
- 科技
- 創新
- 按地區分類的企業發展比較
- 全球企業發展分析
- 服務網路覆蓋
- 按地區分類的市場滲透率
- 競爭定位矩陣
- 領導者
- 挑戰者
- 追蹤者
- 小眾玩家
- 戰略展望矩陣
- 產品系列比較
- 主要趨勢(2022-2025)
- 企業合併(M&A)
- 商業夥伴關係與合作
- 技術進步
- 業務拓展與投資策略
- 永續發展計劃
- 數位轉型 (DX) 計劃
- 新興/Start-Ups競賽的趨勢
第5章 依產品類型分類的市場估算與預測(2022-2035 年)
- 感應線圈感測器
- 磁感測器
- 雷達感測器
- 紅外線感測器
- 影像/影像處理感應器
- 雷射/LiDAR感測器
- 其他
第6章 依安裝方式分類的市場估算與預測(2022-2035 年)
- 固定感測器
- 嵌入式(安裝在路面內)
- 地面安裝(桿式/龍門架式)
- 攜帶式/移動式感應器
- 臨時路邊單元
- 車載系統
第7章 依連結類型分類的市場估算與預測(2022-2035 年)
- 有線連接
- 無線連線
- 蜂窩網路(4G/5G)
- LPWAN(LoRa、NB-IoT)
- Wi-Fi/BLE
第8章 按應用領域分類的市場估算與預測(2022-2035 年)
- 交通流量/事故監測
- 電子收費系統(ETC)
- 車輛重量執法
- 車輛分類與分析
- 出入及停車管理
- 其他
第9章 各地區市場估算與預測(2022-2035 年)
- 北美洲
- 美國
- 加拿大
- 歐洲
- 德國
- 英國
- 法國
- 西班牙
- 義大利
- 荷蘭
- 亞太地區
- 中國
- 印度
- 日本
- 澳洲
- 韓國
- 拉丁美洲
- 巴西
- 墨西哥
- 阿根廷
- 中東和非洲
- 沙烏地阿拉伯
- 南非
- 阿拉伯聯合大公國
第10章:公司簡介
- 主要企業
- TE Connectivity
- Microchip Technology Inc.
- ST Engineering
- NXP Semiconductors
- Infineon Technologies AG
- 各地區的主要企業
- 北美洲
- Econolite
- International Road Dynamics Inc.
- Iteris, Inc.
- Sensys Networks
- Teledyne FLIR LLC
- 歐洲
- Kapsch Trafficcom AG
- Q-Free ASA
- SWARCO
- Smart Microwave Sensors GmbH
- Sick AG
- 亞太地區
- Kyosan Electric Mfg. Co., Ltd.
- Kistler Group
- 北美洲
- 小眾/顛覆性公司
- Iteris, Inc.
- Sensys Networks
The Global Traffic Sensors Market was valued at USD 740.4 million in 2025 and is estimated to grow at a CAGR of 8.9% to reach USD 1.7 billion by 2035.
Market growth is driven by accelerating adoption of smart city frameworks, increasing need for real-time traffic observation, closer integration with connected and autonomous mobility ecosystems, public-sector focus on intelligent transportation programs, and continuous progress in sensor design and IoT-enabled connectivity. Traffic authorities are increasingly deploying real-time traffic management platforms that rely on continuous data streams from sensors and connected infrastructure to improve traffic flow, limit congestion, and enhance roadway safety. These systems enable faster operational responses, dynamic control of traffic signals, and improved performance across urban and intercity transport networks. Governments are prioritizing intelligent mobility systems that incorporate advanced sensing and monitoring technologies to support safer road usage and better compliance. Integrated traffic intelligence platforms are supporting predictive traffic analysis, coordinated incident response, and more efficient mobility planning, aligning with broader urban transportation and safety objectives.
| Market Scope | |
|---|---|
| Start Year | 2025 |
| Forecast Year | 2026-2035 |
| Start Value | $740.4 million |
| Forecast Value | $1.7 billion |
| CAGR | 8.9% |
Government agencies are described as intensifying investments in smart transportation networks that embed advanced sensing capabilities to improve operational efficiency and roadway safety. These initiatives focus on real-time traffic visibility, predictive incident detection, and coordinated response mechanisms that collectively support safer and more reliable road infrastructure while advancing urban mobility strategies.
The portable and mobile sensors segment will grow at a CAGR of 11.6% during 2026 to 2035. Growth in this segment is attributed to demand for flexible traffic monitoring solutions that allow rapid deployment and cost-efficient data collection without permanent infrastructure requirements, supporting wider adoption across planning and operational use cases.
The wired connectivity segment generated USD 434.2 million in 2025. Wired sensor systems are described as being widely implemented due to their reliability and capacity to support high-volume data transmission for centralized traffic control systems. Continued investment in fiber-based intelligent transportation infrastructure is supporting adaptive traffic control and improved safety across dense urban corridors.
North America Traffic Sensors Market accounted for 28.7% share in 2025. Regional growth is driven by sustained public investment in smart city development and intelligent transportation programs, led by the United States and Canada. Integration of AI-driven analytics, IoT connectivity, and adaptive traffic control technologies is enhancing real-time traffic operations and emergency management. Governments globally are also pursuing modernization and retrofit initiatives that incorporate non-intrusive sensors and edge-based analytical capabilities.
Key companies operating in the Global Traffic Sensors Market include NXP Semiconductors, Kapsch Trafficcom AG, SWARCO, TE Connectivity, Sensys Networks, Econolite, Microchip Technology Inc., Q-Free ASA, Iteris, Inc., Infineon Technologies AG, Kistler Group, Sick AG, Smart Microwave Sensors GmbH, ST Engineering, International Road Dynamics Inc., Kyosan Electric Mfg. Co., Ltd., and Teledyne FLIR LLC. Companies active in the Traffic Sensors Market are strengthening their market position through continuous technology innovation, system integration, and strategic partnerships. Many players are focusing on enhancing sensor accuracy, durability, and interoperability with smart transportation platforms. Expansion of IoT-enabled and edge analytics solutions is helping deliver faster data processing and improved decision-making. Firms are also investing in scalable architectures to support urban expansion and infrastructure upgrades.
Table of Contents
Chapter 1 Methodology and Scope
- 1.1 Market scope and definition
- 1.2 Research design
- 1.2.1 Research approach
- 1.2.2 Data collection methods
- 1.3 Data mining sources
- 1.3.1 Global
- 1.3.2 Regional/Country
- 1.4 Base estimates and calculations
- 1.4.1 Base year calculation
- 1.4.2 Key trends for market estimation
- 1.5 Primary research and validation
- 1.5.1 Primary sources
- 1.6 Forecast model
- 1.7 Research assumptions and limitations
Chapter 2 Executive Summary
- 2.1 Industry 3600 synopsis
- 2.2 Key market trends
- 2.2.1 Product type trends
- 2.2.2 Installation type trends
- 2.2.3 Connectivity trends
- 2.2.4 Application trends
- 2.2.5 Regional trends
- 2.3 TAM Analysis, 2026-2035 (USD Million)
- 2.4 CXO perspectives: Strategic imperatives
- 2.4.1 Executive decision points
- 2.4.2 Critical success factors
- 2.5 Future outlook and strategic recommendations
Chapter 3 Industry Insights
- 3.1 Industry ecosystem analysis
- 3.1.1 Supplier landscape
- 3.1.2 Profit margin
- 3.1.3 Cost structure
- 3.1.4 Value addition at each stage
- 3.1.5 Factor affecting the value chain
- 3.1.6 Disruptions
- 3.2 Industry impact forces
- 3.2.1 Growth drivers
- 3.2.1.1 Increasing adoption of smart city infrastructure
- 3.2.1.2 Rising demand for real-time traffic management and monitoring
- 3.2.1.3 Integration with autonomous and connected vehicle systems
- 3.2.1.4 Government initiatives for road safety and intelligent transportation
- 3.2.1.5 Advancements in sensor technologies and IoT connectivity
- 3.2.2 Pitfalls and challenges
- 3.2.2.1 High installation and maintenance costs
- 3.2.2.2 Data privacy and security concerns
- 3.2.1 Growth drivers
- 3.3 Growth potential analysis
- 3.4 Regulatory landscape
- 3.4.1 North America
- 3.4.2 Europe
- 3.4.3 Asia Pacific
- 3.4.4 Latin America
- 3.4.5 Middle East & Africa
- 3.5 Porter's analysis
- 3.6 PESTEL analysis
- 3.7 Technology and Innovation landscape
- 3.7.1 Current technological trends
- 3.7.2 Emerging technologies
- 3.8 Emerging Business Models
- 3.9 Compliance Requirements
- 3.10 Sustainability Initiatives
- 3.11 Supply Chain Resilience
- 3.12 Geopolitical Analysis
- 3.13 Digital Transformation
Chapter 4 Competitive Landscape, 2025
- 4.1 Introduction
- 4.2 Company market share analysis
- 4.2.1 By region
- 4.2.1.1 North America
- 4.2.1.2 Europe
- 4.2.1.3 Asia Pacific
- 4.2.1.4 Latin America
- 4.2.1.5 Middle East & Africa
- 4.2.2 Market concentration analysis
- 4.2.1 By region
- 4.3 Competitive benchmarking of key players
- 4.3.1 Product portfolio comparison
- 4.3.1.1 Product range breadth
- 4.3.1.2 Technology
- 4.3.1.3 Innovation
- 4.3.2 Geographic presence comparison
- 4.3.2.1 Global footprint analysis
- 4.3.2.2 Service network coverage
- 4.3.2.3 Market penetration by region
- 4.3.3 Competitive positioning matrix
- 4.3.3.1 Leaders
- 4.3.3.2 Challengers
- 4.3.3.3 Followers
- 4.3.3.4 Niche players
- 4.3.4 Strategic outlook matrix
- 4.3.1 Product portfolio comparison
- 4.4 Key developments, 2022-2025
- 4.4.1 Mergers and acquisitions
- 4.4.2 Partnerships and collaborations
- 4.4.3 Technological advancements
- 4.4.4 Expansion and investment strategies
- 4.4.5 Sustainability initiatives
- 4.4.6 Digital transformation initiatives
- 4.5 Emerging/ startup competitors landscape
Chapter 5 Market Estimates and Forecast, By Product Type, 2022 - 2035 (USD Million & Units)
- 5.1 Key trends
- 5.2 Inductive loop sensors
- 5.3 Magnetic sensors
- 5.4 Radar sensors
- 5.5 Infrared sensors
- 5.6 Video/image processing sensors
- 5.7 Laser/LiDAR sensors
- 5.8 Others
Chapter 6 Market Estimates and Forecast, By Installation Type, 2022 - 2035 (USD Million & Units)
- 6.1 Key trends
- 6.2 Fixed sensors
- 6.2.1 Embedded (in-road)
- 6.2.2 Above-ground (pole/gantry mounted)
- 6.3 Portable / mobile sensors
- 6.3.1 Temporary roadside units
- 6.3.2 Vehicle-mounted systems
Chapter 7 Market Estimates and Forecast, By Connectivity, 2022 - 2035 (USD Million & Units)
- 7.1 Key trends
- 7.2 Wired connectivity
- 7.3 Wireless connectivity
- 7.3.1 Cellular (4G/5G)
- 7.3.2 LPWAN (LoRa, NB-IoT)
- 7.3.3 Wi-Fi/BLE
Chapter 8 Market Estimates and Forecast, By Application, 2022 - 2035 (USD Million & Units)
- 8.1 Key trends
- 8.2 Traffic flow & incident monitoring
- 8.3 Electronic toll collection
- 8.4 Vehicle weight enforcement
- 8.5 Vehicle classification & profiling
- 8.6 Access & parking management
- 8.7 Others
Chapter 9 Market Estimates and Forecast, By Region, 2022 - 2035 (USD Million & Units)
- 9.1 Key trends
- 9.2 North America
- 9.2.1 U.S.
- 9.2.2 Canada
- 9.3 Europe
- 9.3.1 Germany
- 9.3.2 UK
- 9.3.3 France
- 9.3.4 Spain
- 9.3.5 Italy
- 9.3.6 Netherlands
- 9.4 Asia Pacific
- 9.4.1 China
- 9.4.2 India
- 9.4.3 Japan
- 9.4.4 Australia
- 9.4.5 South Korea
- 9.5 Latin America
- 9.5.1 Brazil
- 9.5.2 Mexico
- 9.5.3 Argentina
- 9.6 Middle East and Africa
- 9.6.1 Saudi Arabia
- 9.6.2 South Africa
- 9.6.3 UAE
Chapter 10 Company Profiles
- 10.1 Global Key Players
- 10.1.1 TE Connectivity
- 10.1.2 Microchip Technology Inc.
- 10.1.3 ST Engineering
- 10.1.4 NXP Semiconductors
- 10.1.5 Infineon Technologies AG
- 10.2 Regional Key Players
- 10.2.1 North America
- 10.2.1.1 Econolite
- 10.2.1.2 International Road Dynamics Inc.
- 10.2.1.3 Iteris, Inc.
- 10.2.1.4 Sensys Networks
- 10.2.1.5 Teledyne FLIR LLC
- 10.2.2 Europe
- 10.2.2.1 Kapsch Trafficcom AG
- 10.2.2.2 Q-Free ASA
- 10.2.2.3 SWARCO
- 10.2.2.4 Smart Microwave Sensors GmbH
- 10.2.2.5 Sick AG
- 10.2.3 Asia Pacific
- 10.2.3.1 Kyosan Electric Mfg. Co., Ltd.
- 10.2.3.2 Kistler Group
- 10.2.1 North America
- 10.3 Niche / Disruptors
- 10.3.1 Iteris, Inc.
- 10.3.2 Sensys Networks
 交通感測器市場-2026-2032年全球市場預測
 交通感測器:市場佔有率分析、產業趨勢與統計、成長預測(2026-2031)
 交通感測器市場:按感測器類型、應用、最終用戶和地區分類
 交通感測器市場分析及預測(至2035年):按類型、產品類型、服務、技術、組件、應用、最終用戶、安裝類型和解決方案分類
 交通感測器市場規模、佔有率、成長及全球產業分析:按類型、應用和地區分類的洞察,2026-2034 年預測
 交通感測器市場 - 全球產業規模、佔有率、趨勢、機會和預測(按感測器類型、技術、應用、地區和競爭格局分類,2021-2031 年)
 交通感測器市場規模、佔有率和成長分析(按類型、技術、應用和地區分類)—2026-2033年產業預測
 交通感測器市場規模、佔有率、趨勢分析報告:按類型、技術、應用、地區、細分市場預測,2024-2030