


 |
市場調查報告書
商品編碼
1913374
奈米銀線市場:市場機會、成長促進因素、產業趨勢分析及預測(2026-2035)Silver Nanowires Market Opportunity, Growth Drivers, Industry Trend Analysis, and Forecast 2026 - 2035 |
||||||
全球奈米銀線市場預計到 2025 年將達到 18 億美元,到 2035 年將達到 210 億美元,年複合成長率為 27.9%。
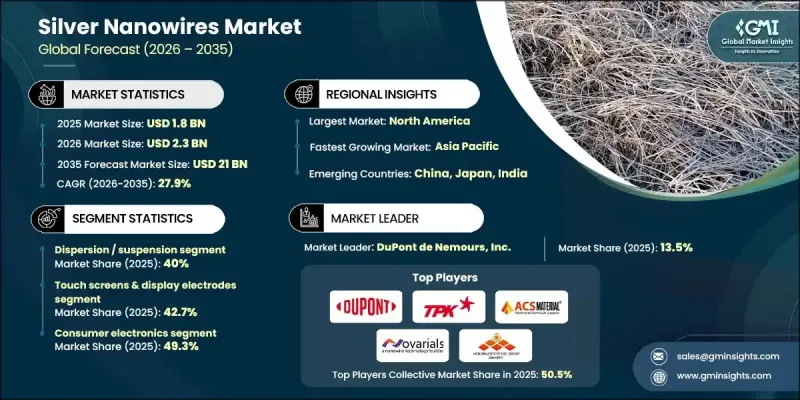
市場成長的驅動力在於下一代電子系統中對先進導電材料的日益廣泛應用,這些系統需要柔軟性、輕量化結構和高性能。奈米銀線因其優異的導電性、高光學透明度和機械適應性,正日益成為支持創新裝置架構開發的首選材料。對緊湊型、多功能和攜帶式電子解決方案日益成長的需求,正在加速可印刷塗層和導電油墨的研究,從而強化奈米銀線在新興應用中的作用。製造商正在擴大產能,以滿足不斷成長的產量需求,同時保持材料的一致性和成本效益。同時,對永續能源基礎設施的持續投資,也推動了對透明、軟性導電材料的需求,這些材料能夠提高性能效率和耐久性。這些趨勢共同促成了奈米銀線在快速發展的技術生態系統中的關鍵地位,而持續的創新有望進一步鞏固其長期市場成長。
| 市場覆蓋範圍 | |
|---|---|
| 開始年份 | 2025 |
| 預測期 | 2026-2035 |
| 初始市場規模 | 18億美元 |
| 市場規模預測 | 210億美元 |
| 複合年成長率 | 27.9% |
預計到 2025 年,油墨/漿料業務的收入將達到 5 億美元。隨著精密沉積技術和印刷電子製造技術的廣泛應用,該業務的重要性日益凸顯,這些技術能夠實現可擴展、經濟高效的生產,同時保持高導電性和均勻性。
預計到 2035 年,醫療和醫療設備領域將以 26.5% 的複合年成長率成長。奈米銀線因其兼具機械柔軟性和穩定的電氣性能,使其適用於複雜的設備設計,因此擴大被整合到先進的感測和診斷平台中。
預計到2025年,北美奈米銀線市場規模將達到8.652億美元,並在整個預測期內保持強勁成長動能。該地區的主導地位得益於對先進製造技術、材料科學研究和技術商業化的大力投資,以及有利的政策框架和創新驅動的供應鏈。
目錄
第1章:分析方法和範圍
第2章執行摘要
第3章業界考察
- 產業生態系分析
- 供應商情況
- 利潤率
- 每個階段的附加價值
- 影響價值鏈的因素
- 中斷
- 產業影響因素
- 促進要素
- 對觸控螢幕和顯示器的需求不斷成長
- 軟性印刷電子技術的擴展
- 擴大可再生能源和儲能應用
- 產業潛在風險與挑戰
- 奈米銀線製造成本高昂
- 來自其他透明導電材料的競爭
- 耐久性和氧化問題
- 市場機遇
- 汽車智慧電子產品的發展
- 生物醫學和醫療設備領域的擴張
- 亞太新興市場
- 促進要素
- 成長潛力分析
- 監管環境
- 北美洲
- 歐洲
- 亞太地區
- 拉丁美洲
- 中東和非洲
- 波特五力分析
- PESTEL 分析
- 價格趨勢
- 按地區
- 按產品形狀
- 未來市場趨勢
- 科技與創新趨勢
- 當前技術趨勢
- 新興技術
- 專利狀態
- 貿易統計(HS編碼)(註:僅提供主要國家的貿易統計)
- 主要進口國
- 主要出口國
- 永續性和環境方面
- 永續努力
- 減少廢棄物策略
- 生產中的能源效率
- 環保舉措
- 考慮到碳足跡
第4章 競爭情勢
- 介紹
- 公司市佔率分析
- 按地區
- 北美洲
- 歐洲
- 亞太地區
- 拉丁美洲
- 中東和非洲
- 按地區
- 企業矩陣分析
- 主要市場公司的競爭分析
- 競爭定位矩陣
- 重大進展
- 併購
- 夥伴關係與合作
- 新產品發布
- 業務拓展計劃
第5章 依產品類型分類的市場估算與預測(2022-2035 年)
- 分散體/懸浮液
- 墨水/漿糊
- 透明導電膜(TCF)
- 乾粉/氣凝膠
第6章 按應用領域分類的市場估算與預測(2022-2035 年)
- 觸控螢幕顯示器電極
- 軟性/印刷電子
- 透明加熱器
- 太陽能發電和儲能
- 感測和生物感測器
- 有機發光二極體(OLED)/發光二極體(LED)裝置
- 抗菌材料
- 電磁干擾 (EMI) 屏蔽和溫度控管
7. 依最終用途分類的市場估計與預測(2022-2035 年)
- 家用電子電器
- 汽車/運輸設備
- 醫療和醫療設備
- 能源與公共產業
- 建築/施工
- 紡織服裝
- 工業和製造業
第8章 各地區市場估算與預測(2022-2035 年)
- 北美洲
- 美國
- 加拿大
- 歐洲
- 德國
- 英國
- 法國
- 西班牙
- 義大利
- 其他歐洲
- 亞太地區
- 中國
- 印度
- 日本
- 澳洲
- 韓國
- 亞太其他地區
- 拉丁美洲
- 巴西
- 墨西哥
- 阿根廷
- 其他拉丁美洲
- 中東和非洲
- 沙烏地阿拉伯
- 南非
- 阿拉伯聯合大公國
- 其他中東和非洲地區
第9章:公司簡介
- ACS Material, LLC
- Blue Nano, Inc.
- DuPont de Nemours, Inc.
- Guangzhou Hongwu Material Technology Co., Ltd.
- Materic LLC
- Nanogap Sub-nm Powder SA
- NanoTechLabs, Inc.
- Novarials Corporation
- Suzhou Cold Stone Nano Material Technology Co., Ltd.
- TPK Holding Co., Ltd.
The Global Silver Nanowires Market was valued at USD 1.8 billion in 2025 and is estimated to grow at a CAGR of 27.9% to reach USD 21 billion by 2035.
Market growth is supported by the rising adoption of advanced conductive materials across next-generation electronic systems that require flexibility, lightweight structures, and high performance. Silver nanowires are increasingly preferred due to their superior electrical conductivity, high optical clarity, and mechanical adaptability, which support the development of innovative device architectures. Growing demand for compact, multifunctional, and portable electronic solutions is accelerating research into printable coatings and conductive inks, strengthening the role of silver nanowires across emerging applications. Manufacturers are also scaling production capabilities to meet rising volume requirements while maintaining material consistency and cost efficiency. In parallel, increasing investments in sustainable energy infrastructure are driving demand for transparent and flexible conductive materials that improve performance efficiency and durability. These combined trends are positioning silver nanowires as a critical component across rapidly expanding technology ecosystems, with continued innovation expected to reinforce long-term market growth.
| Market Scope | |
|---|---|
| Start Year | 2025 |
| Forecast Year | 2026-2035 |
| Start Value | $1.8 Billion |
| Forecast Value | $21 Billion |
| CAGR | 27.9% |
The inks and pastes segment generated USD 0.5 billion in 2025. This segment is gaining importance as precision deposition techniques and printed electronics manufacturing gain wider acceptance, enabling scalable and cost-effective production while maintaining high conductivity and uniformity.
The healthcare and medical device segment is projected to grow at a CAGR of 26.5% through 2035. Silver nanowires are increasingly integrated into advanced sensing and diagnostic platforms, supported by their ability to deliver stable electrical performance alongside mechanical flexibility suited to complex device designs.
North America Silver Nanowires Market reached USD 865.2 million in 2025 and is expected to maintain attractive growth through the forecast period. Regional leadership is driven by strong investment in advanced manufacturing, material science research, and technology commercialization, along with supportive policy frameworks and innovation-focused supply chains.
Key companies operating in the Global Silver Nanowires Market include DuPont de Nemours, Inc., TPK Holding Co., Ltd., NanoTechLabs, Inc., ACS Material, LLC, Nanogap Sub-nm Powder S.A., Materic LLC, Guangzhou Hongwu Material Technology Co., Ltd., Novarials Corporation, Blue Nano, Inc., and Suzhou Cold Stone Nano Material Technology Co., Ltd. Companies in the Global Silver Nanowires Market are strengthening their market position by prioritizing scalable production methods and improving material uniformity to meet rising commercial demand. Many players are investing heavily in research and development to enhance conductivity, transparency, and durability while reducing overall material costs. Strategic collaborations with downstream manufacturers are enabling faster product integration and customized solutions. Firms are also expanding their global distribution networks to improve supply reliability and market access.
Table of Contents
Chapter 1 Methodology & Scope
- 1.1 Market scope and definition
- 1.2 Research design
- 1.2.1 Research approach
- 1.2.2 Data collection methods
- 1.3 Data mining sources
- 1.3.1 Global
- 1.3.2 Regional/Country
- 1.4 Base estimates and calculations
- 1.4.1 Base year calculation
- 1.4.2 Key trends for market estimation
- 1.5 Primary research and validation
- 1.5.1 Primary sources
- 1.6 Forecast model
- 1.7 Research assumptions and limitations
Chapter 2 Executive Summary
- 2.1 Industry 3600 synopsis
- 2.2 Key market trends
- 2.2.1 Regional
- 2.2.2 Product Form
- 2.2.3 Application
- 2.2.4 End Use
- 2.3 TAM Analysis, 2025-2034
- 2.4 CXO perspectives: Strategic imperatives
- 2.4.1 Executive decision points
- 2.4.2 Critical success factors
- 2.5 Future Outlook and Strategic Recommendations
Chapter 3 Industry Insights
- 3.1 Industry ecosystem analysis
- 3.1.1 Supplier landscape
- 3.1.2 Profit margin
- 3.1.3 Value addition at each stage
- 3.1.4 Factor affecting the value chain
- 3.1.5 Disruptions
- 3.2 Industry impact forces
- 3.2.1 Growth drivers
- 3.2.1.1 Growing demand for touchscreens & displays
- 3.2.1.2 Expansion of flexible & printed electronics
- 3.2.1.3 Rising renewable energy & energy storage applications
- 3.2.2 Industry pitfalls and challenges
- 3.2.2.1 High manufacturing cost of silver nanowires
- 3.2.2.2 Competition from alternative transparent conductors
- 3.2.2.3 Durability & oxidation issues
- 3.2.3 Market opportunities
- 3.2.3.1 Growth in automotive smart electronics
- 3.2.3.2 Expansion in biomedical & healthcare devices
- 3.2.3.3 Emerging markets in Asia Pacific
- 3.2.1 Growth drivers
- 3.3 Growth potential analysis
- 3.4 Regulatory landscape
- 3.4.1 North America
- 3.4.2 Europe
- 3.4.3 Asia Pacific
- 3.4.4 Latin America
- 3.4.5 Middle East & Africa
- 3.5 Porter's analysis
- 3.6 PESTEL analysis
- 3.7 Price trends
- 3.7.1 By region
- 3.7.2 By product form
- 3.8 Future market trends
- 3.9 Technology and Innovation landscape
- 3.9.1 Current technological trends
- 3.9.2 Emerging technologies
- 3.10 Patent Landscape
- 3.11 Trade statistics (HS code) ( Note: the trade statistics will be provided for key countries only)
- 3.11.1 Major importing countries
- 3.11.2 Major exporting countries
- 3.12 Sustainability and environmental aspects
- 3.12.1 Sustainable practices
- 3.12.2 Waste reduction strategies
- 3.12.3 Energy efficiency in production
- 3.12.4 Eco-friendly initiatives
- 3.13 Carbon footprint consideration
Chapter 4 Competitive Landscape, 2025
- 4.1 Introduction
- 4.2 Company market share analysis
- 4.2.1 By region
- 4.2.1.1 North America
- 4.2.1.2 Europe
- 4.2.1.3 Asia Pacific
- 4.2.1.4 LATAM
- 4.2.1.5 MEA
- 4.2.1 By region
- 4.3 Company matrix analysis
- 4.4 Competitive analysis of major market players
- 4.5 Competitive positioning matrix
- 4.6 Key developments
- 4.6.1 Mergers & acquisitions
- 4.6.2 Partnerships & collaborations
- 4.6.3 New Product Launches
- 4.6.4 Expansion Plans
Chapter 5 Market Estimates and Forecast, By Product Form, 2022-2035 (USD Billion) (Kilo Tons)
- 5.1 Key trends
- 5.2 Dispersion/Suspension
- 5.3 Ink/Paste
- 5.4 Transparent Conductive Film (TCF)
- 5.5 Dry Powder/Aerogel
Chapter 6 Market Estimates and Forecast, By Application, 2022-2035 (USD Billion) (Kilo Tons)
- 6.1 Key trends
- 6.2 Touch Screens & Display Electrodes
- 6.3 Flexible/Printed Electronics
- 6.4 Transparent Heaters
- 6.5 Photovoltaics & Energy Storage
- 6.6 Sensing & Biosensors
- 6.7 OLED/LED Devices
- 6.8 Antimicrobial Materials
- 6.9 EMI Shielding & Thermal Management
Chapter 7 Market Estimates and Forecast, By End Use, 2022-2035 (USD Billion) (Kilo Tons)
- 7.1 Key trends
- 7.2 Consumer Electronics
- 7.3 Automotive & Transportation
- 7.4 Healthcare & Medical Devices
- 7.5 Energy & Utilities
- 7.6 Building & Construction
- 7.7 Textile & Apparel
- 7.8 Industrial & Manufacturing
Chapter 8 Market Estimates and Forecast, By Region, 2022-2035 (USD Billion) (Kilo Tons)
- 8.1 Key trends
- 8.2 North America
- 8.2.1 U.S.
- 8.2.2 Canada
- 8.3 Europe
- 8.3.1 Germany
- 8.3.2 UK
- 8.3.3 France
- 8.3.4 Spain
- 8.3.5 Italy
- 8.3.6 Rest of Europe
- 8.4 Asia Pacific
- 8.4.1 China
- 8.4.2 India
- 8.4.3 Japan
- 8.4.4 Australia
- 8.4.5 South Korea
- 8.4.6 Rest of Asia Pacific
- 8.5 Latin America
- 8.5.1 Brazil
- 8.5.2 Mexico
- 8.5.3 Argentina
- 8.5.4 Rest of Latin America
- 8.6 Middle East and Africa
- 8.6.1 Saudi Arabia
- 8.6.2 South Africa
- 8.6.3 UAE
- 8.6.4 Rest of Middle East and Africa
Chapter 9 Company Profiles
- 9.1 ACS Material, LLC
- 9.2 Blue Nano, Inc.
- 9.3 DuPont de Nemours, Inc.
- 9.4 Guangzhou Hongwu Material Technology Co., Ltd.
- 9.5 Materic LLC
- 9.6 Nanogap Sub-nm Powder S.A.
- 9.7 NanoTechLabs, Inc.
- 9.8 Novarials Corporation
- 9.9 Suzhou Cold Stone Nano Material Technology Co., Ltd.
- 9.10 TPK Holding Co., Ltd.


