

 |
市場調查報告書
商品編碼
1913358
虛擬製作市場機會、成長要素、產業趨勢分析及2026年至2035年預測Virtual Production Market Opportunity, Growth Drivers, Industry Trend Analysis, and Forecast 2026 - 2035 |
||||||
全球虛擬製作市場預計到 2025 年將達到 29 億美元,到 2035 年將達到 185 億美元,年複合成長率為 21.1%。
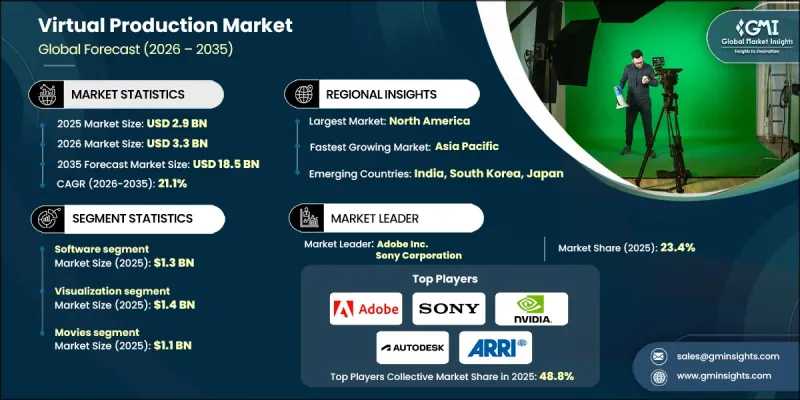
推動市場成長的因素包括:電影製作中視覺特效(VFX)的日益普及、廣告中虛擬技術的廣泛應用,以及虛擬製作工作室中LED幕牆LED幕牆技術正在改變整個產業,使工作室能夠即時動態調整逼真的數位環境,從而無需建造大規模實體佈景和多個拍攝地點。這項創新從根本上改變了內容製作的速度和擴充性,提高了創造性柔軟性,大幅縮短了製作時間和成本,並使電影製作人能夠高效地創建龐大而沉浸式的世界。
| 市場覆蓋範圍 | |
|---|---|
| 開始年份 | 2025 |
| 預測年份 | 2026-2035 |
| 起始值 | 29億美元 |
| 預測金額 | 185億美元 |
| 複合年成長率 | 21.1% |
預計到2025年,軟體產業的收入將達到13億美元。這一成長主要得益於對高級視覺特效工具、即時渲染解決方案和人工智慧驅動的軟體應用日益成長的需求。為了滿足不斷成長的需求,各公司正致力於改進即時渲染技術、提高人工智慧自動化程度,並為娛樂、遊戲和廣告產業開發可擴展的軟體解決方案。
預計從 2026 年到 2035 年,全即時LED幕牆市場將以 25.3% 的複合年成長率成長。虛擬製作中對沉浸式、可變背景的需求不斷成長,推動了這一成長,因為全即時LED幕牆可以提供逼真且適應性強的環境,同時降低與實體佈景相關的成本和時間。
受美國蓬勃發展的娛樂產業、技術普及以及電影、遊戲和廣告業對創新解決方案的需求所推動,預計到2025年,美國虛擬製作市場規模將達到9.914億美元。各公司正致力於推廣虛擬製作技術、增強視覺特效能力並最佳化服務,以滿足美國市場的特定需求。
目錄
第1章調查方法和範圍
第2章執行摘要
第3章業界考察
- 生態系分析
- 供應商情況
- 利潤率
- 成本結構
- 每個階段的附加價值
- 影響價值鏈的因素
- 中斷
- 生態系分析
- 產業影響因素
- 促進要素
- 電影製作公司對視覺特效(VFX)的需求不斷成長
- 拓展虛擬製作在商業廣告中的應用
- LED幕牆技術的應用日益普及
- 人工智慧在虛擬生產的應用日益廣泛
- 遊戲產業對虛擬製作的需求日益成長
- 挑戰與困難
- 熟練專業人員短缺
- 高資本支出和初始設定成本
- 市場機遇
- 即時渲染技術的進步
- 電視和串流媒體領域虛擬製作的興起
- 促進要素
- 成長潛力分析
- 監管環境
- 北美洲
- 歐洲
- 亞太地區
- 拉丁美洲
- 中東和非洲
- 波特五力分析
- PESTEL 分析
- 科技與創新趨勢
- 當前技術趨勢
- 新興技術
- 新興經營模式
- 合規要求
- 永續性措施
- 消費者心理分析
- 專利和智慧財產權分析
- 地緣政治和貿易趨勢
第4章 競爭情勢
- 介紹
- 公司市佔率分析
- 按地區
- 北美洲
- 歐洲
- 亞太地區
- 拉丁美洲
- 中東和非洲
- 市場集中度分析
- 按地區
- 主要企業的競爭標竿分析
- 財務績效比較
- 收入
- 利潤率
- 研究與開發
- 產品系列比較
- 產品線的廣度
- 科技
- 創新
- 地理分佈比較
- 全球擴張分析
- 服務網路覆蓋
- 按地區分類的市場滲透率
- 競爭定位矩陣
- 領導企業
- 受讓人
- 追蹤者
- 小眾玩家
- 戰略展望矩陣
- 財務績效比較
- 2021-2024 年主要發展動態
- 併購
- 夥伴關係與合作
- 技術進步
- 擴張與投資策略
- 永續發展計劃
- 數位轉型計劃
- 新興/Start-Ups競賽的趨勢
第5章 按組件分類的市場估算與預測,2022-2035年
- 硬體
- 軟體
- 服務
第6章 按類型分類的市場估算與預測,2022-2035年
- 視覺化
- Pitchvis
- 普雷維斯
- 虛擬球探
- 技術視覺化
- 特技演員
- Postvis
- 績效捕捉
- 混合綠幕直播
- 全LED幕牆
7. 依最終用途分類的市場估計與預測,2022-2035 年
- 電影
- 電視劇
- 商業廣告
- 線上影片
- podcast室
- 新聞廣播
- 體育和娛樂節目
- 娛樂節目
- 天氣及交通工作室
- 政治和金融說明
- 實況活動直播
- 教育及公共服務頻道
- 其他
第8章 2022-2035年各地區市場估算與預測
- 北美洲
- 美國
- 加拿大
- 歐洲
- 德國
- 英國
- 法國
- 西班牙
- 義大利
- 荷蘭
- 亞太地區
- 中國
- 印度
- 日本
- 澳洲
- 韓國
- 拉丁美洲
- 巴西
- 墨西哥
- 阿根廷
- 中東和非洲
- 沙烏地阿拉伯
- 南非
- 阿拉伯聯合大公國
第9章:公司簡介
- 主要企業
- Adobe Inc.
- Sony Corporation
- NVIDIA Corporation
- Epic Games Inc.
- 按地區分類的主要企業
- 北美洲
- Autodesk Inc.
- FuseFX
- Mo-Sys Engineering Ltd.
- 歐洲
- ARRI AG
- BORIS FX, INC
- Asia-Pacific
- HTC Corporation
- Insta360
- 北美洲
- 顛覆者/小眾玩家
- Pixotope
The Global Virtual Production Market was valued at USD 2.9 billion in 2025 and is estimated to grow at a CAGR of 21.1% to reach USD 18.5 billion by 2035.
The market is being propelled by the rising adoption of VFX in film production, increased use of virtual technologies in commercials, and the growing integration of LED wall technology in virtual production studios. AI-driven content creation within virtual environments and the demand for gaming content are further accelerating growth. The industry is being reshaped by LED wall technology, allowing studios to create photorealistic digital environments that can be dynamically adjusted in real time, eliminating the need for extensive physical sets or multiple shooting locations. This innovation enhances creative flexibility, dramatically reduces production time and costs, and allows filmmakers to produce vast, immersive worlds with greater efficiency, fundamentally transforming the speed and scalability of content creation.
| Market Scope | |
|---|---|
| Start Year | 2025 |
| Forecast Year | 2026-2035 |
| Start Value | $2.9 Billion |
| Forecast Value | $18.5 Billion |
| CAGR | 21.1% |
The software segment generated USD 1.3 billion in 2025. Growth is fueled by the rising demand for advanced VFX tools, real-time rendering solutions, and AI-enabled software applications. Firms are focusing on delivering improved real-time rendering, enhancing automation with AI, and developing scalable software solutions for the entertainment, gaming, and advertising sectors to meet growing demand.
The full live LED wall segment is expected to grow at a CAGR of 25.3% during 2026-2035. The rising need for immersive, changeable backgrounds in virtual productions is driving this growth, as full live LED walls eliminate the costs and time associated with physical sets while providing realistic, adaptable environments.
U.S. Virtual Production Market reached USD 991.4 million in 2025, driven by the country's thriving entertainment industry, technology adoption, and demand for innovative solutions in film, gaming, and advertising. Companies are concentrating on advancing virtual production technologies, enhancing VFX capabilities, and tailoring offerings to meet specific needs within the U.S. market.
Key players in the Global Virtual Production Market include Adobe Inc., Sony Corporation, NVIDIA Corporation, Autodesk Inc., ARRI AG, Epic Games Inc., FuseFX, HTC Corporation, Insta360, Pixotope, BORIS FX, Inc., and Mo-Sys Engineering Ltd. To strengthen their market position, companies in the Global Virtual Production Market focus on continuous innovation in AI-enhanced VFX, real-time rendering, and LED wall technologies. They invest in R&D to create scalable, efficient solutions that reduce production time and costs while enhancing creative flexibility. Strategic collaborations with studios, gaming companies, and advertising agencies expand their client base, while acquisitions of niche technology providers enable access to complementary expertise. Firms also prioritize expanding regional presence, offering tailored solutions, and providing robust customer support to build long-term partnerships and solidify their competitive edge in an evolving global market.
Table of Contents
Chapter 1 Methodology and scope
- 1.1 Market scope and definition
- 1.2 Research design
- 1.2.1 Research approach
- 1.2.2 Data collection methods
- 1.3 Data mining sources
- 1.3.1 Global
- 1.3.2 Regional/Country
- 1.4 Base estimates and calculations
- 1.4.1 Base year calculation
- 1.4.2 Key trends for market estimation
- 1.5 Primary research and validation
- 1.5.1 Primary sources
- 1.6 Forecast model
- 1.7 Research assumptions and limitations
Chapter 2 Executive summary
- 2.1 Industry 3600 synopsis
- 2.2 Key market trends
- 2.2.1 Component trend
- 2.2.2 Type trends
- 2.2.3 End use trends
- 2.2.4 Regional trends
- 2.3 TAM Analysis, 2026-2035 (USD Million)
- 2.4 CXO perspectives: Strategic imperatives
- 2.4.1 Executive decision points
- 2.4.2 critical success factors
- 2.5 Future outlook and strategic recommendations
Chapter 3 Industry insights
- 3.1 Industry ecosystem analysis
- 3.1.1 Supplier landscape
- 3.1.2 Profit margin
- 3.1.3 Cost structure
- 3.1.4 Value addition at each stage
- 3.1.5 Factor affecting the value chain
- 3.1.6 Disruptions
- 3.2 Industry ecosystem analysis
- 3.3 Industry impact forces
- 3.3.1 Growth drivers
- 3.3.1.1 Increasing demand for visual effects (VFX) in movie production studios
- 3.3.1.2 Rising applications of virtual production in commercial ads
- 3.3.1.3 Growing Implementation of LED wall technology
- 3.3.1.4 Growing implementation of AI in virtual production
- 3.3.1.5 Growing demand for virtual production in gaming
- 3.3.2 Pitfalls and challenges
- 3.3.2.1 Lack of skilled professionals
- 3.3.2.2 High capital expenditure and initial setup
- 3.3.3 Market opportunities
- 3.3.3.1 Advancements in real-time rendering technology
- 3.3.3.2 Expansion of virtual production in TV and streaming
- 3.3.1 Growth drivers
- 3.4 Growth potential analysis
- 3.5 Regulatory landscape
- 3.5.1 North America
- 3.5.2 Europe
- 3.5.3 Asia Pacific
- 3.5.4 Latin America
- 3.5.5 Middle East & Africa
- 3.6 Porter's analysis
- 3.7 PESTEL analysis
- 3.8 Technology and Innovation landscape
- 3.8.1 Current technological trends
- 3.8.2 Emerging technologies
- 3.9 Emerging Business Models
- 3.10 Compliance Requirements
- 3.11 Sustainability Measures
- 3.12 Consumer Sentiment Analysis
- 3.13 Patent and IP analysis
- 3.14 Geopolitical and trade dynamics
Chapter 4 Competitive landscape, 2025
- 4.1 Introduction
- 4.2 Company market share analysis
- 4.2.1 By region
- 4.2.1.1 North America
- 4.2.1.2 Europe
- 4.2.1.3 Asia Pacific
- 4.2.1.4 Latin America
- 4.2.1.5 Middle East & Africa
- 4.2.2 Market concentration analysis
- 4.2.1 By region
- 4.3 Competitive benchmarking of key players
- 4.3.1 Financial performance comparison
- 4.3.1.1 Revenue
- 4.3.1.2 Profit margin
- 4.3.1.3 R&D
- 4.3.2 Product portfolio comparison
- 4.3.2.1 Product range breadth
- 4.3.2.2 Technology
- 4.3.2.3 Innovation
- 4.3.3 Geographic presence comparison
- 4.3.3.1 Global footprint analysis
- 4.3.3.2 Service network coverage
- 4.3.3.3 Market penetration by region
- 4.3.4 Competitive positioning matrix
- 4.3.4.1 Leaders
- 4.3.4.2 Challengers
- 4.3.4.3 Followers
- 4.3.4.4 Niche players
- 4.3.5 Strategic outlook matrix
- 4.3.1 Financial performance comparison
- 4.4 Key developments, 2021-2024
- 4.4.1 Mergers and acquisitions
- 4.4.2 Partnerships and collaborations
- 4.4.3 Technological advancements
- 4.4.4 Expansion and investment strategies
- 4.4.5 Sustainability initiatives
- 4.4.6 Digital transformation initiatives
- 4.5 Emerging/ startup competitors landscape
Chapter 5 Market estimates and forecast, by Component, 2022 - 2035 (USD Billion)
- 5.1 Key trends
- 5.2 Hardware
- 5.3 Software
- 5.4 Services
Chapter 6 Market estimates and forecast, by Type, 2022 - 2035 (USD Million)
- 6.1 Key trends
- 6.2 Visualization
- 6.2.1 Pitchvis
- 6.2.2 Previs
- 6.2.3 Virtual scouting
- 6.2.4 Techvis
- 6.2.5 Stuntvis
- 6.2.6 Postvis
- 6.3 Performance capture
- 6.4 Hybrid Green Screen Live
- 6.5 Full Live LED Wall
Chapter 7 Market estimates and forecast, by End Use, 2022 - 2035 (USD Million)
- 7.1 Key trends
- 7.2 Movies
- 7.3 TV series
- 7.4 Commercial ads
- 7.5 Online videos
- 7.6 Broadcasting studios
- 7.6.1 News broadcasting
- 7.6.2 Sports broadcasting entertainment shows
- 7.6.3 Entertainment shows
- 7.6.4 Weather & traffic studios
- 7.6.5 Political & financial commentary
- 7.6.6 Live event broadcasting
- 7.6.7 Education & public service channels
- 7.7 Others
Chapter 8 Market estimates and forecast, by Region, 2022 - 2035 (USD Million)
- 8.1 Key trends
- 8.2 North America
- 8.2.1 U.S.
- 8.2.2 Canada
- 8.3 Europe
- 8.3.1 Germany
- 8.3.2 UK
- 8.3.3 France
- 8.3.4 Spain
- 8.3.5 Italy
- 8.3.6 Netherlands
- 8.4 Asia Pacific
- 8.4.1 China
- 8.4.2 India
- 8.4.3 Japan
- 8.4.4 Australia
- 8.4.5 South Korea
- 8.5 Latin America
- 8.5.1 Brazil
- 8.5.2 Mexico
- 8.5.3 Argentina
- 8.6 Middle East and Africa
- 8.6.1 Saudi Arabia
- 8.6.2 South Africa
- 8.6.3 UAE
Chapter 9 Company profiles
- 9.1 Global Key Players
- 9.1.1 Adobe Inc.
- 9.1.2 Sony Corporation
- 9.1.3 NVIDIA Corporation
- 9.1.4 Epic Games Inc.
- 9.2 Regional Key Players
- 9.2.1 North America
- 9.2.1.1 Autodesk Inc.
- 9.2.1.2 FuseFX
- 9.2.1.3 Mo-Sys Engineering Ltd.
- 9.2.2 Europe
- 9.2.2.1 ARRI AG
- 9.2.2.2 BORIS FX, INC
- 9.2.3 Asia-Pacific
- 9.2.3.1 HTC Corporation
- 9.2.3.2 Insta360
- 9.2.1 North America
- 9.3 Disruptors / Niche Players
- 9.3.1 Pixotope
 虛擬製作市場:按組件、內容時長、類型、攝影棚螢幕尺寸、部署方式和最終用戶分類-2026-2032年全球市場預測
 2026年全球生成式人工智慧(AI)影片製作市場報告2026年全球影像製作服務市場報告2026年全球虛擬製作市場報告
 虛擬製作市場分析及預測(至2035年):依類型、產品類型、服務、技術、組件、應用、流程、最終用戶、解決方案、階段分類
 全球虛擬製作市場規模、佔有率、趨勢和成長分析報告(2026-2034)虛擬製作市場規模、佔有率、成長及全球產業分析:依類型、應用和地區劃分的洞察與預測(2026-2034年)
 虛擬製作市場-全球產業規模、佔有率、趨勢、機會及預測(依技術、組件、最終用戶產業、地區及競爭格局分類,2021-2031年)全端視覺化服務市場:2026-2032年全球預測(按服務類型、應用程式、部署類型、最終用戶和垂直產業分類)
 虛擬製作市場規模、佔有率和成長分析(按產品、類型、最終用戶和地區分類)-2026-2033年產業預測