


 |
市場調查報告書
商品編碼
1913345
乳蛋白質市場機會、成長要素、產業趨勢分析及預測(2026年至2035年)Milk Protein Market Opportunity, Growth Drivers, Industry Trend Analysis, and Forecast 2026 - 2035 |
||||||
全球乳蛋白質市場預計到 2025 年將達到 239 億美元,到 2035 年將達到 421 億美元,年複合成長率為 5.6%。
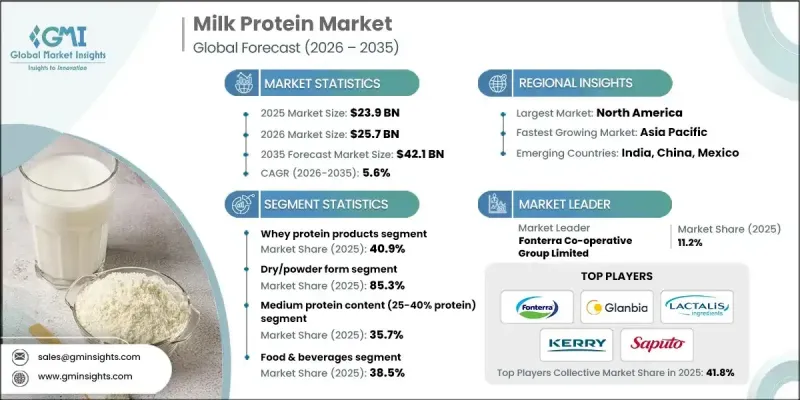
乳蛋白質憑藉其卓越的營養價值和功能性,穩居基礎原料地位,並在眾多營養產品類型中廣受認可。消費者日益關注均衡飲食、積極生活方式和整體健康,顯著提升了對強化蛋白質食品和飲料的需求。這一轉變使乳蛋白質成為兼顧營養價值和功能性的生產商的首選原料。除了營養益處外,乳蛋白質還能改善質地、濃稠度和產品穩定性,進而提高配方效率。消費者對潔淨標示和天然成分的偏好不斷成長,進一步鞏固了他們對乳蛋白的信任。同時,加工技術的不斷進步改進了過濾和分離方法,從而生產出吸收率和利用率更高的優質產品。這些改進使生產商能夠提供量身定做的乳蛋白質解決方案,以滿足不斷變化的營養需求和特定的健康消費模式。
| 市場覆蓋範圍 | |
|---|---|
| 開始年份 | 2025 |
| 預測年份 | 2026-2035 |
| 起始值 | 239億美元 |
| 預測金額 | 421億美元 |
| 複合年成長率 | 5.6% |
2025年,乾粉狀產品市佔率佔比達85.3%,預計2026年至2035年將以6.3%的複合年成長率成長。此形態因其保存期限長、易於運輸以及適用於多種食品和營養應用而被廣泛採用。其穩定性好、配方柔軟性,使其成為大規模生產的首選。
液態和濃縮乳蛋白的需求正在穩定成長,尤其是在那些對質地順滑和快速溶解性要求較高的領域。隨著消費者對便利營養的需求日益成長,這些形式的乳蛋白在飲料和乳製品配方中越來越受歡迎。
預計到 2025 年,中等濃度(40%-70%)乳蛋白質將佔市場佔有率的 35.7%,到 2035 年將以 5.4% 的複合年成長率成長。此類別產品兼具成本效益和功能性,因此在以營養為重點的產品線中廣泛應用,並且仍然是一個有吸引力的選擇。
預計到2025年,北美乳蛋白質市佔率將達到32%。該地區受益於消費者對富含蛋白質、加工最少的產品的強勁需求以及完善的生產基礎設施。根深蒂固的健康意識文化持續推動營養食品和飲料領域的創新。
目錄
第1章調查方法和範圍
第2章執行摘要
第3章業界考察
- 生態系分析
- 供應商情況
- 利潤率
- 每個階段的附加價值
- 影響價值鏈的因素
- 中斷
- 產業影響因素
- 促進要素
- 人們越來越關注健康和保健
- 運動和營養品市場日益成長
- 增加食品中的蛋白質強化程度
- 產業潛在風險與挑戰
- 原奶價格波動
- 乳糖不耐症和乳製品過敏
- 市場機遇
- 拓展生物活性蛋白的應用
- 個性化營養產品開發
- 促進要素
- 成長潛力分析
- 監管環境
- 北美洲
- 歐洲
- 亞太地區
- 拉丁美洲
- 中東和非洲
- 波特五力分析
- PESTEL 分析
- 價格趨勢
- 按地區
- 依產品類型
- 未來市場趨勢
- 科技與創新趨勢
- 當前技術趨勢
- 新興技術
- 專利狀態
- 貿易統計(HS編碼)
(註:貿易統計數據僅涵蓋主要國家。)
- 主要進口國
- 主要出口國
- 永續性和環境方面
- 永續努力
- 減少廢棄物策略
- 生產中的能源效率
- 環保舉措
- 考慮到碳足跡
第4章 競爭情勢
- 介紹
- 公司市佔率分析
- 按地區
- 北美洲
- 歐洲
- 亞太地區
- 拉丁美洲
- 中東和非洲
- 按地區
- 企業矩陣分析
- 主要市場公司的競爭分析
- 競爭定位矩陣
- 重大進展
- 併購
- 夥伴關係與合作
- 新產品發布
- 業務拓展計劃
第5章 依產品類型分類的市場估算與預測,2022-2035年
- 酪蛋白產品
- 酸性酪蛋白
- 凝乳酶酪蛋白
- 酪蛋白酸鈉
- 酪蛋白酸鈣
- 膠束酪蛋白
- 乳清蛋白產品
- 乳清蛋白濃縮物(WPC)
- 乳清蛋白隔離群(WPI) - 蛋白質含量 90% 以上
- 乳清蛋白水解物(WPH)
- 天然乳清蛋白
- 乳蛋白質濃縮物和分離物
- 乳蛋白質濃縮物(MPC 40-85%)
- 乳蛋白質分離物(MPI 85-90%)
- 全脂乳蛋白質
- 特殊蛋白質產品
- 生物活性蛋白(乳鐵蛋白、免疫球蛋白)
- 水解乳蛋白質
- 有機乳蛋白質
第6章 按類型分類的市場估算與預測,2022-2035年
- 乾粉狀
- 液態/濃縮態
- 特殊形式
- 蛋白質脆片和擠壓製品
- 微囊化蛋白質
- 即食混合料
7. 按蛋白質含量等級分類的市場估算與預測,2022-2035 年
- 低蛋白含量(25-40%蛋白質)
- 中等蛋白質含量(40-70%)
- 高蛋白(70-85%)
- 蛋白質含量極高(超過 85%)
第8章 按應用領域分類的市場估算與預測,2022-2035年
- 飲食
- 營養補充品
- 運動營養
- 嬰兒奶粉
- 臨床營養
- 化妝品和個人護理
- 動物營養
9. 2022-2035年按分銷管道分類的市場估算與預測
- B2B 直銷(原料供應)
- B2C零售通路
- 專賣店和健康食品零售商
- 超級市場和大賣場
- 便利商店
- 線上/電子商務管道
- 品牌官方網站
- 線上市場(亞馬遜、阿里巴巴)
- 訂閱模式
- 餐飲業通路
- 餐廳和快餐店
- 咖啡館/果汁吧
- 機構餐飲服務
- 藥局和醫療機構的管道
- 醫院藥房
- 零售藥房
- 醫用營養食品批發商
第10章 2022-2035年各地區市場估計與預測
- 北美洲
- 美國
- 加拿大
- 歐洲
- 德國
- 英國
- 法國
- 西班牙
- 義大利
- 其他歐洲地區
- 亞太地區
- 中國
- 印度
- 日本
- 澳洲
- 韓國
- 亞太其他地區
- 拉丁美洲
- 巴西
- 墨西哥
- 阿根廷
- 其他拉丁美洲地區
- 中東和非洲
- 沙烏地阿拉伯
- 南非
- 阿拉伯聯合大公國
- 其他中東和非洲地區
第11章:公司簡介
- Fonterra Co-operative Group Limited
- Glanbia plc
- Lactalis Ingredients
- Kerry Group plc
- Saputo Inc.
- Arla Foods amba
- Royal FrieslandCampina NV
- Nestle SA(Nutrition &Health Science)
- Hilmar Ingredients
- Milk Specialties Global
- Agropur Cooperative
- Carbery Group
- Glanbia Performance Nutrition(Optimum Nutrition Brand)
- Idaho Milk Products
- Arla Foods Ingredients Group P/S
The Global Milk Protein Market was valued at USD 23.9 billion in 2025 and is estimated to grow at a CAGR of 5.6% to reach USD 42.1 billion by 2035.
Milk protein remains a foundational ingredient due to its strong nutritional profile and functional performance, making it widely valued across nutrition-driven product categories. Rising consumer focus on balanced diets, active lifestyles, and overall wellness has significantly increased interest in protein-enriched foods and beverages. This shift has positioned milk protein as a preferred ingredient for manufacturers seeking both nutritional value and functional performance. Beyond its dietary benefits, milk protein supports formulation efficiency by enhancing texture, consistency, and product stability. Growing preference for clean-label and naturally sourced ingredients has further strengthened consumer trust in milk-derived proteins. At the same time, ongoing advancements in processing technologies have enabled improved filtration and separation methods, resulting in higher-quality products with better absorption and usability. These improvements allow producers to tailor milk protein solutions to meet evolving nutritional expectations and specific health-focused consumption patterns.
| Market Scope | |
|---|---|
| Start Year | 2025 |
| Forecast Year | 2026-2035 |
| Start Value | $23.9 Billion |
| Forecast Value | $42.1 Billion |
| CAGR | 5.6% |
The dry or powder form segment accounted for 85.3% share in 2025 and is projected to grow at a CAGR of 6.3% from 2026 to 2035. This format is widely adopted due to its long shelf life, ease of transportation, and adaptability across a broad range of food and nutrition applications. Its stability and formulation flexibility continue to make it a preferred option for large-scale manufacturing.
Demand for liquid and concentrated milk protein formats is steadily increasing, particularly where smooth texture and rapid solubility are prioritized. These formats are gaining stronger acceptance across beverage and dairy-based formulations as consumer demand for convenience-driven nutrition rises.
Milk proteins with medium concentration levels ranging from 40% to 70% captured 35.7% share in 2025 and is anticipated to grow at a CAGR of 5.4% through 2035. This category remains attractive due to its balance between cost efficiency and functional performance, supporting widespread adoption across nutrition-focused product lines.
North America Milk Protein Market held a 32% share in 2025. The region benefits from strong consumer interest in protein-rich, minimally processed products and from well-established manufacturing infrastructure. A deeply rooted wellness culture continues to drive innovation across nutrition-oriented food and beverage segments.
Key companies operating in the Milk Protein Market include Kerry Group plc, Arla Foods Ingredients Group P/S, Royal FrieslandCampina N.V., Glanbia plc, Hilmar Ingredients, Nestle S.A. (Nutrition & Health Science), Agropur Cooperative, Lactalis Ingredients, Idaho Milk Products, Saputo Inc., Milk Specialties Global, Fonterra Co-operative Group Limited, Carbery Group, Arla Foods amba, and Glanbia Performance Nutrition under the Optimum Nutrition brand. Companies in the Milk Protein Market are reinforcing their market position through innovation, capacity expansion, and portfolio diversification. Many players are investing in advanced processing technologies to enhance product purity, consistency, and functional performance. Strategic partnerships with food and beverage manufacturers are being used to expand application reach and accelerate product adoption.
Table of Contents
Chapter 1 Methodology & Scope
- 1.1 Market scope and definition
- 1.2 Research design
- 1.2.1 Research approach
- 1.2.2 Data collection methods
- 1.3 Data mining sources
- 1.3.1 Global
- 1.3.2 Regional/Country
- 1.4 Base estimates and calculations
- 1.4.1 Base year calculation
- 1.4.2 Key trends for market estimation
- 1.5 Primary research and validation
- 1.5.1 Primary sources
- 1.6 Forecast model
- 1.7 Research assumptions and limitations
Chapter 2 Executive Summary
- 2.1 Industry 360° synopsis
- 2.2 Key market trends
- 2.2.1 Regional
- 2.2.2 Product Type
- 2.2.3 Form
- 2.2.4 Protein Content Level
- 2.2.5 Application
- 2.2.6 Distribution Channel
- 2.3 TAM Analysis, 2025-2035
- 2.4 CXO perspectives: Strategic imperatives
- 2.4.1 Executive decision points
- 2.4.2 Critical success factors
- 2.5 Future Outlook and Strategic Recommendations
Chapter 3 Industry Insights
- 3.1 Industry ecosystem analysis
- 3.1.1 Supplier landscape
- 3.1.2 Profit margin
- 3.1.3 Value addition at each stage
- 3.1.4 Factor affecting the value chain
- 3.1.5 Disruptions
- 3.2 Industry impact forces
- 3.2.1 Growth drivers
- 3.2.1.1 Rising health & wellness consciousness
- 3.2.1.2 Growing sports & active nutrition market
- 3.2.1.3 Increasing protein fortification in foods
- 3.2.2 Industry pitfalls and challenges
- 3.2.2.1 Raw milk price volatility
- 3.2.2.2 Lactose intolerance & dairy allergies
- 3.2.3 Market opportunities
- 3.2.3.1 Bioactive protein applications expansion
- 3.2.3.2 Personalized nutrition product development
- 3.2.1 Growth drivers
- 3.3 Growth potential analysis
- 3.4 Regulatory landscape
- 3.4.1 North America
- 3.4.2 Europe
- 3.4.3 Asia Pacific
- 3.4.4 Latin America
- 3.4.5 Middle East & Africa
- 3.5 Porter's analysis
- 3.6 PESTEL analysis
- 3.7 Price trends
- 3.7.1 By region
- 3.7.2 By product type
- 3.8 Future market trends
- 3.9 Technology and Innovation landscape
- 3.9.1 Current technological trends
- 3.9.2 Emerging technologies
- 3.10 Patent Landscape
- 3.11 Trade statistics (HS code)
( Note: The trade statistics will be provided for key countries only)
- 3.11.1 Major importing countries
- 3.11.2 Major exporting countries
- 3.12 Sustainability and environmental aspects
- 3.12.1 Sustainable practices
- 3.12.2 Waste reduction strategies
- 3.12.3 Energy efficiency in production
- 3.12.4 Eco-friendly initiatives
- 3.13 Carbon footprint consideration
Chapter 4 Competitive Landscape, 2025
- 4.1 Introduction
- 4.2 Company market share analysis
- 4.2.1 By region
- 4.2.1.1 North America
- 4.2.1.2 Europe
- 4.2.1.3 Asia Pacific
- 4.2.1.4 LATAM
- 4.2.1.5 MEA
- 4.2.1 By region
- 4.3 Company matrix analysis
- 4.4 Competitive analysis of major market players
- 4.5 Competitive positioning matrix
- 4.6 Key developments
- 4.6.1 Mergers & acquisitions
- 4.6.2 Partnerships & collaborations
- 4.6.3 New Product Launches
- 4.6.4 Expansion Plans
Chapter 5 Market Estimates and Forecast, By Product Type, 2022-2035 (USD Billion) (Kilo Tons)
- 5.1 Key trends
- 5.2 Casein products
- 5.2.1 Acid casein
- 5.2.2 Rennet casein
- 5.2.3 Sodium caseinate
- 5.2.4 Calcium caseinate
- 5.2.5 Micellar casein
- 5.3 Whey protein products
- 5.3.1 Whey protein concentrate (WPC)
- 5.3.2 Whey protein isolate (WPI) - >90% protein
- 5.3.3 Whey protein hydrolysate (WPH)
- 5.3.4 Native whey protein
- 5.4 Milk protein concentrates & isolates
- 5.4.1 Milk protein concentrate (MPC 40-85%)
- 5.4.2 Milk protein isolate (MPI 85-90%)
- 5.4.3 Total milk protein
- 5.5 Specialty protein products
- 5.5.1 Bioactive proteins (lactoferrin, immunoglobulins)
- 5.5.2 Hydrolyzed milk proteins
- 5.5.3 Organic milk proteins
Chapter 6 Market Estimates and Forecast, By Form, 2022-2035 (USD Billion) (Kilo Tons)
- 6.1 Key trends
- 6.2 Dry/powder form
- 6.3 Liquid/concentrated form
- 6.4 Specialty forms
- 6.4.1 Protein crisps & extrudates
- 6.4.2 Micro-encapsulated proteins
- 6.4.3 Ready-to-mix blends
Chapter 7 Market Estimates and Forecast, By Protein Content Level, 2022-2035 (USD Billion) (Kilo Tons)
- 7.1 Key trends
- 7.2 Low Protein Content (25-40% Protein)
- 7.3 Medium Protein (40-70%)
- 7.4 High Protein (70-85%)
- 7.5 Ultra-High Protein (>85%)
Chapter 8 Market Estimates and Forecast, By Application, 2022-2035 (USD Billion) (Kilo Tons)
- 8.1 Key trends
- 8.2 Food & Beverages
- 8.3 Dietary Supplements
- 8.4 Sports Nutrition
- 8.5 Infant Formula
- 8.6 Clinical Nutrition
- 8.7 Cosmetics & Personal Care
- 8.8 Animal Nutrition
Chapter 9 Market Estimates and Forecast, By Distribution Channel, 2022-2035 (USD Billion) (Kilo Tons)
- 9.1 Key trends
- 9.2 B2B direct sales (ingredient supply)
- 9.3 B2C retail channels
- 9.3.1 Specialty stores & health food retailers
- 9.3.2 Supermarkets & hypermarkets
- 9.3.3 Convenience stores
- 9.4 Online/e-commerce channels
- 9.4.1 Brand direct websites
- 9.4.2 Online marketplaces (amazon, Alibaba)
- 9.4.3 Subscription models
- 9.5 Food service channels
- 9.5.1 Restaurants & quick service
- 9.5.2 Cafes & juice bars
- 9.5.3 Institutional food service
- 9.6 Pharmacy & medical channels
- 9.6.1 Hospital pharmacies
- 9.6.2 Retail pharmacies
- 9.6.3 Medical nutrition distributors
Chapter 10 Market Estimates and Forecast, By Region, 2022-2035 (USD Billion) (Kilo Tons)
- 10.1 Key trends
- 10.2 North America
- 10.2.1 U.S.
- 10.2.2 Canada
- 10.3 Europe
- 10.3.1 Germany
- 10.3.2 UK
- 10.3.3 France
- 10.3.4 Spain
- 10.3.5 Italy
- 10.3.6 Rest of Europe
- 10.4 Asia Pacific
- 10.4.1 China
- 10.4.2 India
- 10.4.3 Japan
- 10.4.4 Australia
- 10.4.5 South Korea
- 10.4.6 Rest of Asia Pacific
- 10.5 Latin America
- 10.5.1 Brazil
- 10.5.2 Mexico
- 10.5.3 Argentina
- 10.5.4 Rest of Latin America
- 10.6 Middle East and Africa
- 10.6.1 Saudi Arabia
- 10.6.2 South Africa
- 10.6.3 UAE
- 10.6.4 Rest of Middle East and Africa
Chapter 11 Company Profiles
- 11.1 Fonterra Co-operative Group Limited
- 11.2 Glanbia plc
- 11.3 Lactalis Ingredients
- 11.4 Kerry Group plc
- 11.5 Saputo Inc.
- 11.6 Arla Foods amba
- 11.7 Royal FrieslandCampina N.V.
- 11.8 Nestle S.A. (Nutrition & Health Science)
- 11.9 Hilmar Ingredients
- 11.10 Milk Specialties Global
- 11.11 Agropur Cooperative
- 11.12 Carbery Group
- 11.13 Glanbia Performance Nutrition (Optimum Nutrition Brand)
- 11.14 Idaho Milk Products
- 11.15 Arla Foods Ingredients Group P/S
 乳蛋白質市場-全球產業規模、佔有率、趨勢、機會和預測:按類型、畜牧業、形態、用途、功能、加工方法、地區和競爭格局分類,2021-2031年
 全球乳蛋白質市場:預測(2025-2030 年)
 全球乳蛋白質市場