


 |
市場調查報告書
商品編碼
1913336
植物來源棒市場機會、成長要素、產業趨勢分析及2026年至2035年預測Plant-Based Bars Market Opportunity, Growth Drivers, Industry Trend Analysis, and Forecast 2026 - 2035 |
||||||
全球植物來源棒市場預計到 2025 年將達到 10 億美元,到 2035 年將達到 29 億美元,年複合成長率為 10.3%。
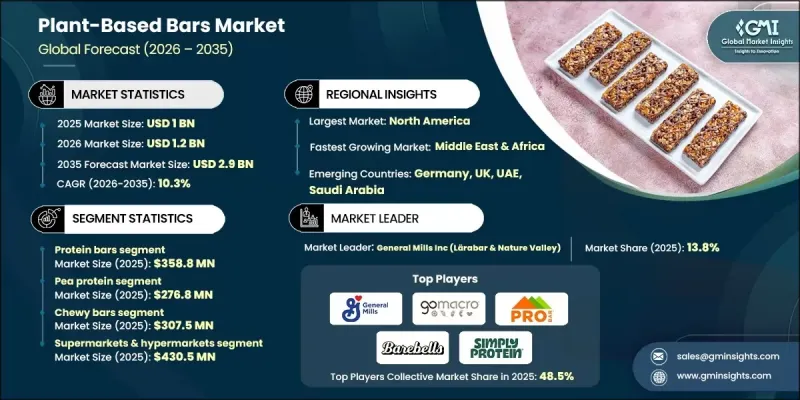
隨著消費者對植物來源營養和彈性素食習慣的日益追求,市場正穩步成長。人們對植物性飲食的健康和永續性益處的認知不斷提高,正逐步減少動物性蛋白質的攝入,從而擴大植物來源棒的消費群。注重健康的消費者和一般消費者都越來越傾向於選擇便攜、無過敏原、潔淨標示且方便的零食,這也支撐了市場需求。人們對個人健康的偏好也影響著購買行為,他們積極尋找能夠促進心血管健康、體重管理和整體平衡的功能性零食。植物來源棒定位為高蛋白、高纖維和天然產品,與以預防保健為中心的生活方式轉變不謀而合。健身習慣的養成和積極參與體育活動的趨勢持續推動市場需求,植物來源棒正成為便捷補充蛋白質、能量和肌肉支持的熱門選擇。為此,製造商正在開發以提升運動表現為核心的功能性營養產品。
| 市場覆蓋範圍 | |
|---|---|
| 開始年份 | 2025 |
| 預測年份 | 2026-2035 |
| 起始值 | 10億美元 |
| 預測金額 | 29億美元 |
| 複合年成長率 | 10.3% |
預計到2025年,蛋白棒市場規模將達到3.588億美元。由於產品類型與消費者對營養豐富、注重生活方式的零食產品的需求高度契合,因此有望引領整個市場。蛋白棒被廣泛認為是兩餐之間、運動後恢復和持久飽腹的理想選擇,因此越來越受到注重健身人士以及尋求非動物蛋白替代品的彈性素食者的青睞。
預計到2025年,豌豆蛋白市場規模將達到2.768億美元。其廣泛應用得益於其優異的營養成分、中性的感官特性以及廣泛的消費者接受度。豌豆蛋白具有高消化率和均衡的氨基酸組成,因此適合食物敏感人群,尤其是那些需要避免常見過敏原的人。其配方的多樣性使生產商能夠實現所需的質地和一致性,同時支持潔淨標示和非基因改造(非GMO)聲明,從而鞏固了其在植物來源強化蛋白零食產品中的地位。
預計到2025年,北美植物性能量棒市場將佔據42%的市場佔有率,其中美國將佔據該地區的大部分美國佔有率。美國市場受益於龐大的健康意識消費群體、成熟的包裝零食生態系統以及強大的線上線下分銷網路。消費者對植物性飲食習慣的高度認知,以及根深蒂固的健身和健康文化,持續推動產品的普及。不斷擴充的產品線、頻繁的新品產品推出以及在網路平台上的強大曝光度,進一步鞏固了植物來源能量棒在美國市場的滲透率,並成為其關鍵的成長引擎。
目錄
第1章調查方法和範圍
第2章執行摘要
第3章業界考察
- 生態系分析
- 供應商情況
- 利潤率
- 每個階段的附加價值
- 影響價值鏈的因素
- 中斷
- 產業影響因素
- 促進要素
- 消費者對植物來源營養和彈性素食的需求日益成長
- 人們越來越關注健康和保健
- 運動營養和積極生活方式市場的擴張
- 產業潛在風險與挑戰
- 潔淨標示配方中的保存期限和穩定性問題
- 特種植物蛋白供應鏈波動性
- 市場機遇
- 拓展機構和餐飲服務業的管道
- 永續包裝創新與高階定位
- 促進要素
- 成長潛力分析
- 監管環境
- 北美洲
- 歐洲
- 亞太地區
- 拉丁美洲
- 中東和非洲
- 波特五力分析
- PESTEL 分析
- 價格趨勢
- 按地區
- 產品類型
- 未來市場趨勢
- 科技與創新趨勢
- 當前技術趨勢
- 新興技術
- 專利狀態
- 貿易統計(HS編碼)(註:僅提供主要國家的貿易統計)
- 主要進口國
- 主要出口國
- 永續性和環境方面
- 永續努力
- 減少廢棄物策略
- 生產中的能源效率
- 環保舉措
- 碳足跡考量
第4章 競爭情勢
- 介紹
- 公司市佔率分析
- 按地區
- 北美洲
- 歐洲
- 亞太地區
- 拉丁美洲
- 中東和非洲
- 按地區
- 企業矩陣分析
- 主要市場公司的競爭分析
- 競爭定位矩陣
- 重大進展
- 併購
- 夥伴關係與合作
- 新產品發布
- 擴張計劃
第5章 依產品類型分類的市場估算與預測,2022-2035年
- 穀物棒和Granola片棒
- 蛋白質棒
- 能量棒
- 代餐棒
- 水果堅果棒
- 其他
6. 2022-2035年按來源分類的市場估計與預測
- 大豆蛋白
- 豌豆蛋白
- 米蛋白質
- 小麥蛋白
- 堅果蛋白
- 杏仁
- 腰果
- 花生
- 其他
7. 按生產方式分類的市場估算與預測,2022-2035 年
- 咀嚼棒
- 脆脆巧克力棒
- 軟烤棒
- 低溫冷壓吧
- 擠壓棒材
- 免裝訂酒吧
第8章 按分銷管道分類的市場估算與預測,2022-2035年
- 超級市場和大賣場
- 便利商店
- 專賣店和健康食品店
- 線上零售與電子商務
- 其他
第9章 2022-2035年各地區市場估算與預測
- 北美洲
- 美國
- 加拿大
- 歐洲
- 德國
- 英國
- 法國
- 西班牙
- 義大利
- 其他歐洲地區
- 亞太地區
- 中國
- 印度
- 日本
- 澳洲
- 韓國
- 亞太其他地區
- 拉丁美洲
- 巴西
- 墨西哥
- 其他拉丁美洲地區
- 中東和非洲
- 沙烏地阿拉伯
- 南非
- 阿拉伯聯合大公國
- 其他中東和非洲地區
第10章:公司簡介
- BHU Foods
- PROBAR, Inc
- Barebells
- General Mills Inc(Larabar &Nature Valley)
- Simply Protein
- NuGo Nutrition
- Rise Bar
- Raw Rev
- GoMacro
- Orgain
- No Cow
- Nutree Life
- Numix
The Global Plant-Based Bars Market was valued at USD 1 billion in 2025 and is estimated to grow at a CAGR of 10.3% to reach USD 2.9 billion by 2035.
The market is gaining steady momentum as consumers increasingly gravitate toward plant-based nutrition and flexitarian eating patterns. Growing understanding of the health and sustainability benefits associated with plant-focused diets is encouraging a gradual reduction in animal protein intake, which is broadening the consumer base for plant-based bars. Demand is further supported by the rising preference for portable, allergen-friendly, clean-label, and easy-to-consume snack options among both health-driven and mainstream buyers. Heightened focus on personal wellness is also shaping purchasing behavior, with consumers actively seeking functional snack options that support cardiovascular health, weight management, and overall physical balance. Plant-based bars positioned as protein-rich, fiber-dense, and naturally sourced products align well with evolving lifestyle priorities centered on preventive health. Increasing participation in fitness-oriented routines and physically active lifestyles continues to stimulate demand, as plant-based bars are widely chosen for convenient protein intake, energy replenishment, and muscle support. Manufacturers are responding by developing formulations centered on performance-focused and functional nutrition benefits.
| Market Scope | |
|---|---|
| Start Year | 2025 |
| Forecast Year | 2026-2035 |
| Start Value | $1 Billion |
| Forecast Value | $2.9 Billion |
| CAGR | 10.3% |
The protein bars segment reached USD 358.8 million in 2025. This product category leads the overall segmentation due to its strong alignment with consumer demand for nutrition-forward and lifestyle-oriented snack products. Protein bars are widely perceived as practical options for consumption between meals, post-activity recovery, and prolonged satiety, which has strengthened their appeal among fitness-focused individuals as well as flexitarian consumers seeking non-animal protein alternatives.
The pea protein segment generated USD 276.8 million in 2025. Its widespread adoption is driven by its favorable nutritional profile, neutral sensory characteristics, and broad consumer acceptance. High digestibility and a well-balanced amino acid composition make pea protein suitable for individuals with dietary sensitivities, particularly those avoiding common allergens. Its formulation versatility allows producers to achieve desirable texture and consistency while supporting clean-label positioning and non-GMO claims, reinforcing its role in plant-based, protein-enriched snack products.
North America Plant-Based Bars Market represented 42% share in 2025, with the United States accounting for the majority share within the region. The U.S. market benefits from a large population of wellness-focused consumers, a mature packaged snack ecosystem, and strong distribution through both physical retail and digital channels. High awareness of plant-based eating patterns, coupled with a deeply ingrained fitness and wellness culture, continues to support product adoption. Expanding product assortments, frequent new launches, and strong visibility across online platforms further strengthen market penetration in the U.S., making it a key growth engine for plant-based bar manufacturers.
Key companies active in the Global Plant-Based Bars Market include PROBAR, Inc, BHU Foods, Barebells, Simply Protein, General Mills Inc., through its Larabar and Nature Valley brands, Rise Bar, NuGo Nutrition, Raw Rev, Orgain, GoMacro, No Cow, Numix, Nutree Life, and others operating across global and regional markets. Companies operating in the Global Plant-Based Bars Market are strengthening their market position by prioritizing product innovation focused on protein quality, functional benefits, and ingredient transparency. Many brands are investing in research to refine formulations that enhance taste, texture, and nutritional density while maintaining clean-label standards. Expansion across U.S. retail formats, including specialty health stores and direct-to-consumer platforms, remains a core strategy. Firms are also leveraging targeted marketing that emphasizes lifestyle alignment, fitness support, and everyday convenience. Strategic pricing, sustainable sourcing narratives, and portfolio diversification aimed at different consumer needs are being used to deepen brand loyalty and expand reach across the U.S. market.
Table of Contents
Chapter 1 Methodology & Scope
- 1.1 Market scope and definition
- 1.2 Research design
- 1.2.1 Research approach
- 1.2.2 Data collection methods
- 1.3 Data mining sources
- 1.3.1 Global
- 1.3.2 Regional/Country
- 1.4 Base estimates and calculations
- 1.4.1 Base year calculation
- 1.4.2 Key trends for market estimation
- 1.5 Primary research and validation
- 1.5.1 Primary sources
- 1.6 Forecast model
- 1.7 Research assumptions and limitations
Chapter 2 Executive Summary
- 2.1 Industry 3600 synopsis
- 2.2 Key market trends
- 2.2.1 Regional
- 2.2.2 Product Type
- 2.2.3 Source
- 2.2.4 Processing Method
- 2.2.5 Distribution Channel
- 2.3 TAM Analysis, 2026-2035
- 2.4 CXO perspectives: Strategic imperatives
- 2.4.1 Executive decision points
- 2.4.2 Critical success factors
- 2.5 Future Outlook and Strategic Recommendations
Chapter 3 Industry Insights
- 3.1 Industry ecosystem analysis
- 3.1.1 Supplier Landscape
- 3.1.2 Profit Margin
- 3.1.3 Value addition at each stage
- 3.1.4 Factor affecting the value chain
- 3.1.5 Disruptions
- 3.2 Industry impact forces
- 3.2.1 Growth drivers
- 3.2.1.1 Rising consumer demand for plant-based nutrition & flexitarian diets
- 3.2.1.2 Growing health & wellness consciousness
- 3.2.1.3 Sports nutrition & active lifestyle market expansion
- 3.2.2 Industry pitfalls and challenges
- 3.2.2.1 Shelf life & stability issues with clean label formulations
- 3.2.2.2 Supply chain volatility for specialty plant proteins
- 3.2.3 Market opportunities
- 3.2.3.1 Institutional & foodservice channel expansion
- 3.2.3.2 Sustainable packaging innovation & premium positioning
- 3.2.1 Growth drivers
- 3.3 Growth potential analysis
- 3.4 Regulatory landscape
- 3.4.1 North America
- 3.4.2 Europe
- 3.4.3 Asia Pacific
- 3.4.4 Latin America
- 3.4.5 Middle East & Africa
- 3.5 Porter's analysis
- 3.6 PESTEL analysis
- 3.7 Price trends
- 3.7.1 By region
- 3.7.2 Product type
- 3.8 Future market trends
- 3.9 Technology and Innovation Landscape
- 3.9.1 Current technological trends
- 3.9.2 Emerging technologies
- 3.10 Patent Landscape
- 3.11 Trade statistics (HS code) (Note: the trade statistics will be provided for key countries only)
- 3.11.1 Major importing countries
- 3.11.2 Major exporting countries
- 3.12 Sustainability and environmental aspects
- 3.12.1 Sustainable practices
- 3.12.2 Waste reduction strategies
- 3.12.3 Energy efficiency in production
- 3.12.4 Eco-friendly initiatives
- 3.13 Carbon footprint considerations
Chapter 4 Competitive Landscape, 2025
- 4.1 Introduction
- 4.2 Company market share analysis
- 4.2.1 By region
- 4.2.1.1 North America
- 4.2.1.2 Europe
- 4.2.1.3 Asia Pacific
- 4.2.1.4 LATAM
- 4.2.1.5 MEA
- 4.2.1 By region
- 4.3 Company matrix analysis
- 4.4 Competitive analysis of major market players
- 4.5 Competitive positioning matrix
- 4.6 Key developments
- 4.6.1 Mergers & acquisitions
- 4.6.2 Partnerships & collaborations
- 4.6.3 New product launches
- 4.6.4 Expansion plans
Chapter 5 Market Estimates and Forecast, By Product Type, 2022 - 2035 (USD Million) (Units)
- 5.1 Key trends
- 5.2 Cereal & granola bars
- 5.3 Protein bars
- 5.4 Energy bars
- 5.5 Meal replacement bars
- 5.6 Fruits & nuts bars
- 5.7 Others
Chapter 6 Market Estimates and Forecast, By Source, 2022 - 2035 (USD Million) (Units)
- 6.1 Key trends
- 6.2 Soy protein
- 6.3 Pea protein
- 6.4 Rice protein
- 6.5 Wheat protein
- 6.6 Nut proteins
- 6.6.1 Almond
- 6.6.2 Cashew
- 6.6.3 Peanut
- 6.7 Others
Chapter 7 Market Estimates and Forecast, By Processing Method, 2022 - 2035 (USD Million) (Units)
- 7.1 Key trends
- 7.2 Chewy bars
- 7.3 Crunchy bars
- 7.4 Soft-baked bars
- 7.5 Raw & cold-pressed bars
- 7.6 Extruded bars
- 7.7 Binder-free bars
Chapter 8 Market Estimates and Forecast, By Distribution Channel, 2022 - 2035 (USD Million) (Units)
- 8.1 Key trends
- 8.2 Supermarkets & hypermarkets
- 8.3 Convenience stores
- 8.4 Specialty & health food stores
- 8.5 Online retail & e-commerce
- 8.6 Others
Chapter 9 Market Estimates and Forecast, By Region, 2022 - 2035 (USD Million) (Units)
- 9.1 Key trends
- 9.2 North America
- 9.2.1 U.S.
- 9.2.2 Canada
- 9.3 Europe
- 9.3.1 Germany
- 9.3.2 UK
- 9.3.3 France
- 9.3.4 Spain
- 9.3.5 Italy
- 9.3.6 Rest of Europe
- 9.4 Asia Pacific
- 9.4.1 China
- 9.4.2 India
- 9.4.3 Japan
- 9.4.4 Australia
- 9.4.5 South Korea
- 9.4.6 Rest of Asia Pacific
- 9.5 Latin America
- 9.5.1 Brazil
- 9.5.2 Mexico
- 9.5.3 Rest of Latin America
- 9.6 Middle East and Africa
- 9.6.1 Saudi Arabia
- 9.6.2 South Africa
- 9.6.3 UAE
- 9.6.4 Rest of Middle East and Africa
Chapter 10 Company Profiles
- 10.1 BHU Foods
- 10.2 PROBAR, Inc
- 10.3 Barebells
- 10.4 General Mills Inc (Larabar & Nature Valley)
- 10.5 Simply Protein
- 10.6 NuGo Nutrition
- 10.7 Rise Bar
- 10.8 Raw Rev
- 10.9 GoMacro
- 10.10 Orgain
- 10.11 No Cow
- 10.12 Nutree Life
- 10.13 Numix


