


 |
市場調查報告書
商品編碼
1913326
食品塗料配料市場機會、成長要素、產業趨勢分析及預測(2026年至2035年)Food Coating Ingredients Market Opportunity, Growth Drivers, Industry Trend Analysis, and Forecast 2026 - 2035 |
||||||
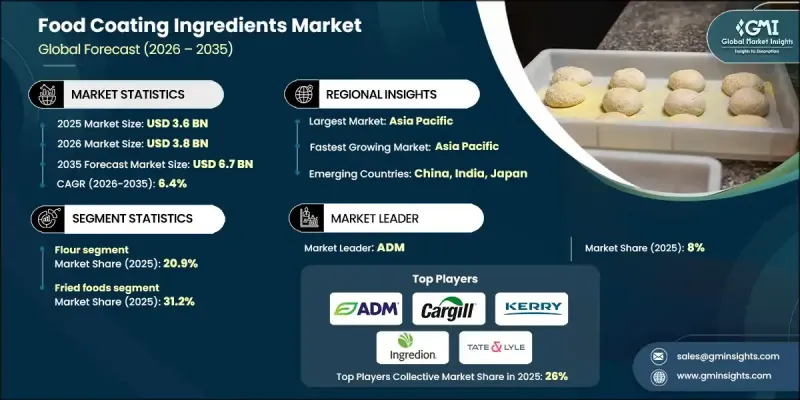
全球食品塗料配料市場預計到 2025 年將達到 36 億美元,到 2035 年將達到 67 億美元,年複合成長率為 6.4%。
食品塗層配料是配製好的混合物,用於改善食品的視覺吸引力、口感、味道一致性和貨架穩定性。這些解決方案包括塗層、麵包屑、麵粉、澱粉、蛋白質、香辛料和調味體系,為各種食品打造功能性外層。其應用範圍涵蓋油炸食品、烘焙食品、零食、糖果甜點和包裝食品,大型生產商和餐飲服務業都在使用。即食食品需求的成長、對植物來源配方的日益偏好以及對成分透明度的意識提升,正在重塑創新重點。潔淨標示的要求對配方決策產生了重大影響,消費者傾向於選擇成分簡單、易於識別且加工過程最少的產品。隨著年輕消費者積極查看標籤和產品成分,供應商正在轉向天然、非基因改造、有機和低致敏性解決方案。配方改良的重點在於替代合成成分、減少添加劑,並透過替代保鮮技術延長保存期限,從而推動產品開發,以滿足不斷成長的消費者信任和監管標準。
| 市場覆蓋範圍 | |
|---|---|
| 開始年份 | 2025 |
| 預測年份 | 2026-2035 |
| 起始值 | 36億美元 |
| 預測金額 | 67億美元 |
| 複合年成長率 | 6.4% |
預計到2025年,麵粉基塗層產品將佔市場佔有率的20.9%。小麥粉因其功能性強、用途廣泛且經濟實惠,仍是油炸食品、烘焙點心和加工食品等類別的核心原料。雖然小麥粉仍然是最常用的麵粉,但由於無麩質產品消費量的成長,米粉、鷹嘴豆粉和特殊穀物粉的需求也在持續成長。
預計到2025年,油炸食品應用領域將佔據31.2%的市場佔有率,這主要得益於快餐店的擴張、冷凍食品消費量的成長以及全球對裹粉和塗層產品的穩定需求。在過去一段時間內,即食食品的消費量增加了約26%,推動了銷量的成長。低脂塗層系統正被擴大採用,以減少油脂吸收,同時保持食品的質地和風味。
預計到2025年,北美食品塗料配料市場佔有率將達到24.1%。該地區受益於強大的餐飲服務業、成熟的冷凍食品行業以及對有機和天然配料的穩定需求。對加工能力和永續生產實踐的持續投資將繼續支撐區域市場的強勁勢頭。
目錄
第1章調查方法和範圍
第2章執行摘要
第3章業界考察
- 生態系分析
- 供應商情況
- 利潤率
- 每個階段的附加價值
- 影響價值鏈的因素
- 中斷
- 產業影響因素
- 促進要素
- 產業潛在風險與挑戰
- 市場機遇
- 成長潛力分析
- 監管環境
- 北美洲
- 歐洲
- 亞太地區
- 拉丁美洲
- 中東和非洲
- 波特五力分析
- PESTEL 分析
- 價格趨勢
- 未來市場趨勢
- 科技與創新趨勢
- 當前技術趨勢
- 新興技術
- 專利狀態
- 貿易統計(HS編碼)
(註:貿易統計數據僅涵蓋主要國家。)
- 主要進口國
- 主要出口國
第4章 競爭情勢
- 介紹
- 公司市佔率分析
- 按地區
- 北美洲
- 歐洲
- 亞太地區
- 拉丁美洲
- 中東和非洲
- 按地區
- 企業矩陣分析
- 主要市場公司的競爭分析
- 競爭定位矩陣
- 重大進展
- 併購
- 夥伴關係與合作
- 新產品發布
- 業務拓展計劃
第5章 按類型分類的市場估算與預測,2022-2035年
- 連擊
- 麵包屑
- 細粒
- 中等顆粒
- 粗粒
- 麵粉
- 小麥
- 米
- 玉米
- 其他
- 澱粉
- 玉米
- 馬鈴薯
- 木薯(木薯粉)
- 小麥
- 米
- 調味料和香辛料
- 草藥
- 香辛料
- 混合
- 鹽的變化
- 蛋白質
- 動物
- 植物
- 其他
第6章 按應用領域分類的市場估算與預測,2022-2035年
- 油炸食品
- 肉類/家禽
- 水產品
- 蔬菜
- 乳酪和乳製品
- 烘焙點心
- 鹹
- 甜味
- 小吃和開胃菜
- 加工食品
- 糖果甜點
- 其他
7. 2022-2035年按分銷管道分類的市場估算與預測
- 超級市場/大賣場
- 零售店
- 線上零售
- 電子商務市場
- 品牌 D2C
- 其他
第8章 2022-2035年各地區市場估算與預測
- 北美洲
- 美國
- 加拿大
- 歐洲
- 德國
- 英國
- 法國
- 西班牙
- 義大利
- 其他歐洲地區
- 亞太地區
- 中國
- 印度
- 日本
- 澳洲
- 韓國
- 亞太其他地區
- 拉丁美洲
- 巴西
- 墨西哥
- 阿根廷
- 其他拉丁美洲地區
- 中東和非洲
- 沙烏地阿拉伯
- 南非
- 阿拉伯聯合大公國
- 其他中東和非洲地區
第9章:公司簡介
- Archer Daniels Midland Company(ADM)
- Cargill Incorporated
- Kerry Group
- Ingredion Incorporated
- Tate &Lyle PLC
- Ashland Global Holdings Inc
- PGP International, Inc(A Bunge Limited Company)
- Dohler Group
- Bowman Ingredients
- SensoryEffects(A division of Balchem Corporation)
- Bunge Limited
- Continental Mills, Inc
- Givaudan SA
- Kerry Taste &Nutrition
The Global Food Coating Ingredients Market was valued at USD 3.6 billion in 2025 and is estimated to grow at a CAGR of 6.4% to reach USD 6.7 billion by 2035.
Food coating ingredients are formulated blends applied to food products to improve visual appeal, mouthfeel, taste consistency, and storage stability. These solutions include batters, crumbs, flours, starches, proteins, spices, and seasoning systems that form functional outer layers across a wide range of foods. Applications span fried items, bakery products, snacks, confectionery, and processed foods, serving large-scale manufacturers as well as foodservice operators. Rising demand for convenience foods, increasing preference for plant-based formulations, and heightened awareness around ingredient transparency are reshaping innovation priorities. Clean-label expectations now influence formulation decisions on a scale, with buyers favoring simple, recognizable ingredients and minimal processing. Younger consumers actively review labels and product composition, prompting suppliers to shift toward natural, non-GMO, organic, and allergen-conscious solutions. Reformulation efforts focus on replacing synthetic components, reducing additives, and extending shelf life through alternative preservation techniques that align with evolving consumer trust and regulatory standards.
| Market Scope | |
|---|---|
| Start Year | 2025 |
| Forecast Year | 2026-2035 |
| Start Value | $3.6 Billion |
| Forecast Value | $6.7 Billion |
| CAGR | 6.4% |
The flour-based coatings segment accounted for 20.9% share in 2025. Flour remains a core input across fried foods, baked goods, and processed categories due to its functional adaptability and cost efficiency. Wheat flour leads usage volumes, while rice, chickpea, and specialty grain flours continue gaining traction as gluten-free consumption rises.
The fried food applications segment held 31.2% share in 2025, supported by the expansion of quick-service dining, frozen meal consumption, and steady global demand for breaded and battered products. Consumption of ready-to-eat foods increased by about 26% over a defined historical period, reinforcing volume growth. Reduced-fat coating systems are increasingly adopted to lower oil absorption while preserving texture and flavor.
North America Food Coating Ingredients Market held 24.1% share in 2025. The region benefits from a strong foodservice presence, a well-established frozen foods sector, and consistent demand for organic and naturally positioned ingredients. Ongoing investments in processing capacity and sustainable manufacturing practices continue to support regional market strength.
Key companies active in the Global Food Coating Ingredients Market include Kerry Taste & Nutrition, Cargill Incorporated, Ingredion Incorporated, Archer Daniels Midland Company, Tate & Lyle PLC, Givaudan SA, Bunge Limited, Dohler Group, Ashland Global Holdings Inc, SensoryEffects, Continental Mills, Inc, Bowman Ingredients, and PGP International. Companies operating in the Global Food Coating Ingredients Market strengthen their competitive position through product innovation, portfolio diversification, and strategic customer alignment. Leading players invest in clean-label research, plant-based formulations, and functional performance improvements to meet evolving consumer and regulatory expectations. Capacity expansion and regional production optimization improve supply reliability and cost efficiency. Firms also emphasize customized solutions for industrial clients, supported by application testing and technical services.
Table of Contents
Chapter 1 Methodology & Scope
- 1.1 Market scope and definition
- 1.2 Research design
- 1.2.1 Research approach
- 1.2.2 Data collection methods
- 1.3 Data mining sources
- 1.3.1 Global
- 1.3.2 Regional/Country
- 1.4 Base estimates and calculations
- 1.4.1 Base year calculation
- 1.4.2 Key trends for market estimation
- 1.5 Primary research and validation
- 1.5.1 Primary sources
- 1.6 Forecast model
- 1.7 Research assumptions and limitations
Chapter 2 Executive Summary
- 2.1 Industry 360° synopsis
- 2.2 Key market trends
- 2.2.1 Regional
- 2.2.2 Type
- 2.2.3 Application
- 2.2.4 Distribution Channel
- 2.3 TAM Analysis, 2025-2034
- 2.4 CXO perspectives: Strategic imperatives
- 2.4.1 Executive decision points
- 2.4.2 Critical success factors
- 2.5 Future Outlook and Strategic Recommendations
Chapter 3 Industry Insights
- 3.1 Industry ecosystem analysis
- 3.1.1 Supplier landscape
- 3.1.2 Profit margin
- 3.1.3 Value addition at each stage
- 3.1.4 Factor affecting the value chain
- 3.1.5 Disruptions
- 3.2 Industry impact forces
- 3.2.1 Growth drivers
- 3.2.2 Industry pitfalls and challenges
- 3.2.3 Market opportunities
- 3.3 Growth potential analysis
- 3.4 Regulatory landscape
- 3.4.1 North America
- 3.4.2 Europe
- 3.4.3 Asia Pacific
- 3.4.4 Latin America
- 3.4.5 Middle East & Africa
- 3.5 Porter's analysis
- 3.6 PESTEL analysis
- 3.7 Price trends
- 3.8 Future market trends
- 3.9 Technology and Innovation landscape
- 3.9.1 Current technological trends
- 3.9.2 Emerging technologies
- 3.10 Patent Landscape
- 3.11 Trade statistics (HS code)
( Note: the trade statistics will be provided for key countries only)
- 3.11.1 Major importing countries
- 3.11.2 Major exporting countries
Chapter 4 Competitive Landscape, 2025
- 4.1 Introduction
- 4.2 Company market share analysis
- 4.2.1 By region
- 4.2.1.1 North America
- 4.2.1.2 Europe
- 4.2.1.3 Asia Pacific
- 4.2.1.4 LATAM
- 4.2.1.5 MEA
- 4.2.1 By region
- 4.3 Company matrix analysis
- 4.4 Competitive analysis of major market players
- 4.5 Competitive positioning matrix
- 4.6 Key developments
- 4.6.1 Mergers & acquisitions
- 4.6.2 Partnerships & collaborations
- 4.6.3 New Product Launches
- 4.6.4 Expansion Plans
Chapter 5 Market Estimates and Forecast, By Type, 2022-2035 (USD Billion & Tons)
- 5.1 Key trends
- 5.2 Batter
- 5.3 Breadcrumb
- 5.3.1 Fine
- 5.3.2 Medium
- 5.3.3 Coarse
- 5.4 Flour
- 5.4.1 Wheat
- 5.4.2 Rice
- 5.4.3 Corn
- 5.4.4 Others
- 5.5 Starches
- 5.5.1 Corn
- 5.5.2 Potato
- 5.5.3 Tapioca (cassava)
- 5.5.4 Wheat
- 5.5.5 Rice
- 5.6 Seasonings and Spices
- 5.6.1 Herbs
- 5.6.2 Spices
- 5.6.3 Blends
- 5.6.4 Salt variants
- 5.7 Proteins
- 5.7.1 Animal
- 5.7.2 Plant
- 5.8 Others
Chapter 6 Market Estimates and Forecast, By Application, 2022-2035 (USD Billion & Tons)
- 6.1 Key trends
- 6.2 Fried Foods
- 6.2.1 Meat & Poultry
- 6.2.2 Seafood
- 6.2.3 Vegetables
- 6.2.4 Cheese & Dairy
- 6.3 Baked Foods
- 6.3.1 Savory
- 6.3.2 Sweet
- 6.4 Snacks and Appetizers
- 6.5 Processed Foods
- 6.6 Confectionery
- 6.7 Others
Chapter 7 Market Estimates and Forecast, By Distribution Channel, 2022-2035 (USD Billion & Tons)
- 7.1 Key trends
- 7.2 Supermarkets/Hypermarket
- 7.3 Retail stores
- 7.4 Online retail
- 7.4.1 E-commerce marketplaces
- 7.4.2 Brand D2C
- 7.5 Others
Chapter 8 Market Estimates and Forecast, By Region, 2022-2035 (USD Billion & Tons)
- 8.1 Key trends
- 8.2 North America
- 8.2.1 U.S.
- 8.2.2 Canada
- 8.3 Europe
- 8.3.1 Germany
- 8.3.2 UK
- 8.3.3 France
- 8.3.4 Spain
- 8.3.5 Italy
- 8.3.6 Rest of Europe
- 8.4 Asia Pacific
- 8.4.1 China
- 8.4.2 India
- 8.4.3 Japan
- 8.4.4 Australia
- 8.4.5 South Korea
- 8.4.6 Rest of Asia Pacific
- 8.5 Latin America
- 8.5.1 Brazil
- 8.5.2 Mexico
- 8.5.3 Argentina
- 8.5.4 Rest of Latin America
- 8.6 Middle East and Africa
- 8.6.1 Saudi Arabia
- 8.6.2 South Africa
- 8.6.3 UAE
- 8.6.4 Rest of Middle East and Africa
Chapter 9 Company Profiles
- 9.1 Archer Daniels Midland Company (ADM)
- 9.2 Cargill Incorporated
- 9.3 Kerry Group
- 9.4 Ingredion Incorporated
- 9.5 Tate & Lyle PLC
- 9.6 Ashland Global Holdings Inc
- 9.7 PGP International, Inc (A Bunge Limited Company)
- 9.8 Dohler Group
- 9.9 Bowman Ingredients
- 9.10 SensoryEffects (A division of Balchem Corporation)
- 9.11 Bunge Limited
- 9.12 Continental Mills, Inc
- 9.13 Givaudan SA
- 9.14 Kerry Taste & Nutrition


